New Semester
Started
Get
50% OFF
Study Help!
--h --m --s
Claim Now
Question Answers
Textbooks
Find textbooks, questions and answers
Oops, something went wrong!
Change your search query and then try again
S
Books
FREE
Study Help
Expert Questions
Accounting
General Management
Mathematics
Finance
Organizational Behaviour
Law
Physics
Operating System
Management Leadership
Sociology
Programming
Marketing
Database
Computer Network
Economics
Textbooks Solutions
Accounting
Managerial Accounting
Management Leadership
Cost Accounting
Statistics
Business Law
Corporate Finance
Finance
Economics
Auditing
Tutors
Online Tutors
Find a Tutor
Hire a Tutor
Become a Tutor
AI Tutor
AI Study Planner
NEW
Sell Books
Search
Search
Sign In
Register
study help
mathematics
statistics
Statistics The Exploration & Analysis Of Data 7th Edition Roxy Peck, Jay L. Devore - Solutions
Research by the Food and Drug Administration (FDA) shows that acrylamide (a possible cancer-causing substance) forms in high-carbohydrate foods cooked at high temperatures and that acrylamide levels can vary widely even within the same brand of food (Associated Press, December 6, 2002). FDA
The technical report €œOzone Season Emissions by State€ (U.S. Environmental Protection Agency, 2002) gave the following nitrous oxide emissions (in thousands of tons) for the 48 states in the continental U.S. states:Use these data to construct a boxplot that shows outliers.
The San Luis Obispo Telegram-Tribune (October 1, 1994) reported the following monthly salaries for super visors from six different counties: $5354 (Kern), $5166 (Monterey), $4443 (Santa Cruz), $4129 (Santa Barbara), $2500 (Placer), and $2220 (Merced). San Luis Obispo County supervisors are supposed
A sample of 26 offshore oil workers took part in a simulated escape exercise, resulting in the accompanying data on time (in seconds) to complete the escape (€œOxygen Consumption and Ventilation During Escape from n Offshore Platform,€ Ergonomics [1997]: 281€“ 292):a.
Because some homes have selling prices that are much higher than most, the median price is usually used to describe a “typical” home price for a given location. The three accompanying quotes are all from the San Luis Obispo Tribune, but each gives a different interpretation of the median price
The accompanying data on number of minutes used for cell phone calls in one month was generated to be consistent with summary statistics published in a report of a marketing study of San Diego residents (Tele- Truth, March 2009):a. Would you recommend the mean or the median as a measure of center
Although bats are not known for their eyesight, they are able to locate prey (mainly insects) by emitting high-pitched sounds and listening for echoes. A paper appearing in Animal Behaviour (“The Echolocation of Flying Insects by Bats” [1960]: 141– 154) gave the
For the data in Exercise 4. 60, subtract 10 from each sample observation. For the new set of values, compute the mean and the deviations from the mean. How do these deviations compare to the deviations from the mean for the original sample? How does s2 for the new values compare to s2 for the old
For the data of Exercise 4. 60, multiply each data value by 10. How does s for the new values compare to s for the original values? More generally, what happens to s if each observation is multiplied by the same positive constant c?
The percentage of juice lost after thawing for 19 different strawberry varieties appeared in the article €œEvaluation of Strawberry Cultivars with Different Degrees of Resistance to Red Scale€ (Fruit Varieties Journal [1991]: 12€“ 17):a. Are there any observations
The risk of developing iron deficiency is especially high during pregnancy. Detecting such a deficiency is complicated by the fact that some methods for determining iron status can be affected by the state of pregnancy itself. Consider the following data on transferrin receptor concentration for a
The paper €œThe Pedaling Technique of Elite Endurance Cyclists€ (International Journal of Sport Bio mechanics [1991]: 29€“ 53) reported the following data on single-leg power at a high workload:a. Calculate and interpret the sample mean and median. x 5 192.571b. Suppose that the first
The paper cited in Exercise 4. 65 also reported values of single-leg power for a low workload. The sample mean for n _ 13 observations was x _ 119.8 (actually 119.7692), and the 14th observation, somewhat of an outlier, was 159. What is the value of x for the entire sample?
The amount of aluminum contamination (in parts per million) in plastic was determined for a sample of 26 plastic specimens, resulting in the following data (€œThe Log Normal Distribution for Modeling Quality Data When the Mean Is Near Zero,€ Journal of Quality Technology [1990]: 105€“
The article €œCan We Really Walk Straight?€ (American Journal of Physical Anthropology [1992]: 19€“27) reported on an experiment in which each of 20 healthy men was asked to walk as straight as possible to a target 60 m away at normal speed. Consider the following data on cadence (number
The article €œComparing the Costs of Major Hotel Franchises€ (Real Estate Review [1992]: 46€“ 51) gave the following data on franchise cost as a percentage of total room revenue for chains of three different types:Construct a boxplot for each type of hotel, and
USA Today (May 9, 2006) published the accompanying average weekday circulation for the 6-month period ending March 31, 2006, for the top 20 newspapers in the country:a. Do you think the mean or the median will be larger for this data set? Explain. b. Compute the values of the mean and the median of
The accompanying data on milk volume (in grams per day) were taken from the paper €œSmoking During Pregnancy and Lactation and Its Effects on Breast Milk Volume€ (American Journal of Clinical Nutrition [1991]: 1011€“ 1016):Compare and contrast the two samples
Age at diagnosis for each of 20 patients under treatment for meningitis was given in the paper €œPenicillin in the Treatment of Meningitis€ (Journal of the American Medical Association [1984]: 1870€“ 1874). The ages (in years) were as follows:a. Calculate the values of the sample mean
Suppose that the distribution of scores on an exam is closely described by a normal curve with mean 100. The 16th percentile of this distribution is 80.a. What is the 84th percentile?b. What is the approximate value of the standard deviation of exam scores?c. What z score is associated with an exam
The chapter introduction gave the accompanying data on the percentage of those eligible for a lowincome subsidy who had signed up for a Medicare drug plan in each of 49 states (information was not available for Vermont) and the District of Columbia (USA Today, May 9, 2006).a. Compute the mean for
The U.S. Department of Transportation reported the number of speeding-related crash fatalities for the 20 days of the year that had the highest number of these fatalities between 1994 and 2003 (Traffic Safety Facts, July 2005).a. Compute the mean number of speeding-related fatalities for these 20
The article “Rocker Shoe Put to the Test: Can it Really Walk the Walk as a Way to Get in Shape?” (USA Today, October 12, 2009) describes claims made by Skechers about Shape-Ups, a shoe line introduced in 2009. These curved-sole sneakers are supposed to help you “get into shape without going
The paper €œTotal Diet Study Statistics on Element Results€ (Food and Drug Administration, April 25, 2000) gave information on sodium content for various types of foods. Twenty-six tomato catsups were analyzed. Data consistent with summary quantities given in the paper
The paper referenced in Exercise 5.10 also gave data on sodium content (in milligrams per kilogram) of 10 chocolate puddings made from instant mix:a. Compute the mean, the standard deviation, and the interquartile range for sodium content of these chocolate puddings. b. Based on the interquartile
A report from Texas Transportation Institute (Texas A&M University System, 2005) on congestion reduction strategies looked into the extra travel time (due to traffic congestion) for commute travel per traveler per year in hours for different urban areas. Below are the data for urban areas that had
The paper €œRelationship Between Blood Lead and Blood Pressure Among Whites and African Americans€ (a technical report published by Tulane University School of Public Health and Tropical Medicine, 2000) gave summary quantities for blood lead level (in micrograms per deciliter) for a sample
Cost-to-charge ratios (the percentage of the amount billed that represents the actual cost) for 11 Oregon hospitals of similar size were reported separately for inpatient and outpatient services. The data are shown in the table at the top of the next column.a. Does there appear to be a strong
The accompanying scatterplot shows observations on hemoglobin level, determined both by the standard spectrophotometric method (y) and by a new, simpler method based on a color scale (x) (€œA Simple and Reliable Method for Estimating Hemoglobin,€ Bulletin of the World Health Organization
In the article “Reproductive Biology of the Aquatic Salamander Amphiuma tridactylum in Louisiana” (Journal of Herpetology [1999]: 100–105), 14 female salamanders were studied. Using regression, the researchers predicted y = clutch size (number of salamander eggs) from x = snout-vent length
Exercise CR5.16 gave the least-squares regression line for predicting y = clutch size from x = snoutvent length (“Reproductive Biology of the Aquatic Salamander Amphiuma tridactylum in Louisiana,” Journal of Herpetology [1999]: 100–105). The paper also reported r2 = .7664 and SSTo =
A study, described in the paper €œPrediction of De fibrillation Success from a Single Defibrillation Threshold Measurement€ (Circulation [1988]: 1144€“ 1149) investigated the relationship between defibrillation success and the energy of the defibrillation shock (expressed as a multiple
The paper €œPopulation Pressure and Agricultural Intensity€ (Annals of the Association of American Geographers [1977]: 384€“396) reported a positive association between population density and agricultural intensity. The following data consist of measures of population density (x) and
Data from a survey of 1046 adults age 50 and older were summarized in the AARP Bulletin (November 2009). The following table gives relative frequency distributions of the responses to the question, €œHow much do you plan to spend for holiday gifts this year?€ for respondents
The graph in Figure CR5.3 appeared in the report “Testing the Waters 2009” (Natural Resources Defense Council). Spend a few minutes looking at the graph and reading the caption that appears with the graph. Briefly explain how the graph supports the claim that discharges of polluted storm water
The cost of Internet access was examined in the report “Home Broadband Adoption 2009” (pewinternet.org). In 2009, the mean and median amount paid monthly for service for broadband users was reported as $39.00 and $38.00, respectively. For dial-up users, the mean and median amount paid monthly
Foal weight at birth is an indicator of health, so it is of interest to breeders of thoroughbred horses. Is foal weight related to the weight of the mare (mother)? The accompanying data are from the paper €œSuckling Behaviour Does Not Measure Milk Intake in Horses€ (Animal Behaviour [1999]:
Bidri is a popular and traditional art form in India. Bidri articles (bowls, vessels, and so on) are made by casting from an alloy containing primarily zinc along with some copper. Consider the following observations on copper content (%) for a sample of Bidri artifacts in London€™s Victoria
Medicare’s new medical plans offer a wide range of variations and choices for seniors when picking a drug plan (San Luis Obispo Tribune, November 25, 2005). The monthly cost for a stand-alone drug plan can vary from a low of $1.87 in Montana, Wyoming, North Dakota, South Dakota, Nebraska,
This exercise requires the use of a computer. Refer to the Medicare drug plan premium data of Exercise 5.8.a. Construct a dotplot or a stem-and-leaf display of the lowest premium cost data.b. Based on the display in Part (a), which of the following would you expect to be the case for the lowest
For each of the following pairs of variables, indicate whether you would expect a positive correlation, a negative correlation, or a correlation close to 0. Explain your choice. a. Maximum daily temperature and cooling costs b. Interest rate and number of loan applications c. Incomes of husbands
The accompanying data were read from graphs that appeared in the article €œBush Timber Proposal Runs Counter to the Record€ (San Luis Obispo Tribune, September 22, 2002). The variables shown are the number of acres burned in forest fires in the western United States and timber
It may seem odd, but one of the ways biologists can tell how old a lobster is involves measuring the concentration of a pigment called neurolipofuscin in the eyestalk of a lobster. (We are not making this up!) The authors of the paper €œNeurolipofuscin is a Measure of Age in
A sample of automobiles traversing a certain stretch of highway is selected. Each one travels at roughly a constant rate of speed, although speed does vary from auto to auto. Let x = speed and y = time needed to traverse this segment of highway. Would the sample correlation coefficient be closest
The article €œAir Pollution and Medical Care Use by Older Americans€ (Health Affairs [2002]: 207€“214) gave data on a measure of pollution (in micrograms of particulate matter per cubic meter of air) and the cost of medical care per person over age 65 for six geographical regions of the
The authors of the paper €œEvaluating Existing Movement Hypotheses in Linear Systems Using Larval Stream Salamanders€ (Canadian Journal of Zoology [2009]: 292€“298) investigated whether water temperature was related to how far a salamander would swim and whether it
The article €œCalifornia State Parks Closure List Due Soon€ (The Sacramento Bee, August 30, 2009) gave the following data on x = number of visitors in fiscal year 2007€“2008 and y = percentage of operating costs covered by park revenues for the 20 state park districts
A sample of 548 ethnically diverse students from Massachusetts were followed over a 19-month period from 1995 and 1997 in a study of the relationship between TV viewing and eating habits (Pediatrics [2003]: 1321–1326). For each additional hour of television viewed per day, the number of fruit and
The relationship between hospital patient-tonurse ratio and various characteristics of job satisfaction and patient care has been the focus of a number of research studies. Suppose x = patient-to-nurse ratio is the predictor variable. For each of the following potential dependent variables,
The accompanying data on x = head circumference z score (a comparison score with peers of the same age€”a positive score suggests a larger size than for peers) at age 6 to 14 months and y = volume of cerebral grey matter (in ml) at age 2 to = years were read from a graph in the article
Studies have shown that people who suffer sudden cardiac arrest have a better chance of survival if a defibrillator shock is administered very soon after cardiac arrest. How is survival rate related to the time between when cardiac arrest occurs and when the defibrillator shock is delivered? This
The data given in the previous exercise on x 5 call-to-shock time (in minutes) and y = survival rate (percent) were used to compute the equation of the leastsquares line, which was y^ = 101.33 2 9.30x The newspaper article “FDA OKs Use of Home Defibrillators” (San Luis Obispo Tribune, November
An article on the cost of housing in California that appeared in the San Luis Obispo Tribune (March 30, 2001) included the following statement: “In Northern California, people from the San Francisco Bay area pushed into the Central Valley, benefiting from home prices that dropped on average $4000
The following data on sale price, size, and land-to-building ratio for 10 large industrial properties appeared in the paper €œUsing Multiple Regression Analysis in Real Estate Appraisal€ (Appraisal Journal [2002]: 424€“430):a. Calculate and interpret the value of the
Representative data read from a plot that appeared in the paper €œEffect of Cattle Treading on Erosion from Hill Pasture: Modeling Concepts and Analysis of Rainfall Simulator Data€ (Australian Journal of Soil Research [2002]: 963€“977) on runoff sediment concentration
Explain why it can be dangerous to use the leastsquares line to obtain predictions for x values that are substantially larger or smaller than those contained in the sample.
The sales manager of a large company selected a random sample of n = 10 salespeople and determined for each one the values of x = years of sales experience and y = annual sales (in thousands of dollars). A scatterplot of the resulting (x, y) pairs showed a linear pattern. a. Suppose that the sample
Explain why the slope b of the least-squares line always has the same sign (positive or negative) as does the sample correlation coefficient.
a. Because 1 lb = 0.4536 kg, strength observations can be re-expressed in kilograms through multiplication by this conversion factor: new y = 0.4536(old y). What is the equation of the least-squares line when y is expressed in kilograms? y^ = 2424.7 + 3.891xb. More generally, suppose that each y
The data in the accompanying table is from the paper €œSix-Minute Walk Test in Children and Adolescents€ (The Journal of Pediatrics [2007]: 395€“399). Two hundred and eighty boys completed a test that measures the distance that the subject can walk on a flat, hard surface in 6 minutes.
Draw two scatterplots, one for which r = 1 and a second for which r = 21.
The paper referenced in the previous exercise also gave the 6-minute walk distances for 248 girls age 3 to 18 years. The median 6-minute walk times for girls for the five age groups werea. With x = representative age and y = median distance walked in 6 minutes, construct a scatterplot. How does the
Data on pollution and cost of medical care for elderly people were given in Exercise 5.14 and are also shown here. The accompanying data are a measure of pollution (micrograms of particulate matter per cubic meter of air) and the cost of medical care per person over age 65 for six geographic
Northern flying squirrels eat lichen and fungi, which makes for a relatively low quality diet. The authors of the paper €œNutritional Value and Diet Preference of Arboreal Lichens and Hypogeous Fungi for Small Mammals in the Rocky Mountain€ (Canadian Journal of Zoology [2008]:
The relationship between x = total number of salmon in a creek and y = percentage of salmon killed by bears that were transported away from the stream prior to the bear eating the salmon was examined in the paper €œTransportation of Pacific Salmon Carcasses from Streams to Riparian
The paper €œEffects of Age and Gender on Physical Performance€ (Age [2007]: 77€“85) describes a study of the relationship between age and 1-hour swimming performance. Data on age and swim distance for over 10,000 men participating in a national long-distance 1-hour
Data on x = representative age and y = 6-minute walk time for boys were given in Exercise 5.29. Compute the values of se and r2 for these data. What do these values tell you about the fit of the least-squares line?
Cost-to-charge ratio (the percentage of the amount billed that represents the actual cost) for inpatient and outpatient services at 11 Oregon hospitals is shown in the following table (Oregon Department of Health Services, 2002). A scatterplot of the data is also shown.The least-squares regression
The article “Examined Life: What Stanley Kaplan Taught Us About the SAT” (The New Yorker [December 17, 2001]: 86–92) included a summary of findings regarding the use of SAT I scores, SAT II scores, and high school grade point average (GPA) to predict first year college GPA. The article states
The paper €œAccelerated Telomere Shortening in Response to Life Stress€ (Proceedings of the National Academy of Sciences [2004]: 17312€“17315) described a study that examined whether stress accelerates aging at a cellular level. The accompanying data on a measure of
The article €œCalifornia State Parks Closure List Due Soon€ (The Sacramento Bee, August 30, 2009) gave the following data on y = number of employees in fiscal year 2007€“2008 and x = total size of parks (in acres) for the 20 state park districts in California:a.
The article “That’s Rich: More You Drink, More You Earn” (Calgary Herald, April 16, 2002) reported that there was a positive correlation between alcohol consumption and income. Is it reasonable to conclude that increasing alcohol consumption will increase income? Give at least two reasons or
The article referenced in the previous exercise also gave data on the percentage of operating costs covered by park revenues for the 2007€“2008 fiscal year.a. Find the equation of the least-squares line relating y = percent of operating costs covered by park revenues and x = number of
A study was carried out to investigate the relationship between the hardness of molded plastic (y, in Brinell units) and the amount of time elapsed since termination of the molding process (x, in hours). Summary quantities include n = 15, SSResid = 1235.470, andSSTo = 25,321.368. Calculate and
Both r2 and se are used to assess the fit of a line. a. Is it possible that both r2 and se could be large for a bivariate data set? Explain. (A picture might be helpful.) b. Is it possible that a bivariate data set could yield values of r 2 and se that are both small? Explain. (Again, a picture
With a bit of algebra, we can show thata. For what value of r is se as large as sy? What is the least-squares line in this case? r = 0, y^ = yb. For what values of r will se be much smaller than sy?c. A study by the Berkeley Institute of Human Development (see the book Statistics by Freedman et
Example 5.5 described a study of the effectiveness of pomegranate fruit extract (PFE) in slowing the growth of prostate cancer tumors (Proceedings of the National Academy of Sciences [October 11, 2005]: 14813€“14818]. Figure 5.11 from that example is reproduced here. Based on this figure,
Example 5.15 described a study that involved substituting sunflower meal for a portion of the usual diet of farm-raised sea breams (Aquaculture [2007]: 528€“534). This paper also gave data on y = feed intake (in grams per 100 grams of fish per day) and x = percentage sunflower meal in the
The paper €œCommercially Available Plant Growth Regulators and Promoters Modify Bulk Tissue Abscisic Acid Concentrations in Spring Barley, but not Root Growth and Yield Response to Drought€ (Apa plied Biology [2006]: 291€“304) describes a study of the drought response
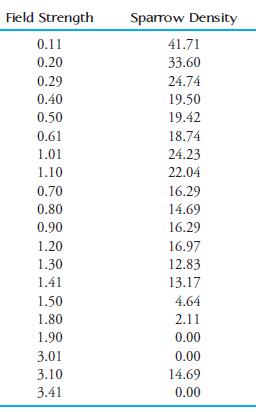
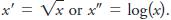
Is electromagnetic radiation from phone antennae associated with declining bird populations? This is one of the questions addressed by the authors of the paper “The Urban Decline of the House Sparrow (Passer domesticus): A Possible Link with Electromagnetic Radiation” (Electromagnetic Biology
The paper €œEffects of Age and Gender on Physical Performance€ (Age [2007]: 77€“85) describes a study of the relationship between age and 1-hour swimming performance. Data on age and swim distance for over 10,000 men participating in a national long-distance 1-hour
The accompanying data are x = cost (cents per serving) and y = fiber content (grams per serving) for 18 high-fiber cereals rated by Consumer Reports(www .consumerreports.org/health).a. Compute and interpret the correlation coefficient for this data set. b. The serving size differed for the
The paper “Developmental and Individual Differences in Pure Numerical Estimation” (Developmental Psychology [2006]: 189–201) describes a study of how young children develop the ability to estimate lengths. Children were shown a piece of paper with two lines. One line was a short line labeled
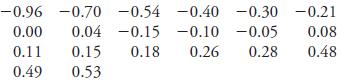
Researchers have examined a number of climatic variables in an attempt to understand the mechanisms that govern rainfall runoff. The paper “The Applicability of Morton’s and Penman’s Evapotranspiration Estimates in Rainfall-Runoff Modeling” (Water Resources Bulletin [1991]: 611–620)
The report €œOlder Driver Involvement in Injury Crashes in Texas€ (Texas Transportation Institute, 2004) included a scatterplot of y = fatality rate (percentage of drivers killed in injury crashes) versus x = driver age. The accompanying data are approximate values read from the
The article €œOrgan Transplant Demand Rises Five Times as Fast as Existing Supply€ (San Luis Obispo Tribune, February 23, 2001) included a graph that showed the number of people waiting for organ transplants each year from 1990 to 1999. The following data are approximate values
Penicillin was administered orally to five different horses, and the concentration of penicillin in the blood was determined after five different lengths of time. The following data on x = elapsed time (in hours) and y = penicillin concentration (in mg/ml) appeared in the paper €œAbsorption and
Determining the age of an animal can sometimes be a dif fi cult task. One method of estimating the age of harp seals is based on the width of the pulp canal in the seal€™s canine teeth. To investigate the relationship between age and the width of the pulp canal, researchers measured age and
Anabolic steroid abuse has been increasing despite increased press reports of adverse medical and psychiatric consequences. In a recent study, medical researchers studied the potential for addiction to testosterone in hamsters (Neuroscience [2004]: 971€“981). Hamsters were allowed to
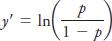
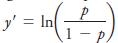
Does high school GPA predict success in first year college English? The proportion with a grade of C or better in freshman English for students with various high school GPAs for freshmen at Cal Poly, San Luis Obispo, in fall of 2007 is summarized in the accompanying table. Fit a logistic regression
a. What is the logistic regression function relating x and the proportion of plants with virus symptoms?b. What would you predict for the proportion of plants with virus symptoms at a distance of 15 meters from the edge of the field?
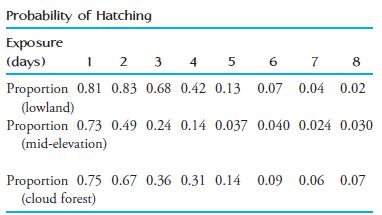
The paper “The Shelf Life of Bird Eggs: Testing Egg Viability Using a Tropical Climate Gradient” (Ecology [2005]: 2164–2175) investigated the effect of altitude and length of exposure on the hatch rate of thrasher eggs. Data consistent with the estimated probabilities of hatching after a
The authors of the paper €œFlat-footedness is Not a Disadvantage for Athletic Performance in Children Aged 11 to 15 Years€ (Pediatrics [2009]: e386€“e392) studied the relationship between y = arch height and scores on a number of different motor ability tests for 218
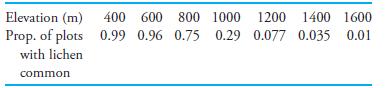
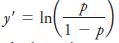
As part of a study of the effects of timber management strategies (Ecological Applications [2003]: 1110– 1123) investigators used satellite imagery to study abundance of the lichen Lobaria oregano at different elevations. Abundance of a species was classified as “common” if there were more
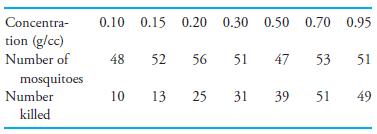
The hypothetical data below are from a toxicity study designed to measure the effectiveness of different doses of a pesticide on mosquitoes. The table below summarizes the concentration of the pesticide, the sample sizes, and the number of critters dispatched. a. Make a scatterplot of the
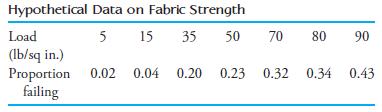
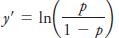
In the study of textiles and fabrics, the strength of a fabric is a very important consideration. Suppose that a significant number of swatches of a certain fabric are subjected to different “loads” or forces applied to the fabric. The data from such an experiment might look as follows: a.
The “Admitted Students Highlights Report 2009” prepared by The College Board for Cal Poly San Luis Obispo summarizes responses to a survey completed by 2001 new students who enrolled at Cal Poly in fall 2008 and by 2000 students who were admitted to Cal Poly for the fall 2008 term but who
The following is an excerpt from a letter to the editor written by Roger Cleary that appeared in the San Luis Obispo Tribune (September 16, 2008): The causes of poor fuel economy have nothing to do with higher highway speeds, notwithstanding all the press hoopla, including the July 19 Miami Herald
The paper €œHow Lead Exposure Relates to Temporal Changes in IQ, Violent Crime, and Unwed Pregnancy€ (Environmental Research [2000]: 1€“22) investigated whether childhood lead exposure is related to criminal behavior in young adults. Using historical data, the author
The following quote is from the paper €œEvaluation of the Accuracy of Different Methods Used to Estimate Weights in the Pediatric Population€ (Pediatrics [2009]: e1045€“e1051): As expected, the model demonstrated that weight increased with age, but visual inspection
Showing 33600 - 33700
of 88243
First
330
331
332
333
334
335
336
337
338
339
340
341
342
343
344
Last
Step by Step Answers
.png)
.png)
.png)

.png)
.png)
.png)
.png)
.png)
.png)
.png)
.png)
.png)
.png)
.png)
-1.png)
.png)
.png)
.png)
.png)
.png)
.png)
.png)
.png)
.png)
-2.png)
.png)
.png)
.png)
.png)
.png)
.png)
-1.png)
.png)
.png)
.png)
-1.png)
-2.png)
-3.png)
-1.png)
-1.png)
.png)
-1.png)
-1.png)
.png)
.png)
-1.png)
-2.png)
-3.png)
-1.png)
.png)
-1.png)
-2.png)
.png)
.png)
-1.png)
-2.png)
.png)
.png)
.png)
.png)
.png)
.png)

