New Semester
Started
Get
50% OFF
Study Help!
--h --m --s
Claim Now
Question Answers
Textbooks
Find textbooks, questions and answers
Oops, something went wrong!
Change your search query and then try again
S
Books
FREE
Study Help
Expert Questions
Accounting
General Management
Mathematics
Finance
Organizational Behaviour
Law
Physics
Operating System
Management Leadership
Sociology
Programming
Marketing
Database
Computer Network
Economics
Textbooks Solutions
Accounting
Managerial Accounting
Management Leadership
Cost Accounting
Statistics
Business Law
Corporate Finance
Finance
Economics
Auditing
Tutors
Online Tutors
Find a Tutor
Hire a Tutor
Become a Tutor
AI Tutor
AI Study Planner
NEW
Sell Books
Search
Search
Sign In
Register
study help
mathematics
statistics
Managing Controlling and Improving Quality 1st edition Douglas C. Montgomery, Cheryl L. Jennings, Michele E. Pfund - Solutions
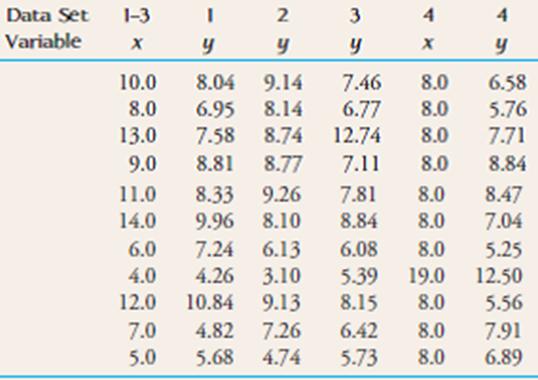
Consider the following four (x, y) data sets: the first three have the same x values, so these values are listed only once (from "Graphs in Statistical Analysis," American Statistician [1973]: 17- 21). For each of these data sets, the values of the summary quantitiesare identical, so all
The accompanying scatterplot, based on 34 sediment samples with x = sediment depth (cm) and y = oil and grease content (mg/kg), appeared in the article €œMined Land Reclamation Using Polluted Urban Navigable Waterway Sediments€ (Journal of Environmental Quality [1984]: 415€“422). Discuss
The article €œImproving Fermentation Productivity with Reverse Osmosis€ (Food Technology [1984]: 92€“ 96) gave the following data (read from a scatterplot) on y = glucose concentration (g/L) and x = fermentation time (days) for a blend of malt liquor.a. Use the data to calculate the
The figure at the top of the page is based on data from the article €œRoot and Shoot Competition Intensity Along a Soil Depth Gradient€ (Ecology [1995]: 673€“ 682). It shows the relationship between aboveground biomass and soil depth within the experimental plots. The
Give a brief answer, comment, or explanation for each of the following.a. What is the difference between e1, e2, . . . , en and the n residuals?b. The simple linear regression model states that y = a 1bx.c. Does it make sense to test hypotheses about b?d. SSResid is always positive.e. A student
The authors of the paper €œWeight-Bearing Activity during Youth Is a More Important Factor for Peak Bone Mass than Calcium Intake€ (Journal of Bone and Mineral Research [1994], 1089€“1096) studied a number of variables they thought might be related to bone mineral density (BMD). The
Hormone replacement therapy (HRT) is thought to increase the risk of breast cancer. The accompanying data on x = percent of women using HRT and y = breast cancer incidence (cases per 100,000 women) for a region in Germany for = years appeared in the paper €œDecline in Breast Cancer
The accompanying summary quantities resulted from a study in which x was the number of photocopy machines serviced during a routine service call and y was the total service time (minutes):a. What proportion of observed variation in total service time can be explained by a linear relationship
Explain the difference between a deterministic and a probabilistic model. Give an example of a dependent variable y and two or more independent variables that might be related to y deterministically. Give an example of a dependent variable y and two or more independent variables that might be
The relationship between yield of maize, date of planting, and planting density was investigated in the article “Development of a Model for Use in Maize Replant Decisions” (Agronomy Journal [1980]: 459–464). Let y = percent maize yield x1 = planting date 1days after April 202 x2 =
Suppose that the variables y, x1, and x2 are related by the regression model y 5 1.8 1 .1x1 1 .8x2 1 e a. Construct a graph (similar to that of Figure 14.5) showing the relationship between mean y and x2 for fixed values 10, 20, and 30 of x1. b. Construct a graph depicting the relationship between
A manufacturer of wood stoves collected data on y = particulate matter concentration and x1 = flue temperature for three different air intake settings (low, medium, and high).a. Write a model equation that includes indicator variables to incorporate intake setting, and interpret each of the b
Consider a regression analysis with three independent variables x1, x2, and x3. Give the equation for the following regression models:a. The model that includes as predictors all independent variables but no quadratic or interaction terms;b. The model that includes as predictors all independent
The article €œThe Value and the Limitations of High-Speed Turbo-Exhausters for the Removal of Tar-Fog from Carburetted Water-Gas€ (Society of Chemical Industry Journal [1946]: 166€“168) presented data on y = tar content (grains/100 ft3) of a gas stream as a function of x1 = rotor speed
Consider the dependent variable y = fuel efficiency of a car (mpg).a. Suppose that you want to incorporate size class of car, with four categories (subcompact, compact, midsize, and large), into a regression model that also includes x1 = age of car and x2 = engine size. Define the necessary
When coastal power stations take in large quantities of cooling water, it is inevitable that a number of fish are drawn in with the water. Various methods have been designed to screen out the fish. The article €œMultiple Regression Analysis for Forecasting Critical Fish Influxes at Power
Obtain as much information as you can about the P-value for an upper-tailed F test in each of the following situations: a. df1 = 3, df2 = 15, calculated F = 4.23 b. df1 = 4, df2 = 18, calculated F = 1.95 c. df1 = 5, df2 = 20, calculated F = 4.10 d. df1 = 4, df2 = 35, calculated F = 4.58
Obtain as much information as you can about the P-value for the F test for model utility in each of the following situations: a. k = 2, n = 21, calculated F = 2.47 b. k = 8, n = 25, calculated F = 5.98 c. k = 5, n = 26, calculated F = 3.00 d. The full quadratic model based on x1 and x2 is fit, n =
Data from a sample of n = 150 quail eggs were used to fit a multiple regression model relating y = eggshell surface area (mm2) x1 = egg weight (g) x2 = egg width (mm) x3 = egg length (mm) (€œPredicting Yolk Height, Yolk Width, Albumen Length, Eggshell Weight, Egg Shape Index, Eggshell Thickness,
The authors of the paper “Weight-Bearing Activity during Youth Is a More Important Factor for Peak Bone Mass than Calcium Intake” (Journal of Bone and Mineral Density [1994]: 1089–1096) used a multiple regression model to describe the relationship between y = bone mineral density 1g/cm32 x1 =
This exercise requires the use of a computer package. The paper €œHabitat Selection by Black Bears in an Intensively Logged Boreal Forrest€ (Canadian Journal of Zoology [2008]: 1307€“1316) gave the accompanying data on n 5 11 female black bears.a. Fit a multiple regression model to
The ability of ecologists to identify regions of greatest species richness could have an impact on the preservation of genetic diversity, a major objective of the World Conservation Strategy. The article €œPrediction of Rarities from Habitat Variables: Coastal Plain Plants on Nova Scotian
The article “Impacts of On-Campus and Off- Campus Work on First-Year Cognitive Outcomes” (Journal of College Student Development [1994]: 364– 370) reported on a study in which y = spring math comprehension score was regressed against x1 = previous fall test score, x2 = previous fall academic
Is the model fit in Exercise 14.16 useful? Carry out a test using a significance level of .10.
The accompanying Minitab output results from fitting the model described in Exercise 14.14 to data.a. What is the estimated regression equation?b. Using a .01 significance level, perform the model utility test.c. Interpret the values of R2 and se given in the output.
For the multiple regression model in Exercise 14.6, the value of R2 was .06 and the adjusted R2 was .06. The model was based on a data set with 1136 observations. Perform a model utility test for this regression.
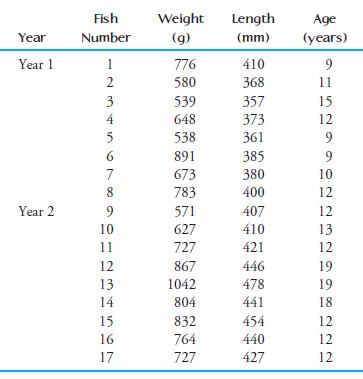
The article “Movement and Habitat Use by Lake Whitefish During Spawning in a Boreal Lake: Integrating Acoustic Telemetry and Geographic Information Systems” (Transactions of the American Fisheries Society [1999]: 939–952) included the accompanying data on 17 fish caught in 2 consecutive
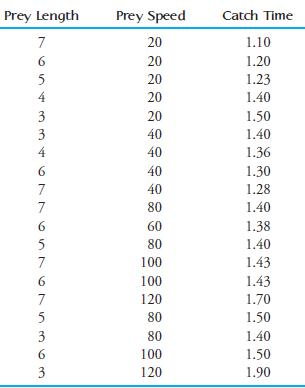
This exercise requires the use of a computer package. The authors of the article “Absolute Versus per Unit Body Length Speed of Prey as an Estimator of Vulnerability to Predation” (Animal Behaviour [1999]: 347– 352) found that the speed of a prey (twips/s) and the length of a prey (twips 100)
This exercise requires the use of a computer package. The article “Vital Dimensions in Volume Perception: Can the Eye Fool the Stomach?” (Journal of Marketing Research [1999]: 313–326) gave the data below on dimensions of 27 representative food products.a. Fit a multiple regression model for
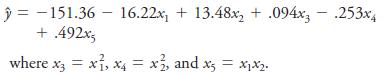
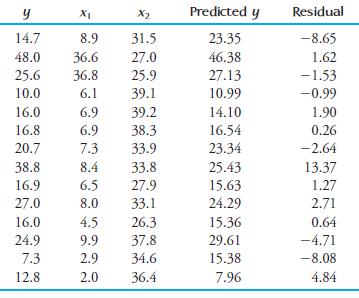
The article “The Undrained Strength of Some Thawed Permafrost Soils” (Canadian Geotechnical Journal [1979]: 420–427) contained the accompanying data (see page 830) on y = shear strength of sandy soil (kPa), x1 = depth (m), and x2 = water content (%). The predicted values and
A number of investigations have focused on the problem of assessing loads that can be manually handled in a safe manner. The article €œAnthropometric, Muscle Strength, and Spinal Mobility Characteristics as Predictors in the Rating of Acceptable Loads in Parcel Sorting€ (Ergonomics [1992]:
The article “Readability of Liquid Crystal Displays: A Response Surface” (Human Factors [1983]: 185–190) used an estimated regression equation to describe the relationship between y = error percentage for subjects reading a four-digit liquid crystal display and the independent variables x1 =
The article “Effect of Manual Defoliation on Pole Bean Yield” (Journal of Economic Entomology [1984]: 1019–1023) used a quadratic regression model to describe the relationship between y = yield (kg/plot) and x = defoliation level (a proportion between 0 and 1). The estimated regression
Suppose that a multiple regression data set consists of n = 15 observations. For what values of k, the number of model predictors, would the corresponding model with R2 = .90 be judged useful at significance level .05? Does such a large R2 value necessarily imply a useful model? Explain.
Use the data given in Exercise 14.29 to verify that the true regression function
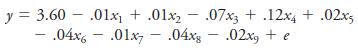
The accompanying data resulted from a study of the relationship between y = brightness of finished paper and the independent variables x1 = hydrogen peroxide (% by weight), x2 = sodium hydroxide (% by weight), x3 = silicate (% by weight), and x4 = process temperature (“Advantages of CE-HDP
The cotton aphid poses a threat to cotton crops in Iraq. The accompanying data on y = infestation rate (aphids/100 leaves) x1 = mean temperature (C) x2 = mean relative humidity appeared in the article €œEstimation of the Economic Threshold of Infestation for Cotton Aphid€ (Mesopotamia
The following statement appeared in the article “Dimensions of Adjustment Among College Women” (Journal of College Student Development [1998]: 364): Regression analyses indicated that academic adjustment and race made independent contributions to academic achievement, as measured by current
The authors of the paper “Predicting Yolk Height, Yolk Width, Albumen Length, Eggshell Weight, Egg Shape Index, Eggshell Thickness, Egg Surface Area of Japanese Quails Using Various Egg Traits as Regressors” (International Journal of Poultry Science [2008]: 85–88) used a multiple regression
According to “Assessing the Validity of the Post-Materialism Index” (American Political Science Review [1999]: 649–664), one may be able to predict an individual’s level of support for ecology based on demographic and ideological characteristics. The multiple regression model proposed
The article €œThe Influence of Temperature and Sunshine on the Alpha-Acid Contents of Hops€ (Agricultural Meteorology [1974]: 375€“382) used a multiple regression model to relate y = yield of hops to x1 = average temperature (C) between date of coming into hop and
a. Assume that this is the correct equation. What is the mean value of y when x1 = 10, x2 = .5, x3 = 50, and x4 = 100?b. What mean error percentage is associated with a backlight level of 20, character subtense of .5, viewing angle of 10, and ambient light level of 30?c. Interpret the values of b2
The article “Pulp Brightness Reversion: Influence of Residual Lignin on the Brightness Reversion of Bleached Sulfite and Kraft Pulps” (TAPPI [1964]: 653–662) proposed a quadratic regression model to describe the relationship between x = degree of delignification during the processing of wood
Give as much information as you can about the P-value for an upper-tailed F test in each of the following situations. a. df1 = 4, df2 = 15, F = 5.37 b. df1 = 4, df2 = 15, F = 1.90 c. df1 = 4, df2 = 15, F = 4.89 d. df1 = 3, df2 = 20, F = 14.48 e. df1 = 3, df2 = 20, F = 2.69 f. df1 = 4, df2 = 50, F =
The article “Compression of Single-Wall Corrugated Shipping Containers Using Fixed and Floating Text Platens” (Journal of Testing and Evaluation [1992]: 318–320) described an experiment in which several different types of boxes were compared with respect to compression strength (in pounds).
In the introduction to this chapter, we considered a study comparing three groups of college students (soccer athletes, non-soccer athletes, and a control group consisting of students who did not participate in intercollegiate sports). The following information on scores from the Hopkins Verbal
The accompanying data on calcium content of wheat are consistent with summary quantities that appeared in the article €œMineral Contents of Cereal Grains as Affected by Storage and Insect Infestation€ (Journal of Stored Products Research [1992]: 147€“151). Four
In an experiment to investigate the performance of four different brands of spark plugs intended for use on a 125-cc motorcycle, five plugs of each brand were tested, and the number of miles (at a constant speed) until failure was observed. A partially completed ANOVA table is given. Fill in the
Leaf surface area is an important variable in plant gas-exchange rates. Dry matter per unit surface area (mg/cµ3) was measured for trees raised under three different growing conditions. Let µ1, µ2, and µ3 represent the mean dry matter per unit surface area for the growing conditions 1, 2, and
The accompanying underscoring pattern appears in the article €œWomen€™s and Men€™s Eating Behavior Following Exposure to Ideal-Body Images and Text€ (Communications Research [2006]: 507€“529). Women either viewed slides depicting images of thin
The paper referenced in the previous exercise also gave the following underscoring pattern for men.a. Write a few sentences interpreting this underscoring pattern. b. Using your answers from Part (a) and from the previous exercise, write a few sentences describing the differences between how men
The paper referenced in Exercise 15.5 described an experiment to determine if restrictive age labeling on video games increased the attractiveness of the game for boys age 12 to 13. In that exercise, the null hypothesis of H0: µ1 = µ2 = µ3 = m4, where µ1 is the population
The authors of the paper €œBeyond the Shooter Game: Examining Presence and Hostile Outcomes among Male Game Players€ (Communication Research [2006]: 448€“466) studied how video-game content might influence attitudes and behavior. Male students at a large Midwestern university were
Give as much information as you can about the P-value of the single-factor ANOVA F test in each of the following situations. a. k = 5, n1 = n2 = n3 = n4 = n5 = 4, F = 5.37 b. k = 5, n1 = n2 = n3 = 5, n4 = n5 = 4, F = 2.83 c. k = 3, n1 = 4, n2 = 5, n3 = 6, F = 5.02 d. k = 3, n1 = n2 = 4, n3 = 6, F =
The accompanying data resulted from a flammability study in which specimens of five different fabrics were tested to determine burn times.MSTr = 23.67 MSE = 1.39 F = 17.08 P-value = .000 The accompanying output gives the T-K intervals as calculated by Minitab. Identify significant differences and
Do lizards play a role in spreading plant seeds? Some research carried out in South Africa would suggest so (€œDispersal of Namaqua Fig [Ficus cordata cordata] Seeds by the Augrabies Flat Lizard [Platysaurus broadleyi],€ Journal of Herpetology [1999]: 328€“330). The
Samples of six different brands of diet or imitation margarine were analyzed to determine the level of physiologically active polyunsaturated fatty acids (PAPUFA, in percent), resulting in the data shown in the accompanying table. (The data are fictitious, but the sample means agree with data
Employees of a certain state university system can choose from among four different health plans. Each plan differs somewhat from the others in terms of hospitalization coverage. Four samples of recently hospitalized individuals were selected, each sample consisting of people covered by a different
The accompanying summary statistics for a measure of social marginality for samples of youths, young adults, adults, and seniors appeared in the paper €œPerceived Causes of Loneliness in Adulthood€ (Journal of Social Behavior and Personality [2000]: 67€“84). The social marginality score
The authors of the paper €œAge and Violent Content Labels Make Video Games Forbidden Fruits for Youth€ (Pediatrics [2009]: 870€“876) carried out an experiment to determine if restrictive labels on video games actually increased the attractiveness of the game for young game players.
The paper referenced in the previous exercise also gave data for 12- to 13-year-old girls. Data consistent with summary values in the paper are shown below. Do the data provide convincing evidence that the mean rating associated with the game description for 12- to 13-year-old girls is not the same
The paper “Women’s and Men’s Eating Behavior Following Exposure to Ideal-Body Images and Text” (Communication Research [2006]: 507–529) describes an experiment in which 74 men were assigned at random to one of four treatments: 1. Viewed slides of fit, muscular men 2. Viewed slides of fit,
Can use of an online plagiarism-detection system reduce plagiarism in student research papers? The paper €œPlagiarism and Technology: A Tool for Coping with Plagiarism€ (Journal of Education for Business [2005]: 149€“152) describes a study in which randomly selected research papers
The experiment described in Example 15.4 also gave data on change in body fat mass for men (€œGrowth Hormone and Sex Steroid Administration in Healthy Aged Women and Men,€ Journal of the American Medical Association [2002]: 2282€“2292). Each of 74 male subjects who were over age 65 was
Why is it difficult to define quality?
Discuss the statement “Quality is the responsibility of the quality department.”
Most of the quality management literature state that without top management leadership, quality improvement will not occur. Do you agree or disagree with this statement? Discuss why.
Explain why it is necessary to consider variability around the mean or nominal dimension as a measure of quality.
Suppose you had the opportunity to improve quality in a hospital. Which areas of the hospital would you look to as opportunities for quality improvement? What metrics would you use as measures of quality?
Suppose you had to improve service quality in a bank credit card application and approval process. What critical-to-quality characteristics would you identify? How could you go about improving this system?
How would quality be defined in the following organization?a) Health-care facility b) Department store c) Grocery store d) University academic department
Briefly discuss the eight dimensions of quality. Does this improve our understanding of quality?
Select a specific product or service and discuss how the eight dimensions of quality impact its overall acceptance by consumers.
Is there a difference between quality for a manufactured product and quality for a service? Give some specific examples.
Can an understanding of the multidimensional nature of quality lead to improved product design or better service?
What is meant by the cost of quality?
Are internal failure costs more or less important than external failure costs?
Is Deming’s philosophy more or less focused on statistics than Juran?
Describe a service system that you use. What are the CTQs that are important to you? How do you think that DMAIC could be applied to this process?
One of the objectives of the control plan in DMAIC is to “hold the gain.” What does this mean?
Is there a point at which seeing further improvement in quality and productivity isn’t economically advisable? Discuss your answer.
Explain the importance of tollgates in the DMAIC process.
An important part of a project is to identify the key process input variables (KPIV) and key process output variables (KPOV). Suppose that you are the owner/manager of a small business that provides mailboxes, copy services, and mailing services. Discuss the KPIVs and KPOVs for this business. How
An important part of a project is to identify the key process input variables (KPIV) and key process output variables (KPOV). Suppose that you are in charge of a hospital emergency room. Discuss the KPIVs and KPOVs for this business. How do they relate to possible customer CTQs?
Why are designed experiments most useful in the improve step of DMAIC?
Suppose that your business is operating at the three-sigma quality level. If projects have an average improvement rate of 50% annually, how many years will it take to achieve six-sigma quality?
Suppose that your business is operating at the four-and-a-half-sigma quality level. If projects have an average improvement rate of 50% annually, how many years will it take to achieve six-sigma quality?
Explain why it is important to separate sources of variability into special or assignable causes and common or chance causes.
What is the Juran Trilogy?
Consider improving service quality in a restaurant. What are the KPIVs and KPOVs that you should consider? How do these relate to likely customer CTQs?
Suppose that during the analyze phase an obvious solution is discovered. Should that solution be immediately implemented and the remaining steps of DMAIC abandoned? Discuss your answer.
What information would you have to collect in order to build a discrete-event simulation model of a retail branch-banking operation? Discuss how this model could be used to determine appropriate staffing levels for the bank.
Suppose that you manage an airline reservation system and want to improve service quality. What are the important CTQs for this process? What are the KPIVs and KPOVs? How do these relate to the customer CTQs that you have identified?
It has been estimated that safe aircraft carrier landings operate at about the 5s level. What level of ppm defective does this imply?
Discuss why, in general, determining what to measure and how to make measurements is more difficult in service processes and transactional businesses than in manufacturing.
Suppose that you want to improve the process of loading passengers onto an airplane. Would a discrete-event simulation model of this process be useful? What data would have to be collected to build this model?
What is a six-sigma process?
Compare and contrast Deming’s and Juran’s philosophies of quality.
What would motivate a company to compete for the MBNQA?
Reconsider the fast-food restaurant out considered in the chapter. a. What results do you obtain if the probability of good quality on each meal component was 0.999?b. What level of quality on each meal component would be required to produce an annual level of quality that was acceptable to you?
Showing 34200 - 34300
of 88243
First
336
337
338
339
340
341
342
343
344
345
346
347
348
349
350
Last
Step by Step Answers
.png)
.png)
.png)
.png)
-1.png)
-2.png)
.png)
.png)
.png)
.png)
.png)
.png)

.png)
-1.png)
-2.png)
.png)
.png)
.png)
.png)
.png)
.png)
.png)
-1.png)
-2.png)
-1.png)
-2.png)
.png)
.png)
.png)
.png)
.png)
.png)
.png)

