New Semester
Started
Get
50% OFF
Study Help!
--h --m --s
Claim Now
Question Answers
Textbooks
Find textbooks, questions and answers
Oops, something went wrong!
Change your search query and then try again
S
Books
FREE
Study Help
Expert Questions
Accounting
General Management
Mathematics
Finance
Organizational Behaviour
Law
Physics
Operating System
Management Leadership
Sociology
Programming
Marketing
Database
Computer Network
Economics
Textbooks Solutions
Accounting
Managerial Accounting
Management Leadership
Cost Accounting
Statistics
Business Law
Corporate Finance
Finance
Economics
Auditing
Tutors
Online Tutors
Find a Tutor
Hire a Tutor
Become a Tutor
AI Tutor
AI Study Planner
NEW
Sell Books
Search
Search
Sign In
Register
study help
business
business statistics communicating
Statistics For Business And Economics 10th Edition David R. Anderson, Dennis J. Sweeney, Thomas A. Williams - Solutions
23. LO.6, 8 In no more than three PowerPoint slides, list at least four of the Code’s penalties that could be assessed against paid preparers of tax returns. Name the violation that triggers the penalty, and explain how the dollar amount of the penalty is determined.
22. LO.8 Indicate whether each of the following parties could be subject to the tax preparer penalties.a. Tom prepared Sally’s return for $250.b. Theresa prepared her grandmother’s return for no charge.c. Georgia prepared her church’s return for $500 (she would have charged an unrelated party
21. LO.8 Give the Circular 230 position concerning each of the following situations sometimes encountered in the tax profession.a. Taking an aggressive pro-taxpayer position on a tax return.b. Not having a quality review process for a return completed by a partner of the tax firm.c. Purposely
20. LO.8 In no more than five PowerPoint slides, prepare a presentation to your school’s Accounting Alumni Club titled “How the IRS Keeps Track of Tax Preparers.” Include the application of the PTIN and of Circular 230 in your remarks.
19. LO.7 Why should the taxpayer be “let off the hook” and no longer be subject to audit exposure once the applicable statute of limitations has expired? Do statutes of limitations protect the government? Other taxpayers?
18. LO.6 While working on the Federal income tax return for your client Best Wishes LLC, you discover that the payroll office was lax in its procedures. You found that the office allowed some employees to reduce their withholding taxes by overstating the number of exemptions to which they were
17. LO.4, 6 In each of the following cases, distinguish between the terms.a. Offer in compromise and closing agreement.b. Failure to file and failure to pay.c. 90-day letter and 30-day letter.d. Negligence and fraud.e. Criminal and civil tax fraud.
16. LO.4, 5, 7 Indicate whether each of the following statements is true or false.a. The government never pays a taxpayer interest on an overpayment of tax.b. The IRS can compromise on the amount of tax liability if there is doubt as to the taxpayer’s ability to pay.c. The statute of limitations
15. LO.6 On October 30, Cameron determines that his tax for the year will total $10,000.If his employer is scheduled to withhold only $6,500 in Federal income taxes, what can Cameron do to avoid any underpayment penalty?
14. LO.6 Yonkers Corporation recomputes its research credit for the prior tax year and, as a result, claims a $100,000 refund. The IRS reviews the claim and allows only $20,000 of the requested refund. If Yonkers does not appeal, is this matter finished? Is Yonkers certain to receive the full
13. LO.6 The IRS assesses special penalties when a taxpayer misreports the value of property that was the subject of a deduction or that was subject to a gift/estate tax. How are these penalties computed? Hint: Include the term gross misstatement in your answer.
12. LO.6 Which of the valuation penalties is likely to arise when an aggressive taxpayer reports:a. A charitable contribution?b. A business deduction?c. A decedent’s taxable estate?
11. LO.5 For about 15 months, Ian has been negotiating a settlement with the IRS concerning a disputed tax deduction. The IRS and Ian have agreed to the amount of prioryear taxes he must pay. Ian asks you whether he also is liable now for interest charges on his underpayment and, if so, how that
10. LO.4 Describe the conditions under which your client Lee Anne might approach the IRS with an offer in compromise.
9. LO.3 Describe the three broad types of IRS audits. Give an example of an issue that each type of audit might address, and indicate how frequently such audits are conducted by the IRS.
8. LO.3, 4 Lori wants to establish that her niece Suzette actually qualifies for a dependency exemption. After the issue is raised by the IRS on audit, Lori could argue the matter with the agent, an IRS Appeals officer, or the Tax Court. Give Lori advice about how to handle her tax dispute.
7. LO.3 When can an individual taxpayer feel certain that his or her tax return will not be audited by the IRS? One year after it is filed? Two years? Five years? Explain.
6. LO.3 Gloria and Maria work together in an insurance office. Gloria’s Form 1040 seems to be audited two out of every three years, while Maria never has been audited. How does the IRS select tax returns for audit? List some of the factors that might result in the different treatment of
5. LO.2 Describe the process the IRS uses to collect the tax that is found to be due after an audit is completed. Assume that the IRS findings are not appealed but that the taxpayer does not pay the amount due as determined by the audit. Illustrate the process with no more than four PowerPoint
4. LO.2 Your client is litigating in the Tax Court concerning a tax credit that she claimed and the IRS has denied. Who bears the burden of proof regarding the litigation?
3. LO.2 Your tax research has located a Tax Court case that supports the claiming of a deduction by a client, while an IRS letter ruling holds to the contrary. The pertinent facts of both the case and the ruling match those of the client. Which holding should be followed in preparing the client’s
2. LO.1 Recently, a politician was interviewed about fiscal policy, and she mentioned reducing the “tax gap.” Explain what this term means. What are some of the pertinent political and economic issues relative to the tax gap?
1. LO.1 An article in USA Today refers to the “audit lottery” and how one’s chances of being audited are higher under the current IRS leadership. What is the audit lottery?How should a tax professional view the statistics about a taxpayer’s audit likelihood?
3. For your analysis, choose 10 countries, one of which is the United States. Create a table showing whether each country applies a worldwide or territorial approach to international income taxation. Then list the country’s top income tax rate on business profits. Send a copy of your table to
2. Polly Ling is a successful professional golfer. She is a resident of a country that does not have a tax treaty with the United States. Ling plays matches around the world, about one-half of which are in the United States. Ling’s reputation is without blemish;in fact, she is known as being
1. Jerry Jeff Keen, the CFO of Boots Unlimited, a Texas corporation, has come to you regarding a potential restructuring of business operations. Boots has long manufactured its western boots in plants in Texas and Oklahoma. Recently, Boots has explored the possibility of setting up a manufacturing
56. LO.6 John McPherson is single, an attorney, and a U.S. citizen. He recently attended a seminar where he learned he could give up his U.S. citizenship, move to Bermuda (where he would pay no income tax), and operate his law practice long distance via the Internet with no U.S. tax consequences.
55. LO.6 Continue with the facts of Problem 54. What are the Federal income tax withholding requirements with respect to Martinho’s sale? Who pays the withheld amount to the U.S. Treasury?
54. LO.6 Martinho is a citizen of Brazil and lives there year-round. He has invested in a plot of Illinois farmland with a tax basis to him of $1 million. Martinho has no other business or investment activities in the United States. He is not subject to the alternative minimum tax. Upon sale of the
53. LO.6 Trace, Ltd., a foreign corporation, operates a trade or business in the United States. Trace’s U.S.-source income effectively connected with this trade or business is$800,000 for the current year. Trace’s current-year E & P is $600,000. Trace’s net U.S. equity was $8.2 million at the
52. LO.6 Clario, S.A., a Peruvian corporation, manufactures furniture in Peru. It sells the furniture to independent distributors in the United States. Because title to the furniture passes to the purchasers in the United States, Clario reports $1 million in U.S.-source income. Clario has no
51. LO.2, 6 IrishCo, a manufacturing corporation resident in Ireland, distributes products through a U.S. office. Current-year taxable income from such sales in the United States is $12 million. IrishCo’s U.S. office deposits working capital funds in short-term certificates of deposit with U.S.
50. LO.5 Money, Inc., a U.S. corporation, has $500,000 to invest overseas. For U.S. tax purposes, any additional gross income earned by Money will be taxed at 34%. Two possibilities for investment are:a. Invest the $500,000 in common stock of Exco (a foreign corporation). Exco common stock pays a
49. LO.5 Collins, Inc., a domestic corporation, operates a manufacturing branch in Singapore.During the current year, the manufacturing branch produces a loss of $300,000. Collins also earns interest income from investments in Europe, where it earns $800,000 in passive income. Collins paid no
48. LO.4, 5 Partin, Inc., a foreign subsidiary of Jones, Inc., a U.S. corporation, has pretax income of 200,000 euros for 2012. Partin accrues 60,000 euros in foreign taxes on this income. The average exchange rate for the tax year to which the taxes relate is 1.35€:$1.None of the income is
47. LO.5 Night, Inc., a domestic corporation, earned $300,000 from foreign manufacturing activities on which it paid $90,000 of foreign income taxes. Night’s foreign sales income is taxed at a 50% foreign tax rate. What amount of foreign sales income can Night earn without generating any excess
46. LO.5 For which of the following foreign income inclusions is a U.S. corporation potentially allowed an indirect FTC under § 902?a. Interest income from a 5% owned foreign corporation.b. Interest income from a 60% owned foreign corporation.c. Dividend income from a 5% owned foreign
45. LO.5 Canteen, Inc., a U.S. corporation, owns 100% of NewGrass, Ltd., a foreign corporation.NewGrass earns only general limitation income. During the current year, New-Grass paid Canteen a $10,000 dividend. The deemed-paid foreign tax credit associated with this dividend is $3,000. The foreign
44. LO.5 Elmwood, Inc., a domestic corporation, owns 15% of Correy, Ltd., a Hong Kong corporation. The remaining 85% of Correy is owned by Fortune Enterprises, a Canadian corporation. At the end of the current year, Correy has $400,000 in undistributed E & P and $200,000 in foreign taxes related to
43. LO.5 Mary, a U.S. citizen, is the sole shareholder of CanCo, a Canadian corporation.During its first year of operations, CanCo earns $14 million of foreign-source taxable income, pays $6 million of Canadian income taxes, and distributes a $2 million dividend to Mary. Can Mary claim a
42. LO.5 ABC, Inc., a domestic corporation, has $50 million of taxable income, including$15 million of general limitation foreign-source taxable income, on which ABC paid $5 million in foreign income taxes. The U.S. tax rate is 35%. What is ABC’s foreign tax credit?
41. LO.5 Dunne, Inc., a U.S. corporation, earned $400,000 in total taxable income, including$50,000 in foreign-source taxable income from its branch manufacturing operations in Brazil and $20,000 in foreign-source income from interest earned on bonds issued by Dutch corporations. Dunne paid $25,000
40. LO.5 Blunt, Inc., a U.S. corporation, earned $600,000 in total taxable income, including$80,000 in foreign-source taxable income from its German branch’s manufacturing operations and $30,000 in foreign-source taxable income from its Swiss branch’s engineering services operations. Blunt paid
39. LO.5 Weather, Inc., a domestic corporation, operates in both Fredonia and the United States. This year, the business generated taxable income of $600,000 from foreign sources and $900,000 from U.S. sources. All of Weather’s foreign-source income is in the general limitation basket.
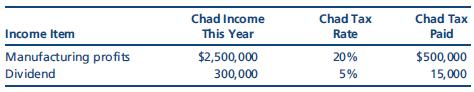
38. LO.5 Brandy, a U.S. corporation, operates a manufacturing branch in Chad, which does not have an income tax treaty with the United States. Brandy’s worldwide Federal taxable income is $30 million, so it is subject to a 35% marginal tax rate. Profits and taxes in Chad for the current year are
37. LO.5 Round, Inc., a U.S. corporation, owns 80% of the only class of stock of Square, Inc., a CFC. Square is a CFC until May 1 of the current tax year (not a leap year). Round has held the stock since Square was organized and continues to hold it for the entire year.Round and Square are both
36. LO.5 Hart Enterprises, a U.S. corporation, owns 100% of OK, Ltd., an Irish corporation.OK’s gross income for the year is $10 million. Determine OK’s Subpart F income(before any expenses) from the transactions that it reported this year.a. OK received $600,000 from sales of products
35. LO.5 USCo owns 65% of the voting stock of LandCo, a Country X corporation. Terra, an unrelated Country Y corporation, owns the other 35% of LandCo. LandCo owns 100% of the voting stock of OceanCo, a Country Z corporation. Assuming that USCo is a U.S. shareholder, do LandCo and OceanCo meet the
34. LO.5 Beach, Inc., a domestic corporation, operates a branch in Mexico. Over the last 10 years, this branch has generated $50 million in losses. For the last 3 years, however, the branch has been profitable and has earned enough income to entirely offset the prior losses. Most of the assets are
33. LO.4, 5 Teal, Inc., a foreign corporation, pays a dividend to its shareholders on November 30. Red, Inc., a U.S. corporation and 7% shareholder in Teal, receives a dividend of 10,000K (a foreign currency). Pertinent exchange rates are as follows:November 30 .9K:$1 Average for year .7K:$1
32. LO.4 Juarez is a citizen and resident of the United States. He pays all of his living expenses in U.S. dollars. He operates an unincorporated trade or business buying and selling rare books over the Internet to customers in Mexico. All income and expenses of the rare book business are in pesos.
31. LO.4 Table, Inc., a U.S. corporation, operates a manufacturing branch in Mexico and a sales branch in Canada. The Mexican branch uses the peso for all of its activities, and the Canadian branch uses the Canadian dollar for all of its activities. Write a letter to Karen Burns, Table’s tax
30. LO.4 Peck, Inc., a U.S. corporation, purchases weight-lifting equipment for resale from HiDisu, a Japanese corporation, for 75 million yen. On the date of purchase, 75 yen is equal to $1 U.S. (¥75:$1). The purchase is made on December 15, 2012, with payment due in 90 days. Peck is a calendar
29. LO.3 Create, Inc., produces inventory in its foreign manufacturing plants for sale in the United States. Its foreign manufacturing assets have a tax book value of $5 million and a fair market value of $15 million. Its assets related to the sales activity have a tax book value of $2 million and
28. LO.3 USCo incurred $100,000 in interest expense for the current year. The tax book value of USCo’s assets generating foreign-source income is $5 million. The tax book value of USCo’s assets generating U.S.-source income is $45 million. How much of the interest expense is allocated and
27. LO.3 Willa, a U.S. corporation, owns the rights to a patent related to a medical device.Willa licenses the rights to use the patent to IrishCo, which uses the patent in its manufacturing facility located in Ireland. What is the sourcing of the $1 million of royalty income received by Willa from
26. LO.3 Chock, a U.S. corporation, purchases inventory for resale from distributors within the United States and resells this inventory at a $1 million profit to customers outside the United States. Title to the goods passes outside the United States. What is the sourcing of Chock’s inventory
25. LO.3 Determine whether the source of income for the following sales is U.S. or foreign.a. Suarez, an NRA, sells stock in Home Depot, a U.S. corporation, through a broker in San Antonio.b. Chris sells stock in IBM, a U.S. corporation, to her brother, Rich. Both Chris and Rich are NRAs, and the
24. LO.3 Gloria Wang, an NRA, is a professional golfer. She played in seven tournaments in the United States in the current year and earned $200,000 in prizes from these tournaments.She deposited the winnings in a bank account she opened in Mexico City after her first tournament win.Gloria played a
23. LO.3 Madison, a U.S. resident, received the following income items for the current tax year. Identify the source of each income item as either U.S. or foreign.a. $3,000 dividend from U.S. Flower Company, a U.S. corporation, that operates solely in the eastern United States.b. $6,000 dividend
22. LO.4, 5 RedCo, a domestic corporation, incorporates GreenCo, a new wholly owned entity in Germany. Under both German and U.S. legal principles, this entity is a corporation.RedCo faces a 35% U.S. tax rate.GreenCo earns $800,000 in net profits from its German activities and makes no dividend
21. LO.1, 3, 5 If a U.S. taxpayer is subject to U.S. income tax on profits earned outside the United States and such profits are also subject to income tax in the foreign jurisdiction, how does the U.S. taxpayer escape double taxation? Draft a short speech that you will give to your university’s
20. LO.6 Write a memo on the difference between “inbound” and “outbound” activities in the context of U.S. taxation of international income.
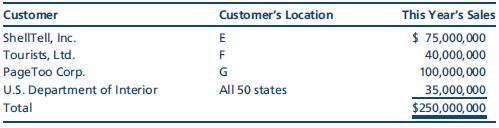
19. LO.3, 6 Sloop, Inc., a foreign corporation, sells wireless devices in several countries, including the United States. In fact, currently 25% of Sloop’s sales income is sourced in the United States (through branches in New York and Chicago). Sloop is considering opening additional branches in
18. LO.6 In general terms, how is a non-U.S. person taxed on his or her U.S. business income? Investment income? Ignore the effects of tax treaties in your answer.
17. LO.5 Working with the FTC may involve “baskets” of foreign-source income and deductions. Explain this term.
16. LO.5 Molly, Inc., a domestic corporation, owns 15% of PJ, Inc., and 12% of Emma, Inc., both foreign corporations. Molly is paid gross dividends of $35,000 and $18,000 from PJ and Emma, respectively. PJ withheld and paid more than $10,500 in foreign taxes on the $35,000 dividend.PJ’s country
15. LO.5 Klein, a domestic corporation, receives a $10,000 dividend from ForCo, a wholly owned foreign corporation. The deemed-paid FTC associated with this dividend is $3,000.What is the total gross income included in Klein’s tax return as a result of this dividend?
14. LO.5 QuinnCo could not claim all of the income taxes it paid to Japan as a foreign tax credit (FTC) this year. What computational limit probably kept QuinnCo from taking its full FTC?
13. LO.5 Linker is a corporate entity organized in France. It is owned equally by 100 U.S.shareholders. The shareholders are not related to each other; they purchased the shares from a broker. Is Linker a CFC? Explain.
12. LO.5 Joanna owns 5% of Axel, a foreign corporation. Joanna’s son, Fred, is considering acquiring 15% of Axel from an NRA. The remainder of Axel is owned 27% by unrelated U.S. persons and 53% by unrelated NRAs. Currently, Fred operates (as a sole proprietorship)a manufacturing business that
11. LO.5 Summarize the ownership rules that apply in determining whether a non-U.S. entity is a controlled foreign corporation (CFC) under the U.S. Federal income tax rules.
10. LO.5 Write a memo to a U.S. client explaining why some of the profit it generated from a non-U.S. subsidiary still is included in its U.S. taxable income.
9. LO.5 What are the important concepts to be considered when U.S. assets are transferred outside the country to be used in starting a new business?
8. LO.4 When dealing with the rules concerning gain and loss from foreign currency transactions, the taxpayer must identify its qualified business units (QBUs). What is a QBU? How many QBUs can a business operate?
7. LO.4 Weinke is a business organized in Austria, where the local currency is the euro.Nevertheless, Weinke’s U.S. branch uses the U.S. dollar as its functional currency. How can this be?
6. LO.3 “The IRS can use § 482 to overturn all of the international tax planning that our company is doing.” Explain.
5. LO.3 Write a memo outlining the issues that arise when attempting to source income that is earned from Internet-based activities.
4. LO.3 When is dividend income paid by a non-U.S. entity to a U.S. investor not foreignsource income? Be specific.
3. LO.2 Kelly, a U.S. citizen, earns interest income that is sourced in Germany. How could a U.S. tax treaty with Germany reduce Kelly’s taxes on the interest?
2. LO.1, 5 Liang, a U.S. citizen, owns 100% of ForCo, a foreign corporation not engaged in a U.S. trade or business. Is Liang subject to any U.S. income tax on her dealings with ForCo? Explain.
1. LO.1 “U.S. persons are taxed on their worldwide income.” Explain.
3. Find a state/local tax policy organization (e.g., the Committee on State Taxation). Read its current newsletter. In an e-mail to your instructor, summarize a major article in the newsletter. Look especially for articles on one of these topics:• Judicial and legislative developments concerning
2. Many states offer a tax credit for expenditures made in state for new computing and energy-saving equipment. For your state and one of its neighbors, summarize in a table three of the tax incentives offered through the income, sales, or property tax structure. In your table, list at least the
1. Send an e-mail to the secretary of revenue for your home state proposing adoption of at least two of the following provisions that do not currently exist in your state.a. Increase the apportionment weight for the sales factor.b. Exempt computer and communications technology from the
46. LO.9 Prepare a PowerPoint presentation (maximum of six slides) entitled “Planning Principles for Our Multistate Clients.” The slides will be used to lead a 20-minute discussion with colleagues in the corporate tax department. Keep the outline general, but assume that your colleagues have
45. LO.5, 9 Dread Corporation operates in a high-tax state. The firm asks you for advice on a plan to outsource administrative work done in its home state to independent contractors.This work now costs the company $750,000 in wages and benefits. Dread’s total payroll for the year is $8 million,
44. LO.8 Indicate for each transaction whether a sales (S ) or use (U ) tax applies or whether the transaction is nontaxable (N ). Where the laws vary among states, assume that the most common rules apply. All taxpayers are individuals.a. A resident of State A purchases an automobile in A.b. A
43. LO.8 Using the following information from the books and records of Grande Corporation, determine Grande’s total sales that are subject to State C’s sales tax. Grande operates a retail hardware store.Sales to C consumers, general merchandise $1,100,000 Sales to C consumers, crutches and
42. LO.7 Hernandez, which has been an S corporation since inception, is subject to tax in States Y and Z. On Schedule K of its Federal Form 1120S, Hernandez reported ordinary income of $500,000 from its business, taxable interest income of $10,000, capital loss of $30,000, and $40,000 of dividend
41. LO.6 Chang Corporation is part of a three-corporation unitary business. The group has a water’s edge election in effect with respect to unitary State Q. State B does not apply the unitary concept with respect to its corporate income tax laws. Nor does Despina, a European country to which
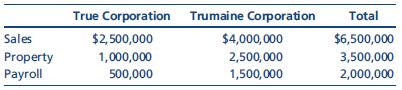
40. LO.6, 9 True Corporation, a wholly owned subsidiary of Trumaine Corporation, generated a $400,000 taxable loss in its first year of operations. True’s activities and sales are restricted to State A, which imposes an 8% income tax. In the same year, Trumaine’s taxable income is $1 million.
39. LO.5, 9 Crate Corporation, a calendar year taxpayer, has established nexus with numerous states. On December 3, Crate sold one of its two facilities in State X. The cost of this facility was $800,000.On January 1, Crate owned property with a cost of $3 million, $1.5 million of which was located
38. LO.5 Assume the same facts as in Problem 37, except that nonbusiness income is apportionable in B.
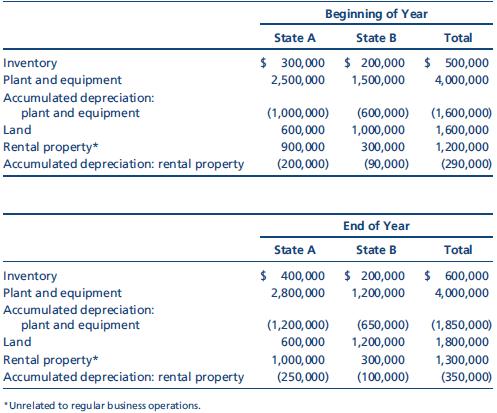
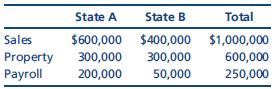
37. LO.5 Kim Corporation, a calendar year taxpayer, has manufacturing facilities in States A and B. A summary of Kim’s property holdings follows.Determine Kim’s property factors for the two states assuming that the statutes of both A and B provide that average historical cost of business
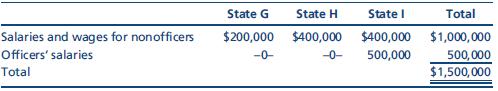
36. LO.5, 9 Quinn Corporation is subject to tax in States G, H, and I. Quinn’s compensation expense includes the following:Officers’ salaries are included in the payroll factor for G and I, but not for H. Compute Quinn’s payroll factors for G, H, and I. Comment on your results. State G State
35. LO.5, 9 State E applies a throwback rule to sales, while State F does not. State G has not adopted an income tax to date. Orange Corporation, headquartered in E, reported the following sales for the year. All of the goods were shipped from Orange’s E manufacturing facilities. Determine its
34. LO.5 McKay Corporation operates in two states, as indicated below. This year’s operations generated $300,000 of apportionable income.Compute McKay’s State A taxable income assuming that State A apportions income based on a:a. Three-factor formula, equally weighted.b. Double-weighted sales
33. LO.5 Assume the same facts as in Problem 31, except that both states employ a threefactor formula, under which sales are double-weighted. The basis of the property factor in A is historical cost, while the basis of this factor in B is the net depreciated basis. Neither A nor B includes rent
32. LO.5 Assume the same facts as in Problem 31, except that A uses a single-factor apportionment formula that consists solely of sales and B uses a three-factor apportionment formula that equally weights sales, property (at historical cost), and payroll. State B does not include rent payments in
Showing 200 - 300
of 7675
1
2
3
4
5
6
7
8
9
10
11
12
13
14
15
Last
Step by Step Answers