New Semester
Started
Get
50% OFF
Study Help!
--h --m --s
Claim Now
Question Answers
Textbooks
Find textbooks, questions and answers
Oops, something went wrong!
Change your search query and then try again
S
Books
FREE
Study Help
Expert Questions
Accounting
General Management
Mathematics
Finance
Organizational Behaviour
Law
Physics
Operating System
Management Leadership
Sociology
Programming
Marketing
Database
Computer Network
Economics
Textbooks Solutions
Accounting
Managerial Accounting
Management Leadership
Cost Accounting
Statistics
Business Law
Corporate Finance
Finance
Economics
Auditing
Tutors
Online Tutors
Find a Tutor
Hire a Tutor
Become a Tutor
AI Tutor
AI Study Planner
NEW
Sell Books
Search
Search
Sign In
Register
study help
business
business statistics
Introductory Business Statistics 1st Edition Alexander Holmes , Barbara Illowsky , Susan Dean - Solutions
If the area to the left of x in a normal distribution is 0.123, what is the area to the right of x?
If the area to the right of x in a normal distribution is 0.543, what is the area to the left of x?Use the following information to answer the next four exercises:X ~ N(54, 8)
Find the probability that x > 56.
Find the probability that x < 30.
X ~ N(6, 2)Find the probability that x is between three and nine.
X ~ N(–3, 4)Find the probability that x is between one and four.
X ~ N(4, 5)Find the maximum of x in the bottom quartile.
Find the probability that a CD player will break down during the guarantee period.a. Sketch the situation. Label and scale the axes. Shade the region corresponding to the probability.b. P(0 The life of Sunshine CD players is normally distributed with a mean of 4.1 years and a standard deviation of
Find the probability that a CD player will last between 2.8 and six years.a. Sketch the situation. Label and scale the axes. Shade the region corresponding to the probability.b. P(__________ The life of Sunshine CD players is normally distributed with a mean of 4.1 years and a standard deviation of
What is the median recovery time?a. 2.7b. 5.3c. 7.4d. 2.1 The patient recovery time from a particular surgical procedure is normally distributed with a mean of 5.3 days and a standard deviation of 2.1 days.
What is the z-score for a patient who takes ten days to recover?a. 1.5b. 0.2c. 2.2d. 7.3 The patient recovery time from a particular surgical procedure is normally distributed with a mean of 5.3 days and a standard deviation of 2.1 days.
The length of time to find it takes to find a parking space at 9 A.M. follows a normal distribution with a mean of five minutes and a standard deviation of two minutes. If the mean is significantly greater than the standard deviation, which of the following statements is true?I. The data cannot
The heights of the 430 National Basketball Association players were listed on team rosters at the start of the 2005–2006 season. The heights of basketball players have an approximate normal distribution with mean, μ = 79 inches and a standard deviation, σ = 3.89 inches. For each of the
The systolic blood pressure (given in millimeters) of males has an approximately normal distribution with mean μ =125 and standard deviation σ = 14. Systolic blood pressure for males follows a normal distribution.a. Calculate the z-scores for the male systolic blood pressures 100 and 150
Kyle’s doctor told him that the z-score for his systolic blood pressure is 1.75. Which of the following is the best interpretation of this standardized score? The systolic blood pressure (given in millimeters) of males has an approximately normal distribution with mean μ = 125 and standard
Height and weight are two measurements used to track a child’s development. TheWorld Health Organization measures child development by comparing the weights of children who are the same height and the same gender. In 2009, weights for all 80 cm girls in the reference population had a mean μ =
In 2005, 1,475,623 students heading to college took the SAT. The distribution of scores in the math section of the SAT follows a normal distribution with mean μ = 520 and standard deviation σ = 115.a. Calculate the z-score for an SAT score of 720. Interpret it using a complete sentence.b. What
What is the probability of spending more than two days in recovery?a. 0.0580b. 0.8447c. 0.0553d. 0.9420 The patient recovery time from a particular surgical procedure is normally distributed with a mean of 5.3 days and a standard deviation of 2.1 days.
Based upon the given information and numerically justified, would you be surprised if it took less than one minute to find a parking space?a. Yesb. Noc. Unable to determine The patient recovery time from a particular surgical procedure is normally distributed with a mean of 5.3 days and a standard
Find the probability that it takes at least eight minutes to find a parking space.a. 0.0001b. 0.9270c. 0.1862d. 0.0668 The length of time it takes to find a parking space at 9 A.M. follows a normal distribution with a mean of five minutes and a standard deviation of two minutes.
Seventy percent of the time, it takes more than how many minutes to find a parking space?a. 1.24b. 2.41c. 3.95d. 6.05 The length of time it takes to find a parking space at 9 A.M. follows a normal distribution with a mean of five minutes and a standard deviation of two minutes.
IQ is normally distributed with a mean of 100 and a standard deviation of 15. Suppose one individual is randomly chosen. Let X = IQ of an individual.a. X ~ _____(_____,_____)b. Find the probability that the person has an IQ greater than 120. Include a sketch of the graph, and write a probability
The percent of fat calories that a person in America consumes each day is normally distributed with a mean of about 36 and a standard deviation of 10. Suppose that one individual is randomly chosen. Let X = percent of fat calories.a. X ~ _____(_____,_____)b. Find the probability that the percent of
In China, four-year-olds average three hours a day unsupervised. Most of the unsupervised children live in rural areas, considered safe. Suppose that the standard deviation is 1.5 hours and the amount of time spent alone is normally distributed.We randomly select one Chinese four-year-old living in
In the 1992 presidential election, Alaska’s 40 election districts averaged 1,956.8 votes per district for President Clinton.The standard deviation was 572.3. (There are only 40 election districts in Alaska.) The distribution of the votes per district for President Clinton was bell-shaped. Let X =
Suppose that the duration of a particular type of criminal trial is known to be normally distributed with a mean of 21 days and a standard deviation of seven days.a. In words, define the random variable X.b. X ~ _____(_____,_____)c. If one of the trials is randomly chosen, find the probability that
Terri Vogel, an amateur motorcycle racer, averages 129.71 seconds per 2.5 mile lap (in a seven-lap race) with a standard deviation of 2.28 seconds. The distribution of her race times is normally distributed. We are interested in one of her randomly selected laps.a. In words, define the random
Suppose that Ricardo and Anita attend different colleges. Ricardo’s GPA is the same as the average GPA at his school.Anita’s GPA is 0.70 standard deviations above her school average. In complete sentences, explain why each of the following statements may be false.a. Ricardo’s actual GPA is
An expert witness for a paternity lawsuit testifies that the length of a pregnancy is normally distributed with a mean of 280 days and a standard deviation of 13 days. An alleged father was out of the country from 240 to 306 days before the birth of the child, so the pregnancy would have been less
A NUMMI assembly line, which has been operating since 1984, has built an average of 6,000 cars and trucks a week.Generally, 10% of the cars were defective coming off the assembly line. Suppose we draw a random sample of n = 100 cars.Let X represent the number of defective cars in the sample. What
We flip a coin 100 times (n = 100) and note that it only comes up heads 20% (p = 0.20) of the time. The mean and standard deviation for the number of times the coin lands on heads is μ = 20 and σ = 4 (verify the mean and standard deviation). Solve the following:a. There is about a 68% chance that
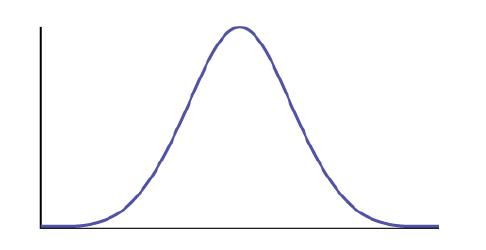
Which type of distribution does the graph illustrate? 0 1 2 3 4 5 6 789 10 X
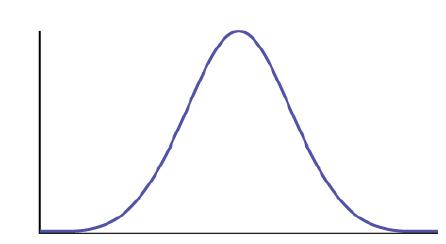
Which type of distribution does the graph illustrate? 0 1 2 3 T4 4 5 X 6 7 8 9 10
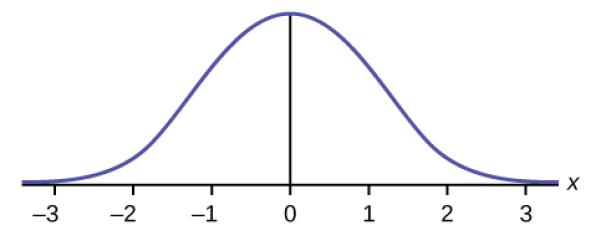
Which type of distribution does the graph illustrate? X -3 -2 -1 0 1 2 3
What does the shaded area represent? P(___ X 0 1 2 3 4 56 789 10
What does the shaded area represent? P(___ X 01 2 3 4 5 6 7 8 9 10
For a continuous probablity distribution, 0 ≤ x ≤ 15. What is P(x > 15)?
What is the area under f(x) if the function is a continuous probability density function?
For a continuous probability distribution, 0 ≤ x ≤ 10. What is P(x = 7)?
A continuous probability function is restricted to the portion between x = 0 and 7. What is P(x = 10)?
f(x) for a continuous probability function is 1/5, and the function is restricted to 0 ≤ x ≤ 5. What is P(x < 0)?
f(x), a continuous probability function, is equal to 1/12 , and the function is restricted to 0 ≤ x ≤
What is P (0 67 X 01 2 3 4 5 6 7 8 9 10
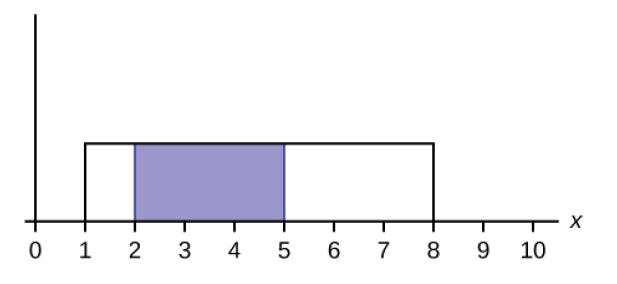
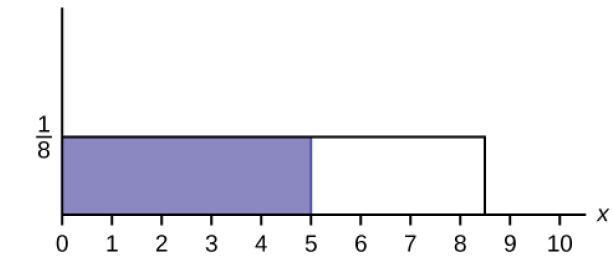
Find the probability that x falls in the shaded area. 110 0 1 2 2 13 X 4 5 6 7 8 9 10
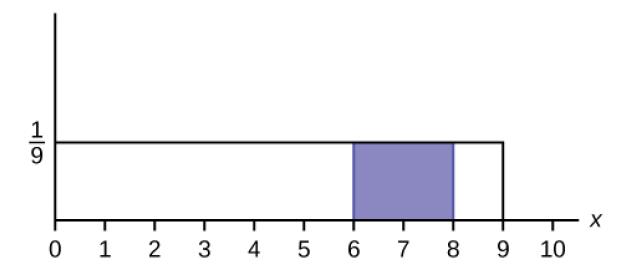
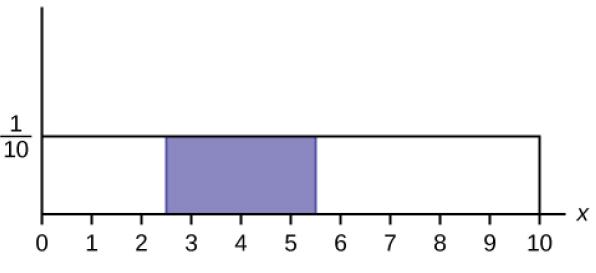
Find the probability that x falls in the shaded area. 1 10 0 1 2 3 4 5 6 7 8 9 10
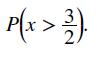
f(x), a continuous probability function, is equal to 1/3 and the function is restricted to 1 ≤ x ≤ 4. Describe P(x > 32).
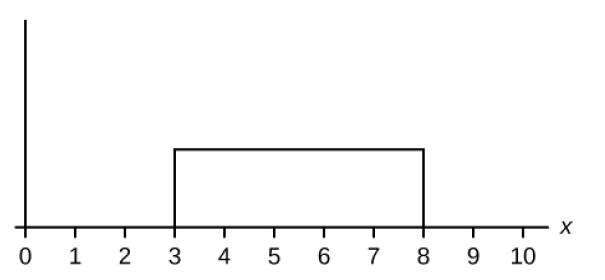
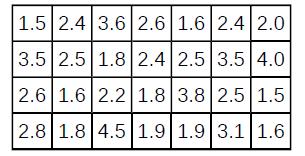
What type of distribution is this?The data that follow are the square footage (in 1,000 feet squared) of 28 homes.The sample mean = 2.50 and the sample standard deviation = 0.8302.The distribution can be written as X ~ U(1.5, 4.5). 1.5 2.4 3.6 2.6 1.6 2.4 2.0 3.5 2.5 1.8 2.4 2.5 3.5 4.0 2.6 1.6 2.2
In this distribution, outcomes are equally likely. What does this mean?The data that follow are the square footage (in 1,000 feet squared) of 28 homes.The sample mean = 2.50 and the sample standard deviation = 0.8302.The distribution can be written as X ~ U(1.5, 4.5). 1.5 2.4 3.6 2.6 1.6 2.4 2.0
What is the height of f(x) for the continuous probability distribution?The data that follow are the square footage (in 1,000 feet squared) of 28 homes.The sample mean = 2.50 and the sample standard deviation = 0.8302.The distribution can be written as X ~ U(1.5, 4.5). 1.5 2.4 3.6 2.6 1.6 2.4 2.0
What are the constraints for the values of x?The data that follow are the square footage (in 1,000 feet squared) of 28 homes.The sample mean = 2.50 and the sample standard deviation = 0.8302.The distribution can be written as X ~ U(1.5, 4.5). 1.5 2.4 3.6 2.6 1.6 2.4 2.0 3.5 2.5 1.8 2.4 2.5 3.5 4.0
Graph P(2 The data that follow are the square footage (in 1,000 feet squared) of 28 homes.The sample mean = 2.50 and the sample standard deviation = 0.8302.The distribution can be written as X ~ U(1.5, 4.5). 1.5 2.4 3.6 2.6 1.6 2.4 2.0 3.5 2.5 1.8 2.4 2.5 3.5 4.0 2.6 1.6 2.2 1.8 3.8 2.5 1.5 2.8 1.8
What is P(2 The data that follow are the square footage (in 1,000 feet squared) of 28 homes.The sample mean = 2.50 and the sample standard deviation = 0.8302.The distribution can be written as X ~ U(1.5, 4.5). 1.5 2.4 3.6 2.6 1.6 2.4 2.0 3.5 2.5 1.8 2.4 2.5 3.5 4.0 2.6 1.6 2.2 1.8 3.8 2.5 1.5 2.8
What is P(x The data that follow are the square footage (in 1,000 feet squared) of 28 homes.The sample mean = 2.50 and the sample standard deviation = 0.8302.The distribution can be written as X ~ U(1.5, 4.5). 1.5 2.4 3.6 2.6 1.6 2.4 2.0 3.5 2.5 1.8 2.4 2.5 3.5 4.0 2.6 1.6 2.2 1.8 3.8 2.5 1.5 2.8
What is P(x = 1.5)?The data that follow are the square footage (in 1,000 feet squared) of 28 homes.The sample mean = 2.50 and the sample standard deviation = 0.8302.The distribution can be written as X ~ U(1.5, 4.5). 1.5 2.4 3.6 2.6 1.6 2.4 2.0 3.5 2.5 1.8 2.4 2.5 3.5 4.0 2.6 1.6 2.2 1.8 3.8 2.5
Find the probability that a randomly selected home has more than 3,000 square feet given that you already know the house has more than 2,000 square feet.The data that follow are the square footage (in 1,000 feet squared) of 28 homes.The sample mean = 2.50 and the sample standard deviation =
What is a? What does it represent?The data that follow are the square footage (in 1,000 feet squared) of 28 homes.The sample mean = 2.50 and the sample standard deviation = 0.8302.The distribution can be written as X ~ U(1.5, 4.5).A distribution is given as X ~ U(0, 12). 1.5 2.4 3.6 2.6 1.6 2.4 2.0
What is b? What does it represent?A distribution is given as X ~ U(0, 12).
What is the probability density function?A distribution is given as X ~ U(0, 12).
What is the theoretical mean?A distribution is given as X ~ U(0, 12).
What is the theoretical standard deviation?A distribution is given as X ~ U(0, 12).
Draw the graph of the distribution for P(x > 9).A distribution is given as X ~ U(0, 12).
Find P(x > 9).A distribution is given as X ~ U(0, 12).
What is being measured here?A distribution is given as X ~ U(0, 12).The age of cars in the staff parking lot of a suburban college is uniformly distributed from six months (0.5 years) to 9.5 years.
In words, define the random variable X.The age of cars in the staff parking lot of a suburban college is uniformly distributed from six months (0.5 years) to 9.5 years.
Are the data discrete or continuous?The age of cars in the staff parking lot of a suburban college is uniformly distributed from six months (0.5 years) to 9.5 years.
The interval of values for x is ______.The age of cars in the staff parking lot of a suburban college is uniformly distributed from six months (0.5 years) to 9.5 years.
The distribution for X is ______.The age of cars in the staff parking lot of a suburban college is uniformly distributed from six months (0.5 years) to 9.5 years.
Write the probability density function.The age of cars in the staff parking lot of a suburban college is uniformly distributed from six months (0.5 years) to 9.5 years.
Graph the probability distribution.a. Sketch the graph of the probability distribution.b. Identify the following values:i. Lowest value for x – : _______ ii. Highest value for x – : _______ iii. Height of the rectangle: _______ iv. Label for x-axis (words): _______ v. Label for y-axis (words):
Find the average age of the cars in the lot.
Find the probability that a randomly chosen car in the lot was less than four years old.a. Sketch the graph, and shade the area of interest.b. Find the probability. P(x
Considering only the cars less than 7.5 years old, find the probability that a randomly chosen car in the lot was less than four years old.a. Sketch the graph, shade the area of interest.b. Find the probability. P(x
What has changed in the previous two problems that made the solutions different?The age of cars in the staff parking lot of a suburban college is uniformly distributed from six months (0.5 years) to 9.5 years.
Find the third quartile of ages of cars in the lot. This means you will have to find the value such that 3/4, or 75%, of the cars are at most (less than or equal to) that age.a. Sketch the graph, and shade the area of interest.b. Find the value k such that P(x c. The third quartile is _______ The
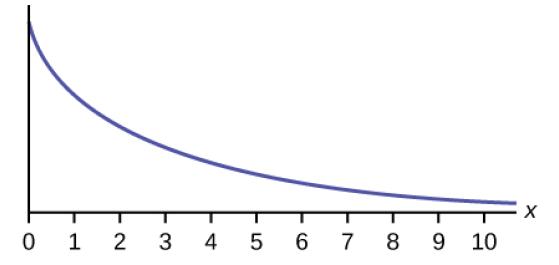
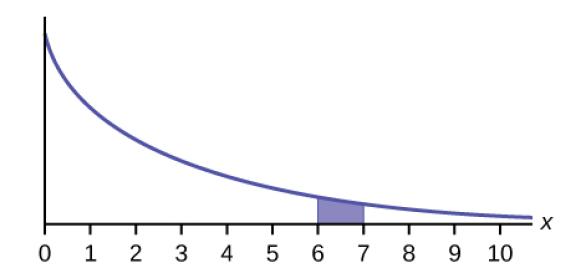
What type of distribution is this?A customer service representative must spend different amounts of time with each customer to resolve various concerns. The amount of time spent with each customer can be modeled by the following distribution: X ~ Exp(0.2)
Are outcomes equally likely in this distribution? Why or why not?A customer service representative must spend different amounts of time with each customer to resolve various concerns. The amount of time spent with each customer can be modeled by the following distribution: X ~ Exp(0.2)
What is m? What does it represent?A customer service representative must spend different amounts of time with each customer to resolve various concerns. The amount of time spent with each customer can be modeled by the following distribution: X ~ Exp(0.2)
What is the mean?A customer service representative must spend different amounts of time with each customer to resolve various concerns. The amount of time spent with each customer can be modeled by the following distribution: X ~ Exp(0.2)
What is the standard deviation?A customer service representative must spend different amounts of time with each customer to resolve various concerns. The amount of time spent with each customer can be modeled by the following distribution: X ~ Exp(0.2)
State the probability density function.A customer service representative must spend different amounts of time with each customer to resolve various concerns. The amount of time spent with each customer can be modeled by the following distribution: X ~ Exp(0.2)
Graph the distribution.A customer service representative must spend different amounts of time with each customer to resolve various concerns. The amount of time spent with each customer can be modeled by the following distribution: X ~ Exp(0.2)
Find P(2 < x < 10).A customer service representative must spend different amounts of time with each customer to resolve various concerns. The amount of time spent with each customer can be modeled by the following distribution: X ~ Exp(0.2)
Find P(x > 6).A customer service representative must spend different amounts of time with each customer to resolve various concerns. The amount of time spent with each customer can be modeled by the following distribution: X ~ Exp(0.2)
Find the 70th percentile.A customer service representative must spend different amounts of time with each customer to resolve various concerns. The amount of time spent with each customer can be modeled by the following distribution: X ~ Exp(0.2)
What is m?A distribution is given as X ~ Exp(0.75).
What is the probability density function?A distribution is given as X ~ Exp(0.75).
Draw the distribution.A distribution is given as X ~ Exp(0.75).
Find P(x < 4).A distribution is given as X ~ Exp(0.75).
Find the 30th percentile.A distribution is given as X ~ Exp(0.75).
Find the median.A distribution is given as X ~ Exp(0.75).
Which is larger, the mean or the median?
What is being measured here?Carbon-14 is a radioactive element with a half-life of about 5,730 years. Carbon-14 is said to decay exponentially. The decay rate is 0.000121. We start with one gram of carbon-14.We are interested in the time (years) it takes to decay carbon-14.
Are the data discrete or continuous?Carbon-14 is a radioactive element with a half-life of about 5,730 years. Carbon-14 is said to decay exponentially. The decay rate is 0.000121. We start with one gram of carbon-14.We are interested in the time (years) it takes to decay carbon-14.
In words, define the random variable X.Carbon-14 is a radioactive element with a half-life of about 5,730 years. Carbon-14 is said to decay exponentially. The decay rate is 0.000121. We start with one gram of carbon-14.We are interested in the time (years) it takes to decay carbon-14.
What is the decay rate (m)?Carbon-14 is a radioactive element with a half-life of about 5,730 years. Carbon-14 is said to decay exponentially. The decay rate is 0.000121. We start with one gram of carbon-14.We are interested in the time (years) it takes to decay carbon-14.
The distribution for X is ______.Carbon-14 is a radioactive element with a half-life of about 5,730 years. Carbon-14 is said to decay exponentially. The decay rate is 0.000121. We start with one gram of carbon-14.We are interested in the time (years) it takes to decay carbon-14.
Find the amount (percent of one gram) of carbon-14 lasting less than 5,730 years. This means, find P(x a. Sketch the graph, and shade the area of interest.b. Find the probability. P(x We are interested in the time (years) it takes to decay carbon-14.
Find the percentage of carbon-14 lasting longer than 10,000 years.a. Sketch the graph, and shade the area of interest.b. Find the probability. P(x > 10,000) = ________ Carbon-14 is a radioactive element with a half-life of about 5,730 years. Carbon-14 is said to decay exponentially. The decay
Thirty percent (30%) of carbon-14 will decay within how many years?a. Sketch the graph, and shade the area of interest.b. Find the value k such that P(x Carbon-14 is a radioactive element with a half-life of about 5,730 years. Carbon-14 is said to decay exponentially. The decay rate is 0.000121. We
Consider the following experiment. You are one of 100 people enlisted to take part in a study to determine the percent of nurses in America with an R.N. (registered nurse) degree. You ask nurses if they have an R.N. degree. The nurses answer “yes” or “no.” You then calculate the percentage
Showing 7000 - 7100
of 8575
First
64
65
66
67
68
69
70
71
72
73
74
75
76
77
78
Last
Step by Step Answers