New Semester
Started
Get
50% OFF
Study Help!
--h --m --s
Claim Now
Question Answers
Textbooks
Find textbooks, questions and answers
Oops, something went wrong!
Change your search query and then try again
S
Books
FREE
Study Help
Expert Questions
Accounting
General Management
Mathematics
Finance
Organizational Behaviour
Law
Physics
Operating System
Management Leadership
Sociology
Programming
Marketing
Database
Computer Network
Economics
Textbooks Solutions
Accounting
Managerial Accounting
Management Leadership
Cost Accounting
Statistics
Business Law
Corporate Finance
Finance
Economics
Auditing
Tutors
Online Tutors
Find a Tutor
Hire a Tutor
Become a Tutor
AI Tutor
AI Study Planner
NEW
Sell Books
Search
Search
Sign In
Register
study help
business
business statistics
Introductory Business Statistics 1st Edition Alexander Holmes , Barbara Illowsky , Susan Dean - Solutions
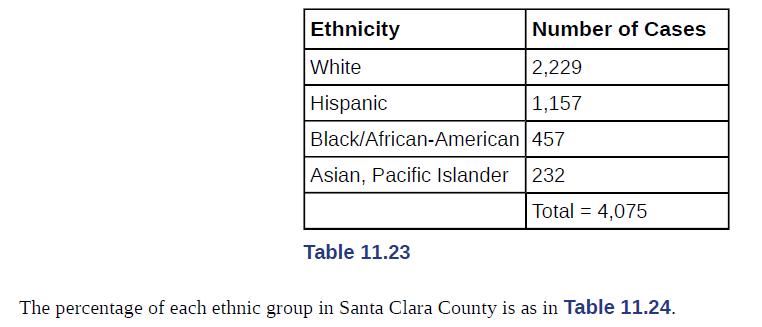
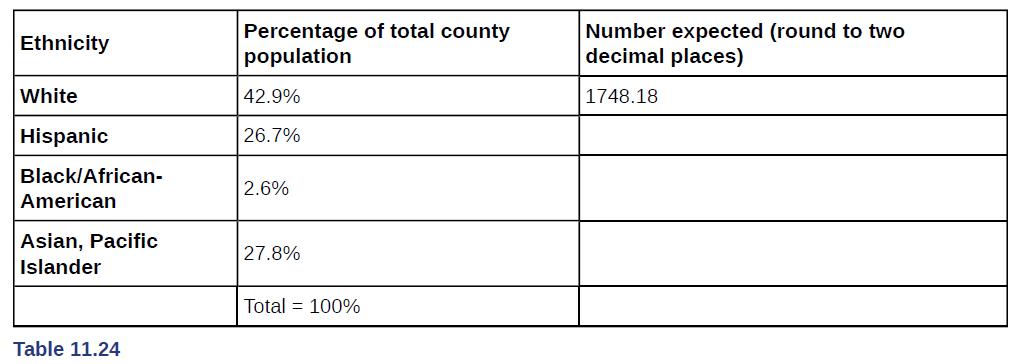
Does it appear that the pattern of AIDS cases in Santa Clara County corresponds to the distribution of ethnic groups in this county? Why or why not?The following data are real. The cumulative number of AIDS cases reported for Santa Clara County is broken down by ethnicity as in Table 11.23.
A pharmaceutical company is interested in the relationship between age and presentation of symptoms for a common viral infection. A random sample is taken of 500 people with the infection across different age groups.The following data are real. The cumulative number of AIDS cases reported for Santa
The owner of a baseball team is interested in the relationship between player salaries and team winning percentage. He takes a random sample of 100 players from different organizations.
A marathon runner is interested in the relationship between the brand of shoes runners wear and their run times. She takes a random sample of 50 runners and records their run times as well as the brand of shoes they were wearing.
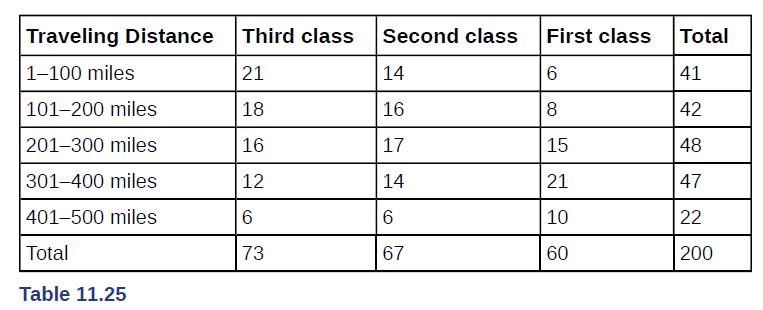
Transit Railroads is interested in the relationship between travel distance and the ticket class purchased. A random sample of 200 passengers is taken. Table 11.25 shows the results.The railroad wants to know if a passenger’s choice in ticket class is independent of the distance they must
Transit Railroads is interested in the relationship between travel distance and the ticket class purchased. A random sample of 200 passengers is taken. Table 11.25 shows the results.The railroad wants to know if a passenger’s choice in ticket class is independent of the distance they must
How many passengers are expected to travel between 201 and 300 miles and purchase second-class tickets?Transit Railroads is interested in the relationship between travel distance and the ticket class purchased. A random sample of 200 passengers is taken. Table 11.25 shows the results.The railroad
How many passengers are expected to travel between 401 and 500 miles and purchase first-class tickets?Transit Railroads is interested in the relationship between travel distance and the ticket class purchased. A random sample of 200 passengers is taken. Table 11.25 shows the results.The railroad
What is the test statistic?Transit Railroads is interested in the relationship between travel distance and the ticket class purchased. A random sample of 200 passengers is taken. Table 11.25 shows the results.The railroad wants to know if a passenger’s choice in ticket class is independent of the
What can you conclude at the 5% level of significance?Transit Railroads is interested in the relationship between travel distance and the ticket class purchased. A random sample of 200 passengers is taken. Table 11.25 shows the results.The railroad wants to know if a passenger’s choice in ticket
α = 0.01a. Decision: ___________________b. Reason for the decision: ___________________c. Conclusion (write out in a complete sentence): ___________________
A math teacher wants to see if two of her classes have the same distribution of test scores. What test should she use?
What are the null and alternative hypotheses for Exercise 11.48?Exercise 11.48A math teacher wants to see if two of her classes have the same distribution of test scores. What test should she use?
A market researcher wants to see if two different stores have the same distribution of sales throughout the year. What type of test should he use?
A meteorologist wants to know if East andWest Australia have the same distribution of storms. What type of test should she use?
What condition must be met to use the test for homogeneity?
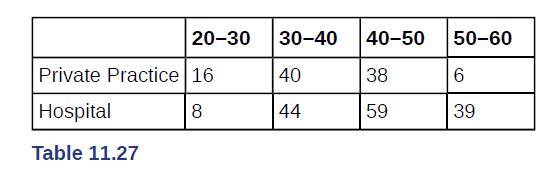
State the null and alternative hypotheses.Do private practice doctors and hospital doctors have the same distribution of working hours? Suppose that a sample of 100 private practice doctors and 150 hospital doctors are selected at random and asked about the number of hours a week they work. The
Do private practice doctors and hospital doctors have the same distribution of working hours? Suppose that a sample of 100 private practice doctors and 150 hospital doctors are selected at random and asked about the number of hours a week they work. The results are shown in Table 11.27.df = _______
What is the test statistic?Do private practice doctors and hospital doctors have the same distribution of working hours? Suppose that a sample of 100 private practice doctors and 150 hospital doctors are selected at random and asked about the number of hours a week they work. The results are shown
What can you conclude at the 5% significance level?Do private practice doctors and hospital doctors have the same distribution of working hours? Suppose that a sample of 100 private practice doctors and 150 hospital doctors are selected at random and asked about the number of hours a week they
Which test do you use to decide whether an observed distribution is the same as an expected distribution?Do private practice doctors and hospital doctors have the same distribution of working hours? Suppose that a sample of 100 private practice doctors and 150 hospital doctors are selected at
What is the null hypothesis for the type of test from Exercise 11.57?Exercise 11.57Which test do you use to decide whether an observed distribution is the same as an expected distribution?Do private practice doctors and hospital doctors have the same distribution of working hours? Suppose that a
Which test would you use to decide whether two factors have a relationship?
Which test would you use to decide if two populations have the same distribution?
How are tests of independence similar to tests for homogeneity?
How are tests of independence different from tests for homogeneity?
As the number of degrees of freedom increases, the graph of the chi-square distribution looks more and more symmetrical.
The standard deviation of the chi-square distribution is twice the mean.
The mean and the median of the chi-square distribution are the same if df = 24.
Is the traveler disputing the claim about the average or about the variance?Suppose an airline claims that its flights are consistently on time with an average delay of at most 15 minutes. It claims that the average delay is so consistent that the variance is no more than 150 minutes. Doubting the
A sample standard deviation of 15 minutes is the same as a sample variance of __________ minutes.Suppose an airline claims that its flights are consistently on time with an average delay of at most 15 minutes. It claims that the average delay is so consistent that the variance is no more than 150
Is this a right-tailed, left-tailed, or two-tailed test?Suppose an airline claims that its flights are consistently on time with an average delay of at most 15 minutes. It claims that the average delay is so consistent that the variance is no more than 150 minutes. Doubting the consistency part of
Suppose an airline claims that its flights are consistently on time with an average delay of at most 15 minutes. It claims that the average delay is so consistent that the variance is no more than 150 minutes. Doubting the consistency part of the claim, a disgruntled traveler calculates the delays
Suppose an airline claims that its flights are consistently on time with an average delay of at most 15 minutes. It claims that the average delay is so consistent that the variance is no more than 150 minutes. Doubting the consistency part of the claim, a disgruntled traveler calculates the delays
Suppose an airline claims that its flights are consistently on time with an average delay of at most 15 minutes. It claims that the average delay is so consistent that the variance is no more than 150 minutes. Doubting the consistency part of the claim, a disgruntled traveler calculates the delays
Graph the situation. Label and scale the horizontal axis. Mark the mean and test statistic. Shade the area associated with the level of confidence.Suppose an airline claims that its flights are consistently on time with an average delay of at most 15 minutes. It claims that the average delay is so
Suppose an airline claims that its flights are consistently on time with an average delay of at most 15 minutes. It claims that the average delay is so consistent that the variance is no more than 150 minutes. Doubting the consistency part of the claim, a disgruntled traveler calculates the delays
How did you know to test the variance instead of the mean?Suppose an airline claims that its flights are consistently on time with an average delay of at most 15 minutes. It claims that the average delay is so consistent that the variance is no more than 150 minutes. Doubting the consistency part
If an additional test were done on the claim of the average delay, which distribution would you use?Suppose an airline claims that its flights are consistently on time with an average delay of at most 15 minutes. It claims that the average delay is so consistent that the variance is no more than
If an additional test were done on the claim of the average delay, but 45 flights were surveyed, which distribution would you use?Suppose an airline claims that its flights are consistently on time with an average delay of at most 15 minutes. It claims that the average delay is so consistent that
A plant manager is concerned her equipment may need recalibrating. It seems that the actual weight of the 15 oz. cereal boxes it fills has been fluctuating. The standard deviation should be at most 0.5 oz. In order to determine if the machine needs to be recalibrated, 84 randomly selected boxes of
Consumers may be interested in whether the cost of a particular calculator varies from store to store. Based on surveying 43 stores, which yielded a sample mean of $84 and a sample standard deviation of $12, test the claim that the standard deviation is greater than $15.
Isabella, an accomplished Bay to Breakers runner, claims that the standard deviation for her time to run the 7.5 mile race is at most three minutes. To test her claim, Rupinder looks up five of her race times. They are 55 minutes, 61 minutes, 58 minutes, 63 minutes, and 57 minutes.
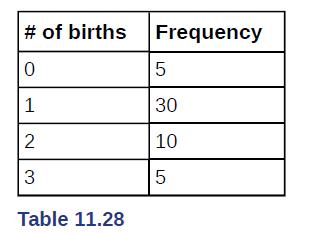
Airline companies are interested in the consistency of the number of babies on each flight, so that they have adequate safety equipment. They are also interested in the variation of the number of babies. Suppose that an airline executive believes the average number of babies on flights is six with
The number of births per woman in China is 1.6 down from 5.91 in 1966. This fertility rate has been attributed to the law passed in 1979 restricting births to one per woman. Suppose that a group of students studied whether or not the standard deviation of births per woman was greater than 0.75.
According to an avid aquarist, the average number of fish in a 20-gallon tank is 10, with a standard deviation of two.His friend, also an aquarist, does not believe that the standard deviation is two. She counts the number of fish in 15 other 20-gallon tanks. Based on the results that follow, do
The manager of "Frenchies" is concerned that patrons are not consistently receiving the same amount of French fries with each order. The chef claims that the standard deviation for a ten-ounce order of fries is at most 1.5 oz., but the manager thinks that it may be higher. He randomly weighs 49
A company packages apples by weight. One of the weight grades is Class A apples. Class A apples have a mean weight of 150 g, and there is a maximum allowed weight tolerance of 5% above or below the mean for apples in the same consumer package. A batch of apples is selected to be included in a Class
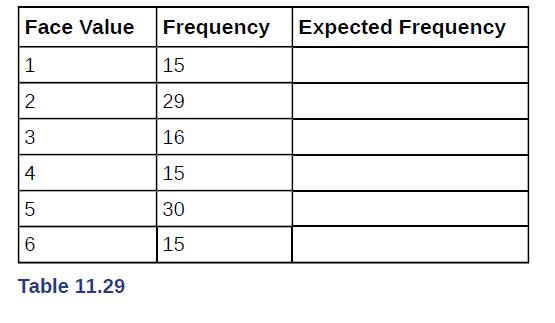
A six-sided die is rolled 120 times. Fill in the expected frequency column. Then, conduct a hypothesis test to determine if the die is fair. The data in Table 11.29 are the result of the 120 rolls. Face Value Frequency Expected Frequency 1 15 2 29 3 16 4 15 5 30 6 15 Table 11.29
The marital status distribution of the U.S. male population, ages 15 and older, is as shown in Table 11.30.Suppose that a random sample of 400 U.S. young adult males, 18 to 24 years old, yielded the following frequency distribution. We are interested in whether this age group of males fits the
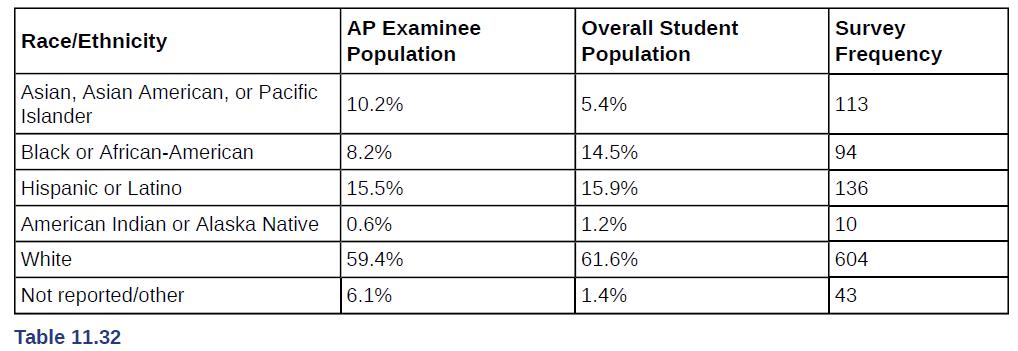
Perform a goodness-of-fit test to determine whether the local results follow the distribution of the U.S. overall student population based on ethnicity.The columns in Table 11.32 contain the Race/Ethnicity of U.S. Public Schools for a recent year, the percentages for the Advanced Placement Examinee
Perform a goodness-of-fit test to determine whether the local results follow the distribution of U.S. AP examinee population, based on ethnicity.The columns in Table 11.32 contain the Race/Ethnicity of U.S. Public Schools for a recent year, the percentages for the Advanced Placement Examinee
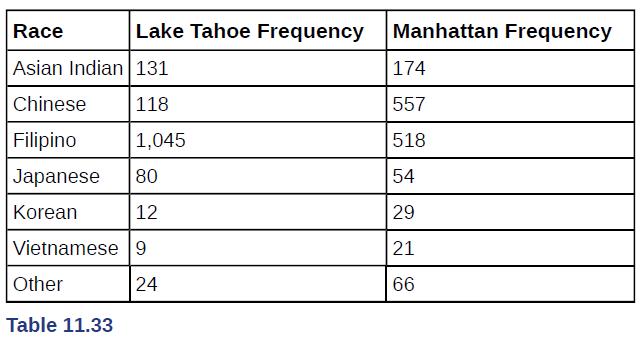
The City of South Lake Tahoe, CA, has an Asian population of 1,419 people, out of a total population of 23,609.Suppose that a survey of 1,419 self-reported Asians in the Manhattan, NY, area yielded the data in Table 11.33. Conduct a goodness-of-fit test to determine if the self-reported sub-groups
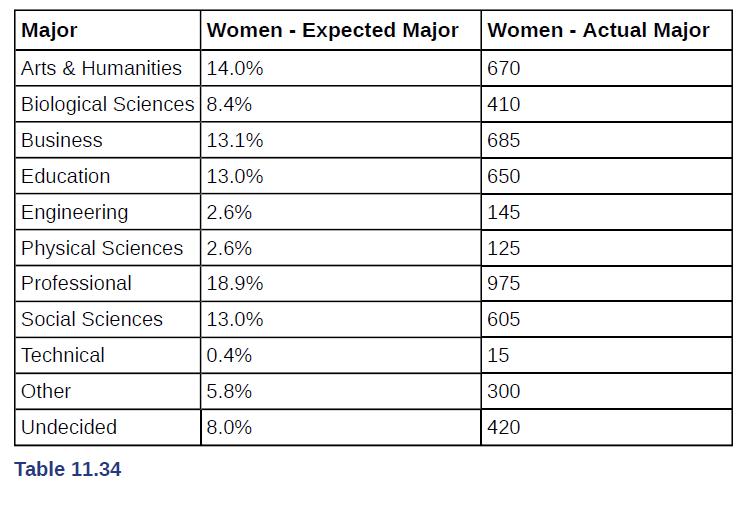
Conduct a goodness-of-fit test to determine if the actual college majors of graduating females fit the distribution of their expected majors.UCLA conducted a survey of more than 263,000 college freshmen from 385 colleges in fall 2005. The results of students' expected majors by gender were reported
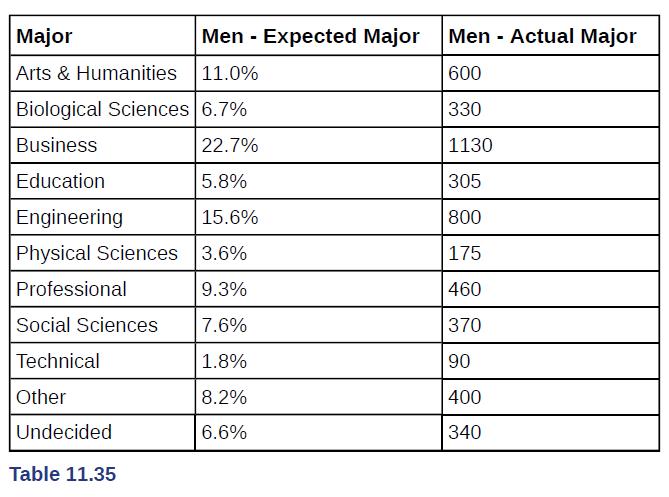
Conduct a goodness-of-fit test to determine if the actual college majors of graduating males fit the distribution of their expected majors.Read the statement and decide whether it is true or false.Conduct a goodness-of-fit test to determine if the actual college majors of graduating females fit the
In general, if the observed values and expected values of a goodness-of-fit test are not close together, then the test statistic can get very large and on a graph will be way out in the right tail.
Use a goodness-of-fit test to determine if high school principals believe that students are absent equally during the week or not.
The test to use to determine if a six-sided die is fair is a goodness-of-fit test.
In a goodness-of fit test, if the p-value is 0.0113, in general, do not reject the null hypothesis.
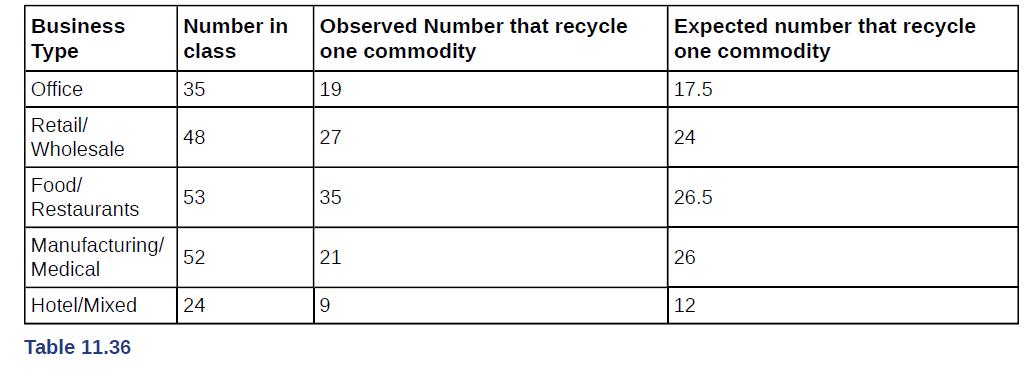
A sample of 212 commercial businesses was surveyed for recycling one commodity; a commodity here means any one type of recyclable material such as plastic or aluminum. Table 11.36 shows the business categories in the survey, the sample size of each category, and the number of businesses in each
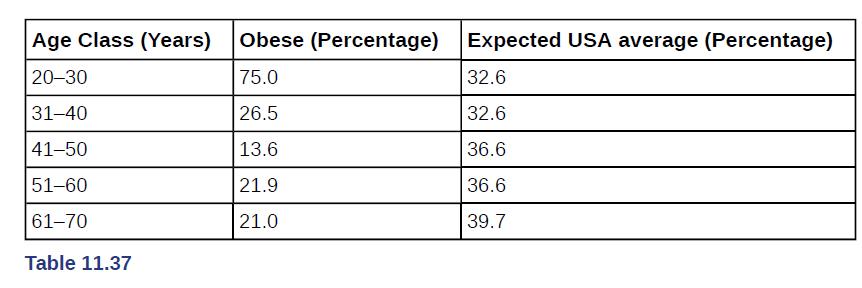
Table 11.37 contains information from a survey among 499 participants classified according to their age groups. The second column shows the percentage of obese people per age class among the study participants. The last column comes from a different study at the national level that shows the
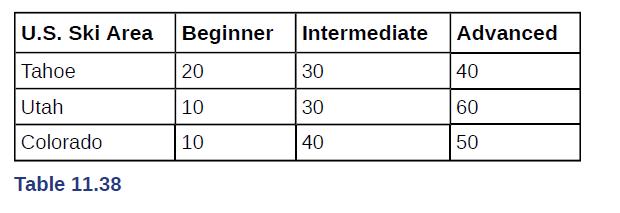
A recent debate about where in the United States skiers believe the skiing is best prompted the following survey. Test to see if the best ski area is independent of the level of the skier. U.S. Ski Area Beginner Intermediate Advanced Tahoe 20 30 40 Utah 10 30 60 Colorado 10 40 50 Table 11.38
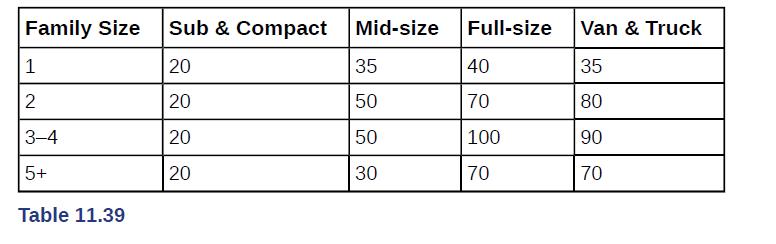
Car manufacturers are interested in whether there is a relationship between the size of car an individual drives and the number of people in the driver’s family (that is, whether car size and family size are independent). To test this, suppose that 800 car owners were randomly surveyed with the
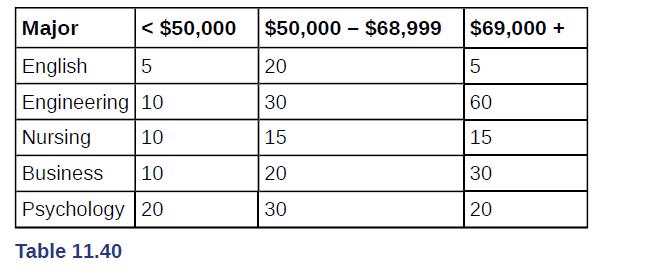
College students may be interested in whether or not their majors have any effect on starting salaries after graduation.Suppose that 300 recent graduates were surveyed as to their majors in college and their starting salaries after graduation.Table 11.40 shows the data. Conduct a test of
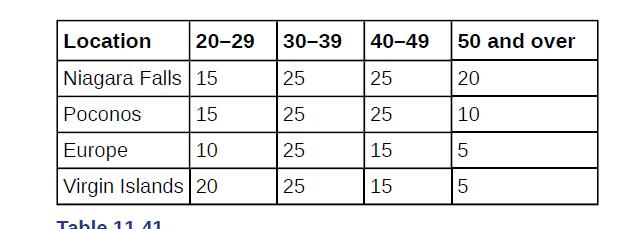
Some travel agents claim that honeymoon hot spots vary according to age of the bride. Suppose that 280 recent brides were interviewed as to where they spent their honeymoons. The information is given in Table 11.41. Conduct a test of independence. Location 20-29 30-39 40-49 50 and over Niagara
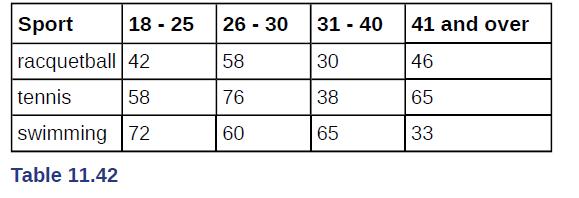
A manager of a sports club keeps information concerning the main sport in which members participate and their ages.To test whether there is a relationship between the age of a member and his or her choice of sport, 643 members of the sports club are randomly selected. Conduct a test of
A major food manufacturer is concerned that the sales for its skinny french fries have been decreasing. As a part of a feasibility study, the company conducts research into the types of fries sold across the country to determine if the type of fries sold is independent of the area of the country.
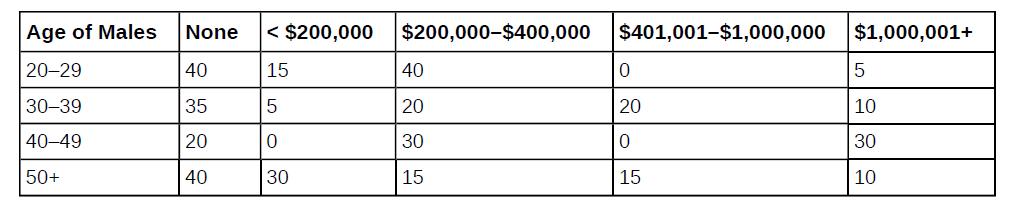
According to Dan Lenard, an independent insurance agent in the Buffalo, N.Y. area, the following is a breakdown of the amount of life insurance purchased by males in the following age groups. He is interested in whether the age of the male and the amount of life insurance purchased are independent
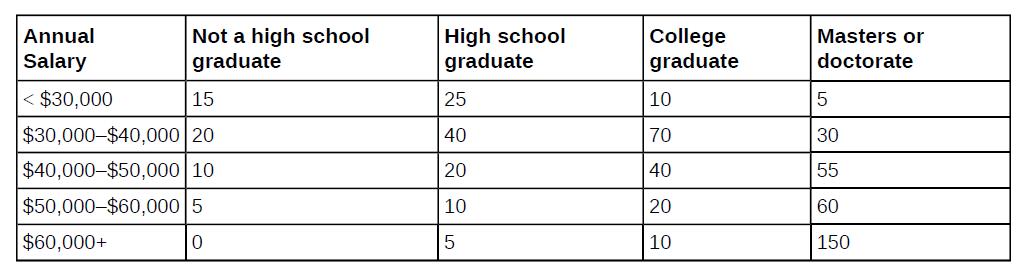
Suppose that 600 thirty-year-olds were surveyed to determine whether or not there is a relationship between the level of education an individual has and salary. Conduct a test of independence. Annual Salary < $30,000 15 $30,000-$40,000 20 Not a high school graduate High school graduate College
The number of degrees of freedom for a test of independence is equal to the sample size minus one.
The test for independence uses tables of observed and expected data values.
The test to use when determining if the college or university a student chooses to attend is related to his or her socioeconomic status is a test for independence.
In a test of independence, the expected number is equal to the row total multiplied by the column total divided by the total surveyed.
An ice cream maker performs a nationwide survey about favorite flavors of ice cream in different geographic areas of the U.S. Based on Table 11.46, do the numbers suggest that geographic location is independent of favorite ice cream flavors? Test at the 5% significance level. Mint U.S. region/
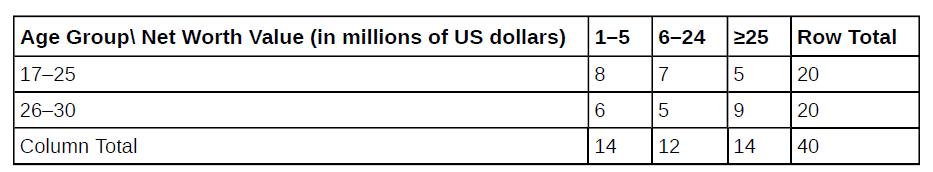
Table 11.47 provides a recent survey of the youngest online entrepreneurs whose net worth is estimated at one million dollars or more. Their ages range from 17 to 30. Each cell in the table illustrates the number of entrepreneurs who correspond to the specific age group and their net worth. Are the
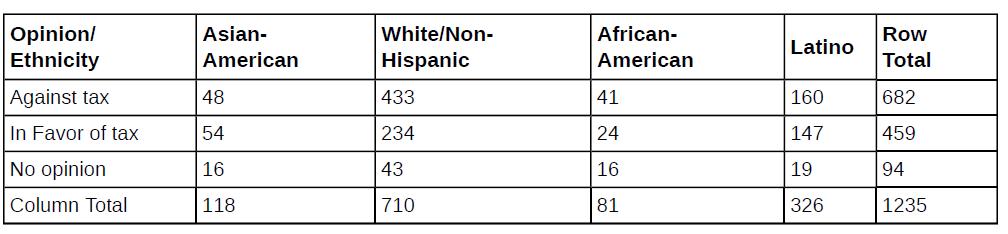
A 2013 poll in California surveyed people about taxing sugar-sweetened beverages. The results are presented in Table 11.48, and are classified by ethnic group and response type. Are the poll responses independent of the participants’ ethnic group? Conduct a test of independence at the 5%
A psychologist is interested in testing whether there is a difference in the distribution of personality types for business majors and social science majors. The results of the study are shown in Table 11.49. Conduct a test of homogeneity. Test at a 5% level of significance. Open Conscientious
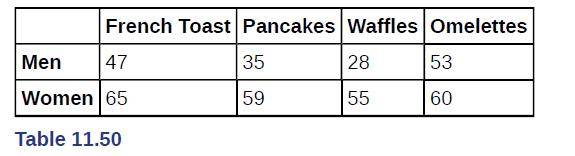
Do men and women select different breakfasts? The breakfasts ordered by randomly selected men and women at a popular breakfast place is shown in Table 11.50. Conduct a test for homogeneity at a 5% level of significance. French Toast Pancakes Waffles Omelettes Men 47 35 28 53 Women 65 59 55 60 Table
A fisherman is interested in whether the distribution of fish caught in Green Valley Lake is the same as the distribution of fish caught in Echo Lake. Of the 191 randomly selected fish caught in Green Valley Lake, 105 were rainbow trout, 27 were other trout, 35 were bass, and 24 were catfish. Of
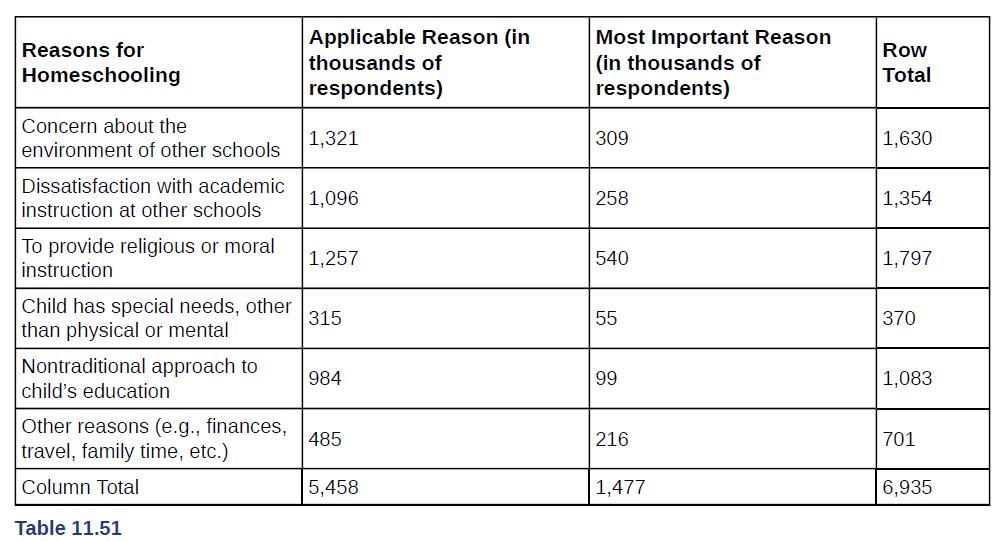
In 2007, the United States had 1.5 million homeschooled students, according to the U.S. National Center for Education Statistics. In Table 11.51 you can see that parents decide to homeschool their children for different reasons, and some reasons are ranked by parents as more important than others.
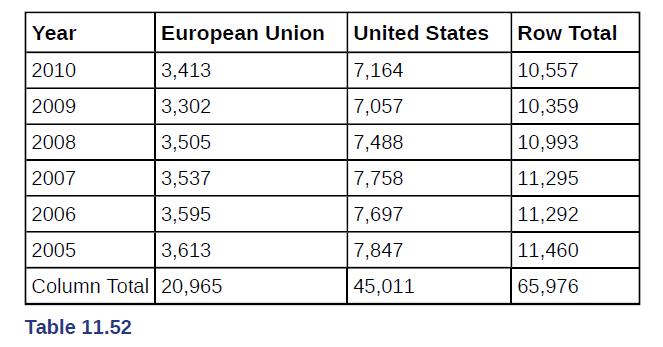
When looking at energy consumption, we are often interested in detecting trends over time and how they correlate among different countries. The information in Table 11.52 shows the average energy use (in units of kg of oil equivalent per capita) in the USA and the joint European Union countries
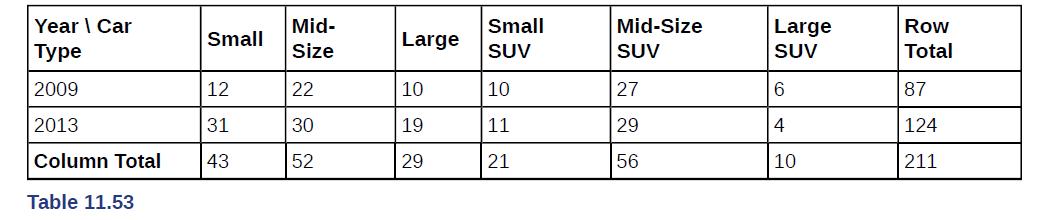
The Insurance Institute for Highway Safety collects safety information about all types of cars every year, and publishes a report of Top Safety Picks among all cars, makes, and models. Table 11.53 presents the number of Top Safety Picks in six car categories for the two years 2009 and 2013. Analyze
Is there a difference between the distribution of community college statistics students and the distribution of university statistics students in what technology they use on their homework? Of some randomly selected community college students, 43 used a computer, 102 used a calculator with built in
If df = 2, the chi-square distribution has a shape that reminds us of the exponential.
a. Explain why a goodness-of-fit test and a test of independence are generally right-tailed tests.b. If you did a left-tailed test, what would you be testing?
It is believed that 70% of males pass their drivers test in the first attempt, while 65% of females pass the test in the first attempt. Of interest is whether the proportions are in fact equal. Indicate if the hypothesis test is fora. independent group means, population standard deviations, and/or
A new laundry detergent is tested on consumers. Of interest is the proportion of consumers who prefer the new brand over the leading competitor. A study is done to test this.Indicate if the hypothesis test is fora. independent group means, population standard deviations, and/or variances knownb.
A new windshield treatment claims to repel water more effectively. Ten windshields are tested by simulating rain without the new treatment. The same windshields are then treated, and the experiment is run again. A hypothesis test is conducted.Indicate if the hypothesis test is fora. independent
The known standard deviation in salary for all mid-level professionals in the financial industry is \($11,000\). Company A and Company B are in the financial industry. Suppose samples are taken of mid-level professionals from Company A and from Company B. The sample mean salary for mid-level
The average worker in Germany gets eight weeks of paid vacation.Indicate if the hypothesis test is fora. independent group means, population standard deviations, and/or variances knownb. independent group means, population standard deviations, and/or variances unknownc. matched or paired samplesd.
According to a television commercial, 80% of dentists agree that Ultrafresh toothpaste is the best on the market.Indicate if the hypothesis test is fora. independent group means, population standard deviations, and/or variances knownb. independent group means, population standard deviations, and/or
It is believed that the average grade on an English essay in a particular school system for females is higher than for males.A random sample of 31 females had a mean score of 82 with a standard deviation of three, and a random sample of 25 males had a mean score of 76 with a standard deviation of
The league mean batting average is 0.280 with a known standard deviation of 0.06. The Rattlers and the Vikings belong to the league. The mean batting average for a sample of eight Rattlers is 0.210, and the mean batting average for a sample of eight Vikings is 0.260. There are 24 players on the
In a random sample of 100 forests in the United States, 56 were coniferous or contained conifers. In a random sample of 80 forests in Mexico, 40 were coniferous or contained conifers. Is the proportion of conifers in the United States statistically more than the proportion of conifers in
A new medicine is said to help improve sleep. Eight subjects are picked at random and given the medicine. The means hours slept for each person were recorded before starting the medication and after.Indicate if the hypothesis test is fora. independent group means, population standard deviations,
It is thought that teenagers sleep more than adults on average. A study is done to verify this. A sample of 16 teenagers has a mean of 8.9 hours slept and a standard deviation of 1.2. A sample of 12 adults has a mean of 6.9 hours slept and a standard deviation of 0.6.Indicate if the hypothesis test
Varsity athletes practice five times a week, on average.Indicate if the hypothesis test is fora. independent group means, population standard deviations, and/or variances knownb. independent group means, population standard deviations, and/or variances unknownc. matched or paired samplesd. single
A sample of 12 in-state graduate school programs at school A has a mean tuition of \($64,000\) with a standard deviation of\($8,000\). At school B, a sample of 16 in-state graduate programs has a mean of \($80,000\) with a standard deviation of $6,000.On average, are the mean tuitions
A new WiFi range booster is being offered to consumers. A researcher tests the native range of 12 different routers under the same conditions. The ranges are recorded. Then the researcher uses the new WiFi range booster and records the new ranges. Does the new WiFi range booster do a better
A high school principal claims that 30% of student athletes drive themselves to school, while 4% of non-athletes drive themselves to school. In a sample of 20 student athletes, 45% drive themselves to school. In a sample of 35 non-athlete students, 6% drive themselves to school. Is the percent of
Showing 6500 - 6600
of 8575
First
59
60
61
62
63
64
65
66
67
68
69
70
71
72
73
Last
Step by Step Answers