New Semester
Started
Get
50% OFF
Study Help!
--h --m --s
Claim Now
Question Answers
Textbooks
Find textbooks, questions and answers
Oops, something went wrong!
Change your search query and then try again
S
Books
FREE
Study Help
Expert Questions
Accounting
General Management
Mathematics
Finance
Organizational Behaviour
Law
Physics
Operating System
Management Leadership
Sociology
Programming
Marketing
Database
Computer Network
Economics
Textbooks Solutions
Accounting
Managerial Accounting
Management Leadership
Cost Accounting
Statistics
Business Law
Corporate Finance
Finance
Economics
Auditing
Tutors
Online Tutors
Find a Tutor
Hire a Tutor
Become a Tutor
AI Tutor
AI Study Planner
NEW
Sell Books
Search
Search
Sign In
Register
study help
business
business statistics
Introductory Business Statistics 1st Edition Alexander Holmes , Barbara Illowsky , Susan Dean - Solutions
Is it acceptable to use a higher sample size than the one calculated by 2 zpq pq? e2
A company has been running an assembly line with 97.42%% of the products made being acceptable. Then, a critical piece broke down. After the repairs the decision was made to see if the number of defective products made was still close enough to the long standing production quality. Samples of 500
a. What is the distribution for the weights of one 25-pound lifting weight? What is the mean and standard deivation?b. What is the distribution for the mean weight of 100 25-pound lifting weights?c. Find the probability that the mean actual weight for the 100 weights is less than 24.9.A
Draw the graph from Exercise 7.1Exercise 7.1What is the distribution for the weights of one 25-pound lifting weight? What is the mean and standard deivation?b. What is the distribution for the mean weight of 100 25-pound lifting weights?c. Find the probability that the mean actual weight for the
Find the probability that the mean actual weight for the 100 weights is greater than 25.2.A manufacturer produces 25-pound lifting weights. The lowest actual weight is 24 pounds, and the highest is 26 pounds. Each weight is equally likely so the distribution of weights is uniform. A sample of 100
Draw the graph from Exercise 7.3. Exercise 7.3Find the probability that the mean actual weight for the 100 weights is greater than 25.2.A manufacturer produces 25-pound lifting weights. The lowest actual weight is 24 pounds, and the highest is 26 pounds. Each weight is equally likely so the
Find the 90th percentile for the mean weight for the 100 weights.A manufacturer produces 25-pound lifting weights. The lowest actual weight is 24 pounds, and the highest is 26 pounds. Each weight is equally likely so the distribution of weights is uniform. A sample of 100 weights is taken.
Draw the graph from Exercise 7.5.Exercise 7.5Find the 90th percentile for the mean weight for the 100 weights.A manufacturer produces 25-pound lifting weights. The lowest actual weight is 24 pounds, and the highest is 26 pounds. Each weight is equally likely so the distribution of weights is
a. What is the distribution for the sum of the weights of 100 25-pound lifting weights?b. Find P(Σx < 2,450). is uniform. A sample of 100 weights is taken.A manufacturer produces 25-pound lifting weights. The lowest actual weight is 24 pounds, and the highest is 26 pounds. Each weight is equally
Draw the graph from Exercise 7.7Exercise 7.7a. What is the distribution for the sum of the weights of 100 25-pound lifting weights?b. Find P(Σx < 2,450). is uniform. A sample of 100 weights is taken.A manufacturer produces 25-pound lifting weights. The lowest actual weight is 24 pounds, and the
Find the 90th percentile for the total weight of the 100 weights.A manufacturer produces 25-pound lifting weights. The lowest actual weight is 24 pounds, and the highest is 26 pounds. Each weight is equally likely so the distribution of weights is uniform. A sample of 100 weights is taken.
Draw the graph from Exercise 7.9Exercise 7.9Find the 90th percentile for the total weight of the 100 weights.A manufacturer produces 25-pound lifting weights. The lowest actual weight is 24 pounds, and the highest is 26 pounds. Each weight is equally likely so the distribution of weights is
a. What is the standard deviation?b. What is the parameter m?The length of time a particular smartphone's battery lasts follows an exponential distribution with a mean of ten months. A sample of 64 of these smartphones is taken.
What is the distribution for the length of time one battery lasts?The length of time a particular smartphone's battery lasts follows an exponential distribution with a mean of ten months. A sample of 64 of these smartphones is taken.
What is the distribution for the mean length of time 64 batteries last?The length of time a particular smartphone's battery lasts follows an exponential distribution with a mean of ten months. A sample of 64 of these smartphones is taken.
What is the distribution for the total length of time 64 batteries last?The length of time a particular smartphone's battery lasts follows an exponential distribution with a mean of ten months. A sample of 64 of these smartphones is taken.
Find the probability that the sample mean is between seven and 11.The length of time a particular smartphone's battery lasts follows an exponential distribution with a mean of ten months. A sample of 64 of these smartphones is taken.
Find the 80th percentile for the total length of time 64 batteries last.
Find the IQR for the mean amount of time 64 batteries last.
Find the middle 80% for the total amount of time 64 batteries last.
Find P(Σx > 420).A uniform distribution has a minimum of six and a maximum of ten. A sample of 50 is taken.
Find the 90th percentile for the sums.A uniform distribution has a minimum of six and a maximum of ten. A sample of 50 is taken.
Find the 15th percentile for the sums.A uniform distribution has a minimum of six and a maximum of ten. A sample of 50 is taken.
Find the first quartile for the sums.A uniform distribution has a minimum of six and a maximum of ten. A sample of 50 is taken.
Find the third quartile for the sums.A uniform distribution has a minimum of six and a maximum of ten. A sample of 50 is taken.
Find the 80th percentile for the sums.A uniform distribution has a minimum of six and a maximum of ten. A sample of 50 is taken.
A population has a mean of 25 and a standard deviation of 2. If it is sampled repeatedly with samples of size 49, what is the mean and standard deviation of the sample means?A uniform distribution has a minimum of six and a maximum of ten. A sample of 50 is taken.
A population has a mean of 48 and a standard deviation of 5. If it is sampled repeatedly with samples of size 36, what is the mean and standard deviation of the sample means?A uniform distribution has a minimum of six and a maximum of ten. A sample of 50 is taken.
A population has a mean of 90 and a standard deviation of 6. If it is sampled repeatedly with samples of size 64, what is the mean and standard deviation of the sample means?
A population has a mean of 120 and a standard deviation of 2.4. If it is sampled repeatedly with samples of size 40, what is the mean and standard deviation of the sample means?
A population has a mean of 17 and a standard deviation of 1.2. If it is sampled repeatedly with samples of size 50, what is the mean and standard deviation of the sample means?
A population has a mean of 17 and a standard deviation of 0.2. If it is sampled repeatedly with samples of size 16, what is the expected value and standard deviation of the sample means?
A population has a mean of 38 and a standard deviation of 3. If it is sampled repeatedly with samples of size 48, what is the expected value and standard deviation of the sample means?
A population has a mean of 14 and a standard deviation of 5. If it is sampled repeatedly with samples of size 60, what is the expected value and standard deviation of the sample means?
A question is asked of a class of 200 freshmen, and 23% of the students know the correct answer. If a sample of 50 students is taken repeatedly, what is the expected value of the mean of the sampling distribution of sample proportions?
A game is played repeatedly. A player wins one-fifth of the time. If samples of 40 times the game is played are taken repeatedly, what is the standard deviation of the mean of the sampling distribution of sample proportions?
Previously, De Anza statistics students estimated that the amount of change daytime statistics students carry is exponentially distributed with a mean of \($0.88.\) Suppose that we randomly pick 25 daytime statistics students.a. In words, Χ = ____________b. Χ ~ _____(_____,_____)c. In words, X̅
Suppose that the distance of fly balls hit to the outfield (in baseball) is normally distributed with a mean of 250 feet and a standard deviation of 50 feet. We randomly sample 49 fly balls.a. If X̅ = average distance in feet for 49 fly balls, then X̅ ~ _______(_______,_______)b. What is the
According to the Internal Revenue Service, the average length of time for an individual to complete (keep records for, learn, prepare, copy, assemble, and send) IRS Form 1040 is 10.53 hours (without any attached schedules). The distribution is unknown. Let us assume that the standard deviation is
Suppose that a category of world-class runners are known to run a marathon (26 miles) in an average of 145 minutes with a standard deviation of 14 minutes. Consider 49 of the races. Let X̅ the average of the 49 races.a. X̅ ~ _____(_____,_____)b. Find the probability that the runner will average
The length of songs in a collector’s iTunes album collection is uniformly distributed from two to 3.5 minutes. Suppose we randomly pick five albums from the collection. There are a total of 43 songs on the five albums.a. In words, Χ = _________b. Χ ~ _____________c. In words, X̅ =
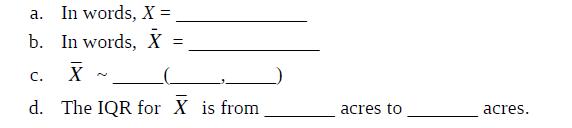
In 1940 the average size of a U.S. farm was 174 acres. Let’s say that the standard deviation was 55 acres. Suppose we randomly survey 38 farmers from 1940. a. In words, X = b. In words, X C. X N = d. The IQR for X is from acres to acres.
Determine which of the following are true and which are false. Then, in complete sentences, justify your answers.a. When the sample size is large, the mean of X̅ is approximately equal to the mean of Χ.b. When the sample size is large, X̅ is approximately normally distributed.c. When the sample
The percent of fat calories that a person in America consumes each day is normally distributed with a mean of about 36 and a standard deviation of about ten. Suppose that 16 individuals are randomly chosen. Let X̅ = average percent of fat calories.a. X̅ ~ ______(______, ______)b. For the group of
The distribution of income in some Third World countries is considered wedge shaped (many very poor people, very few middle income people, and even fewer wealthy people). Suppose we pick a country with a wedge shaped distribution.Let the average salary be \($2,000\) per year with a standard
Which of the following is NOT TRUE about the distribution for averages?a. The mean, median, and mode are equal.b. The area under the curve is one.c. The curve never touches the x-axis.d. The curve is skewed to the right.
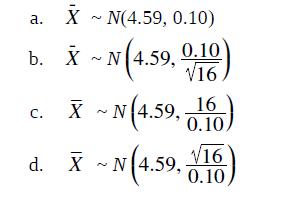
The cost of unleaded gasoline in the Bay Area once followed an unknown distribution with a mean of $4.59 and a standard deviation of $0.10. Sixteen gas stations from the Bay Area are randomly chosen. We are interested in the average cost of gasoline for the 16 gas stations. The distribution to use
A large population has skewed data with a mean of 70 and a standard deviation of 6. Samples of size 100 are taken, and the distribution of the means of these samples is analyzed.a. Will the distribution of the means be closer to a normal distribution than the distribution of the population?b. Will
A population has a standard deviation of 50. It is sampled with samples of size 100. What is the variance of the means of the samples?
A farmer picks pumpkins from a large field. The farmer makes samples of 260 pumpkins and inspects them. If one in fifty pumpkins are not fit to market and will be saved for seeds, what is the standard deviation of the mean of the sampling distribution of sample proportions?
A store surveys customers to see if they are satisfied with the service they received. Samples of 25 surveys are taken.One in five people are unsatisfied. What is the variance of the mean of the sampling distribution of sample proportions for the number of unsatisfied customers? What is the
A company gives an anonymous survey to its employees to see what percent of its employees are happy. The company is too large to check each response, so samples of 50 are taken, and the tendency is that three-fourths of the employees are happy. For the mean of the sampling distribution of sample
A pollster asks a single question with only yes and no as answer possibilities. The poll is conducted nationwide, so samples of 100 responses are taken. There are four yes answers for each no answer overall. For the mean of the sampling distribution of sample proportions, find the following for yes
The mean of the sampling distribution of sample proportions has a value of p of 0.3, and sample size of 40.a. Is there a difference in the expected value if p and q reverse roles?b. Is there a difference in the calculation of the standard deviation with the same reversal?
A school has 500 students. Usually, there are an average of 20 students who are absent. If a sample of 30 students is taken on a certain day, what is the probability that at least 2 students in the sample will be absent?
A bottle of water contains 12.05 fluid ounces with a standard deviation of 0.01 ounces. Define the random variable X in words. X = ____________.
A normal distribution has a mean of 61 and a standard deviation of 15. What is the median?
A company manufactures rubber balls. The mean diameter of a ball is 12 cm with a standard deviation of 0.2 cm. Define the random variable X in words. X = ______________.
What is the median?X ~ N(–4, 1)
Fill in the blank X ~ N(3, 5)σ = _______
Fill in the blank X ~ N(–2, 1)μ = _______
What does a z-score measure?
What does standardizing a normal distribution do to the mean?
Is X ~ N(0, 1) a standardized normal distribution? Why or why not?
What is the z-score of x = 12, if it is two standard deviations to the right of the mean?
What is the z-score of x = 9, if it is 1.5 standard deviations to the left of the mean?
What is the z-score of x = –2, if it is 2.78 standard deviations to the right of the mean?
What is the z-score of x = 7, if it is 0.133 standard deviations to the left of the mean?
Suppose X ~ N(2, 6). What value of x has a z-score of three?
Suppose X ~ N(8, 1). What value of x has a z-score of –2.25?
Suppose X ~ N(9, 5). What value of x has a z-score of –0.5?
Suppose X ~ N(2, 3). What value of x has a z-score of –0.67?
Suppose X ~ N(4, 2). What value of x is 1.5 standard deviations to the left of the mean?
Suppose X ~ N(4, 2). What value of x is two standard deviations to the right of the mean?
Suppose X ~ N(8, 9). What value of x is 0.67 standard deviations to the left of the mean?
Suppose X ~ N(12, 6). What is the z-score of x = 2?
Suppose X ~ N(9, 3). What is the z-score of x = 9?
Suppose a normal distribution has a mean of six and a standard deviation of 1.5. What is the z-score of x = 5.5?
In a normal distribution, x = 5 and z = –1.25. This tells you that x = 5 is ____ standard deviations to the ____ (right or left) of the mean.
In a normal distribution, x = 3 and z = 0.67. This tells you that x = 3 is ____ standard deviations to the ____ (right or left) of the mean.
In a normal distribution, x = –2 and z = 6. This tells you that x = –2 is ____ standard deviations to the ____ (right or left) of the mean.
In a normal distribution, x = –5 and z = –3.14. This tells you that x = –5 is ____ standard deviations to the ____ (right or left) of the mean.
In a normal distribution, x = 6 and z = –1.7. This tells you that x = 6 is ____ standard deviations to the ____ (right or left) of the mean.
About what percent of x values from a normal distribution lie within one standard deviation (left and right) of the mean of that distribution?
About what percent of the x values from a normal distribution lie within two standard deviations (left and right) of the mean of that distribution?
About what percent of x values lie between the second and third standard deviations (both sides)?
Suppose X ~ N(15, 3). Between what x values does 68.27% of the data lie? The range of x values is centered at the mean of the distribution (i.e., 15).
Suppose X ~ N(–3, 1). Between what x values does 95.45% of the data lie? The range of x values is centered at the mean of the distribution(i.e., –3).
Suppose X ~ N(–3, 1). Between what x values does 34.14% of the data lie?
About what percent of x values lie between the mean and three standard deviations?
About what percent of x values lie between the mean and one standard deviation?
About what percent of x values lie between the first and second standard deviations from the mean (both sides)?
About what percent of x values lie betwween the first and third standard deviations(both sides)?
The life of Sunshine CD players is normally distributed with mean of 4.1 years and a standard deviation of 1.3 years. A CD player is guaranteed for three years. We are interested in the length of time a CD player lasts.Define the random variable X in words. X = _______________.
The life of Sunshine CD players is normally distributed with mean of 4.1 years and a standard deviation of 1.3 years. A CD player is guaranteed for three years. We are interested in the length of time a CD player lasts.X ~ _____(_____,_____)
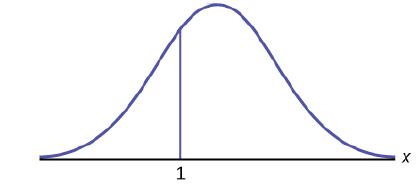
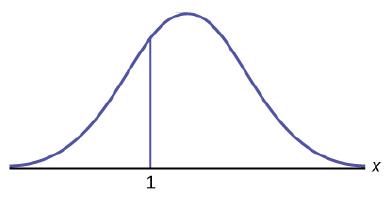
How would you represent the area to the left of one in a probability statement? 1 x
What is the area to the right of one? 1 X
Is P(x < 1) equal to P(x ≤ 1)? Why?
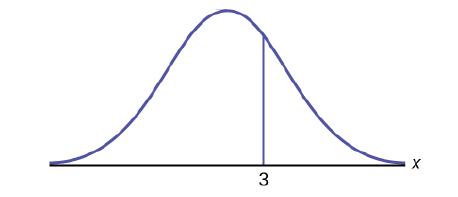
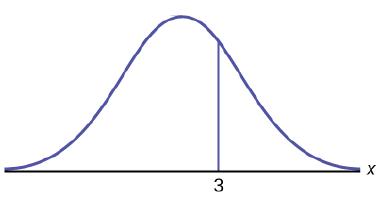
How would you represent the area to the left of three in a probability statement? 3
What is the area to the right of three? 3 X
Showing 6900 - 7000
of 8575
First
63
64
65
66
67
68
69
70
71
72
73
74
75
76
77
Last
Step by Step Answers