New Semester
Started
Get
50% OFF
Study Help!
--h --m --s
Claim Now
Question Answers
Textbooks
Find textbooks, questions and answers
Oops, something went wrong!
Change your search query and then try again
S
Books
FREE
Study Help
Expert Questions
Accounting
General Management
Mathematics
Finance
Organizational Behaviour
Law
Physics
Operating System
Management Leadership
Sociology
Programming
Marketing
Database
Computer Network
Economics
Textbooks Solutions
Accounting
Managerial Accounting
Management Leadership
Cost Accounting
Statistics
Business Law
Corporate Finance
Finance
Economics
Auditing
Tutors
Online Tutors
Find a Tutor
Hire a Tutor
Become a Tutor
AI Tutor
AI Study Planner
NEW
Sell Books
Search
Search
Sign In
Register
study help
business
business statistics
Introductory Business Statistics 1st Edition Alexander Holmes , Barbara Illowsky , Susan Dean - Solutions
The American family has an average of two children. What is the random variable? Describe in words.
The mean entry level salary of an employee at a company is $58,000. You believe it is higher for IT professionals in the company. State the null and alternative hypotheses.
A sociologist claims the probability that a person picked at random in Times Square in New York City is visiting the area is 0.83. You want to test to see if the proportion is actually less. What is the random variable? Describe in words.
A sociologist claims the probability that a person picked at random in Times Square in New York City is visiting the area is 0.83. You want to test to see if the claim is correct. State the null and alternative hypotheses.
In a population of fish, approximately 42% are female. A test is conducted to see if, in fact, the proportion is less. State the null and alternative hypotheses.
Suppose that a recent article stated that the mean time spent in jail by a first–time convicted burglar is 2.5 years. A study was then done to see if the mean time has increased in the new century. A random sample of 26 first-time convicted burglars in a recent year was picked. The mean length of
A random survey of 75 death row inmates revealed that the mean length of time on death row is 17.4 years with a standard deviation of 6.3 years. If you were conducting a hypothesis test to determine if the population mean time on death row could likely be 15 years, what would the null and
The National Institute of Mental Health published an article stating that in any one-year period, approximately 9.5 percent of American adults suffer from depression or a depressive illness. Suppose that in a survey of 100 people in a certain town, seven of them suffered from depression or a
The mean price of mid-sized cars in a region is $32,000. A test is conducted to see if the claim is true. State the Type I and Type II errors in complete sentences.
A sleeping bag is tested to withstand temperatures of –15 °F. You think the bag cannot stand temperatures that low.State the Type I and Type II errors in complete sentences.
For Exercise 9.12, what are α and β in words?Exercise 9.12,A sleeping bag is tested to withstand temperatures of –15 °F. You think the bag cannot stand temperatures that low.State the Type I and Type II errors in complete sentences.
In words, describe 1 – β For Exercise 9.12.Exercise 9.12,A sleeping bag is tested to withstand temperatures of –15 °F. You think the bag cannot stand temperatures that low.State the Type I and Type II errors in complete sentences.
A group of doctors is deciding whether or not to perform an operation. Suppose the null hypothesis, H0, is: the surgical procedure will go well. State the Type I and Type II errors in complete sentences.
A group of doctors is deciding whether or not to perform an operation. Suppose the null hypothesis, H0, is: the surgical procedure will go well. Which is the error with the greater consequence?
A group of divers is exploring an old sunken ship. Suppose the null hypothesis, H0, is: the sunken ship does not contain buried treasure. State the Type I and Type II errors in complete sentences.
A microbiologist is testing a water sample for E-coli. Suppose the null hypothesis, H0, is: the sample contains E-coli.Which is the error with the greater consequence?
Which two distributions can you use for hypothesis testing for this chapter?
Which distribution do you use when you are testing a population mean and the population standard deviation is known?Assume sample size is large. Assume a normal distribution with n ≥ 30.
A population mean is 13. The sample mean is 12.8, and the sample standard deviation is two. The sample size is 20.What distribution should you use to perform a hypothesis test? Assume the underlying population is normal.
A population has a mean is 25 and a standard deviation of five. The sample mean is 24, and the sample size is 108.What distribution should you use to perform a hypothesis test?
It is thought that 42% of respondents in a taste test would prefer Brand A. In a particular test of 100 people, 39%preferred Brand A. What distribution should you use to perform a hypothesis test?
You are performing a hypothesis test of a single population mean using a Student’s t-distribution. What must you assume about the distribution of the data?
You are performing a hypothesis test of a single population mean using a Student’s t-distribution. The data are not from a simple random sample. Can you accurately perform the hypothesis test?
You are performing a hypothesis test of a single population proportion. What must be true about the quantities of np and nq?
You are performing a hypothesis test of a single population proportion. You find out that np is less than five. What must you do to be able to perform a valid hypothesis test?
You are performing a hypothesis test of a single population proportion. The data come from which distribution?
Assume H0: μ = 9 and Ha: μ < 9. Is this a left-tailed, right-tailed, or two-tailed test?
Assume H0: μ ≤ 6 and Ha: μ > 6. Is this a left-tailed, right-tailed, or two-tailed test?
Assume H0: p = 0.25 and Ha: p ≠ 0.25. Is this a left-tailed, right-tailed, or two-tailed test?
Draw the general graph of a left-tailed test.
Draw the graph of a two-tailed test.
A bottle of water is labeled as containing 16 fluid ounces of water. You believe it is less than that. What type of test would you use?
A bathroom scale claims to be able to identify correctly any weight within a pound. You think that it cannot be that accurate. What type of test would you use?
If the alternative hypothesis has a not equals ( ≠ ) symbol, you know to use which type of test?
Assume the null hypothesis states that the mean is at most 12. Is this a left-tailed, right-tailed, or two-tailed test?
Some of the following statements refer to the null hypothesis, some to the alternate hypothesis.State the null hypothesis, H0, and the alternative hypothesis. Ha, in terms of the appropriate parameter (μ or p).a. The mean number of years Americans work before retiring is 34.b. At most 60% of
Over the past few decades, public health officials have examined the link between weight concerns and teen girls' smoking. Researchers surveyed a group of 273 randomly selected teen girls living in Massachusetts (between 12 and 15 years old). After four years the girls were surveyed again.
A statistics instructor believes that fewer than 20% of Evergreen Valley College (EVC) students attended the opening night midnight showing of the latest Harry Potter movie. She surveys 84 of her students and finds that 11 attended the midnight showing. An appropriate alternative hypothesis is:a. p
When a new drug is created, the pharmaceutical company must subject it to testing before receiving the necessary permission from the Food and Drug Administration (FDA) to market the drug. Suppose the null hypothesis is “the drug is unsafe.” What is the Type II Error?a. To conclude the drug is
A statistics instructor believes that fewer than 20% of Evergreen Valley College (EVC) students attended the opening midnight showing of the latest Harry Potter movie. She surveys 84 of her students and finds that 11 of them attended the midnight showing. The Type I error is to conclude that the
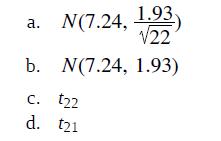
It is believed that Lake Tahoe Community College (LTCC) Intermediate Algebra students get less than seven hours of sleep per night, on average. A survey of 22 LTCC Intermediate Algebra students generated a mean of 7.24 hours with a standard deviation of 1.93 hours. At a level of significance of 5%,
Previously, an organization reported that teenagers spent 4.5 hours per week, on average, on the phone. The organization thinks that, currently, the mean is higher. Fifteen randomly chosen teenagers were asked how many hours per week they spend on the phone. The sample mean was 4.75 hours with a
It is believed that Lake Tahoe Community College (LTCC) Intermediate Algebra students get less than seven hours of sleep per night, on average. A survey of 22 LTCC Intermediate Algebra students generated a mean of 7.24 hours with a standard deviation of 1.93 hours. At a level of significance of 5%,
From generation to generation, the mean age when smokers first start to smoke varies. However, the standard deviation of that age remains constant of around 2.1 years. A survey of 40 smokers of this generation was done to see if the mean starting age is at least 19. The sample mean was 18.1 with a
An article in the San Jose Mercury News stated that students in the California state university system take 4.5 years, on average, to finish their undergraduate degrees. Suppose you believe that the mean time is longer. You conduct a survey of 49 students and obtain a sample mean of 5.1 with a
In 1955, Life Magazine reported that the 25 year-old mother of three worked, on average, an 80 hour week. Recently, many groups have been studying whether or not the women's movement has, in fact, resulted in an increase in the average work week for women (combining employment and at-home work).
A Nissan Motor Corporation advertisement read, “The average man’s I.Q. is 107. The average brown trout’s I.Q. is 4.So why can’t man catch brown trout?” Suppose you believe that the brown trout’s mean I.Q. is greater than four. You catch 12 brown trout. A fish psychologist determines the
According to an article in Newsweek, the natural ratio of girls to boys is 100:105. In China, the birth ratio is 100: 114 (46.7% girls). Suppose you don’t believe the reported figures of the percent of girls born in China. You conduct a study.In this study, you count the number of girls and boys
The mean work week for engineers in a start-up company is believed to be about 60 hours. A newly hired engineer hopes that it’s shorter. She asks ten engineering friends in start-ups for the lengths of their mean work weeks. Based on the results that follow, should she count on the mean work week
Sixty-eight percent of online courses taught at community colleges nationwide were taught by full-time faculty. To test if 68% also represents California’s percent for full-time faculty teaching the online classes, Long Beach City College(LBCC) in California, was randomly selected for comparison.
The mean age of De Anza College students in a previous term was 26.6 years old. An instructor thinks the mean age for online students is older than 26.6. She randomly surveys 56 online students and finds that the sample mean is 29.4 with a standard deviation of 2.1. Conduct a hypothesis test.
Registered nurses earned an average annual salary of \($69,110.\) For that same year, a survey was conducted of 41 California registered nurses to determine if the annual salary is higher than \($69,110\) for California nurses. The sample average was \($71,121\) with a sample standard deviation of
La Leche League International reports that the mean age of weaning a child from breastfeeding is age four to five worldwide. In America, most nursing mothers wean their children much earlier. Suppose a random survey is conducted of 21 U.S. mothers who recently weaned their children. The mean
Over the past few decades, public health officials have examined the link between weight concerns and teen girls' smoking. Researchers surveyed a group of 273 randomly selected teen girls living in Massachusetts (between 12 and 15 years old). After four years the girls were surveyed again.
A statistics instructor believes that fewer than 20% of Evergreen Valley College (EVC) students attended the opening night midnight showing of the latest Harry Potter movie. She surveys 84 of her students and finds that 11 of them attended the midnight showing.At a 1% level of significance, an
According to the Center for Disease Control website, in 2011 at least 18% of high school students have smoked a cigarette. An Introduction to Statistics class in Davies County, KY conducted a hypothesis test at the local high school (a medium sized–approximately 1,200 students–small city
Driver error can be listed as the cause of approximately 54% of all fatal auto accidents, according to the American Automobile Association. Thirty randomly selected fatal accidents are examined, and it is determined that 14 were caused by driver error. Using α = 0.05, is the AAA proportion
For Americans using library services, the American Library Association claims that at most 67% of patrons borrow books. The library director in Owensboro, Kentucky feels this is not true, so she asked a local college statistic class to conduct a survey. The class randomly selected 100 patrons and
A survey in the N.Y. Times Almanac finds the mean commute time (one way) is 25.4 minutes for the 15 largest US cities. The Austin, TX chamber of commerce feels that Austin’s commute time is less and wants to publicize this fact. The mean for 25 randomly selected commuters is 22.1 minutes with a
According to the N.Y. Times Almanac the mean family size in the U.S. is 3.18. A sample of a college math class resulted in the following family sizes: 5; 4; 5; 4; 4; 3; 6; 4; 3; 3; 5; 5; 6; 3; 3; 2; 7; 4; 5; 2; 2; 2; 3; 2 At α = 0.05 level, is the class’ mean family size greater than the
The student academic group on a college campus claims that freshman students study at least 2.5 hours per day, on average. One Introduction to Statistics class was skeptical. The class took a random sample of 30 freshman students and found a mean study time of 137 minutes with a standard deviation
Identify the following:a. x̄ =_______b. sx =_______c. n =_______d. n – 1 =_______ A hospital is trying to cut down on emergency room wait times. It is interested in the amount of time patients must wait before being called back to be examined. An investigation committee randomly surveyed 70
Define the random variables X and x̄ in words.A hospital is trying to cut down on emergency room wait times. It is interested in the amount of time patients must wait before being called back to be examined. An investigation committee randomly surveyed 70 patients. The sample mean was 1.5 hours
Which distribution should you use for this problem?A hospital is trying to cut down on emergency room wait times. It is interested in the amount of time patients must wait before being called back to be examined. An investigation committee randomly surveyed 70 patients. The sample mean was 1.5
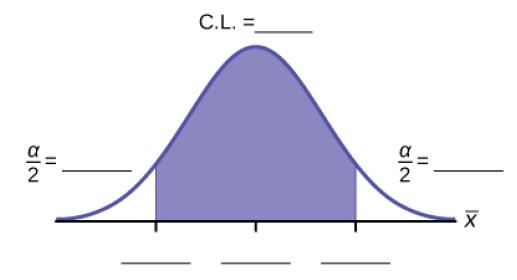
Construct a 95% confidence interval for the population mean time spent waiting. State the confidence interval, sketch the graph, and calculate the error bound.A hospital is trying to cut down on emergency room wait times. It is interested in the amount of time patients must wait before being called
Explain in complete sentences what the confidence interval means.A hospital is trying to cut down on emergency room wait times. It is interested in the amount of time patients must wait before being called back to be examined. An investigation committee randomly surveyed 70 patients. The sample
Identify the following:a. x̄ =_______b. sx =_______c. n =_______d. n – 1 =_______ One hundred eight Americans were surveyed to determine the number of hours they spend watching television each month. It was revealed that they watched an average of 151 hours each month with a standard deviation
Which distribution should you use for this problem?One hundred eight Americans were surveyed to determine the number of hours they spend watching television each month. It was revealed that they watched an average of 151 hours each month with a standard deviation of 32 hours. Assume that the
Construct a 99% confidence interval for the population mean hours spent watching television per month. (a) State the confidence interval, (b) sketch the graph, and (c) calculate the error bound.One hundred eight Americans were surveyed to determine the number of hours they spend watching television
Why would the error bound change if the confidence level were lowered to 95%?One hundred eight Americans were surveyed to determine the number of hours they spend watching television each month. It was revealed that they watched an average of 151 hours each month with a standard deviation of 32
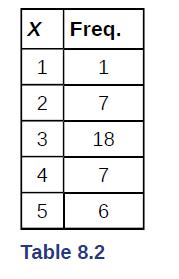
Calculate the following:a. X̅ =______b. sx =______c. n =______ The data in Table 8.2 are the result of a random survey of 39 national flags (with replacement between picks) from various countries. We are interested in finding a confidence interval for the true mean number of colors on a national
Define the random variable X̅ in words.The data in Table 8.2 are the result of a random survey of 39 national flags (with replacement between picks) from various countries. We are interested in finding a confidence interval for the true mean number of colors on a national flag. Let X = the number
What is X̅ estimating?The data in Table 8.2 are the result of a random survey of 39 national flags (with replacement between picks) from various countries. We are interested in finding a confidence interval for the true mean number of colors on a national flag. Let X = the number of colors on a
Is σx known?The data in Table 8.2 are the result of a random survey of 39 national flags (with replacement between picks) from various countries. We are interested in finding a confidence interval for the true mean number of colors on a national flag. Let X = the number of colors on a national
As a result of your answer to Exercise 8.15, state the exact distribution to use when calculating the confidence interval.Construct a 95% confidence interval for the true mean number of colors on national flags.The data in Table 8.2 are the result of a random survey of 39 national flags (with
How much area is in both tails (combined)?The data in Table 8.2 are the result of a random survey of 39 national flags (with replacement between picks) from various countries. We are interested in finding a confidence interval for the true mean number of colors on a national flag. Let X = the
How much area is in each tail?The data in Table 8.2 are the result of a random survey of 39 national flags (with replacement between picks) from various countries. We are interested in finding a confidence interval for the true mean number of colors on a national flag. Let X = the number of colors
Calculate the following:a. lower limitb. upper limitc. error bound The data in Table 8.2 are the result of a random survey of 39 national flags (with replacement between picks) from various countries. We are interested in finding a confidence interval for the true mean number of colors on a
The 95% confidence interval is_____.The data in Table 8.2 are the result of a random survey of 39 national flags (with replacement between picks) from various countries. We are interested in finding a confidence interval for the true mean number of colors on a national flag. Let X = the number of
Fill in the blanks on the graph with the areas, the upper and lower limits of the Confidence Interval and the sample mean.The data in Table 8.2 are the result of a random survey of 39 national flags (with replacement between picks) from various countries. We are interested in finding a confidence
In one complete sentence, explain what the interval means.The data in Table 8.2 are the result of a random survey of 39 national flags (with replacement between picks) from various countries. We are interested in finding a confidence interval for the true mean number of colors on a national flag.
Using the same X̅ , sx , and level of confidence, suppose that n were 69 instead of 39. Would the error bound become larger or smaller? How do you know?The data in Table 8.2 are the result of a random survey of 39 national flags (with replacement between picks) from various countries. We are
Using the same X̅ , sx , and n = 39, how would the error bound change if the confidence level were reduced to 90%?Why?The data in Table 8.2 are the result of a random survey of 39 national flags (with replacement between picks) from various countries. We are interested in finding a confidence
When designing a study to determine this population proportion, what is the minimum number you would need to survey to be 90% confident that the population proportion is estimated to within 0.05?Marketing companies are interested in knowing the population percent of women who make the majority of
If it were later determined that it was important to be more than 90% confident and a new survey were commissioned, how would it affect the minimum number you need to survey? Why?Marketing companies are interested in knowing the population percent of women who make the majority of household
Identify the following:a. x = ______b. n = ______c. p′ = ______ Suppose the marketing company did do a survey. They randomly surveyed 200 households and found that in 120 of them, the woman made the majority of the purchasing decisions. We are interested in the population proportion of households
Define the random variables X and P′ in words.Suppose the marketing company did do a survey. They randomly surveyed 200 households and found that in 120 of them, the woman made the majority of the purchasing decisions. We are interested in the population proportion of households where women make
Which distribution should you use for this problem?Suppose the marketing company did do a survey. They randomly surveyed 200 households and found that in 120 of them, the woman made the majority of the purchasing decisions. We are interested in the population proportion of households where women
Construct a 95% confidence interval for the population proportion of households where the women make the majority of the purchasing decisions. State the confidence interval, sketch the graph, and calculate the error bound.Suppose the marketing company did do a survey. They randomly surveyed 200
List two difficulties the company might have in obtaining random results, if this survey were done by email.Suppose the marketing company did do a survey. They randomly surveyed 200 households and found that in 120 of them, the woman made the majority of the purchasing decisions. We are interested
We are interested in finding the 95% confidence interval for the percent of executives who prefer trucks. Define random variables X and P′ in words.Of 1,050 randomly selected adults, 360 identified themselves as manual laborers, 280 identified themselves as non-manual wage earners, 250 identified
Which distribution should you use for this problem?Of 1,050 randomly selected adults, 360 identified themselves as manual laborers, 280 identified themselves as non-manual wage earners, 250 identified themselves as midlevel managers, and 160 identified themselves as executives. In the survey, 82%
Construct a 95% confidence interval. State the confidence interval, sketch the graph, and calculate the error bound.Of 1,050 randomly selected adults, 360 identified themselves as manual laborers, 280 identified themselves as non-manual wage earners, 250 identified themselves as midlevel managers,
Suppose we want to lower the sampling error. What is one way to accomplish that?Of 1,050 randomly selected adults, 360 identified themselves as manual laborers, 280 identified themselves as non-manual wage earners, 250 identified themselves as midlevel managers, and 160 identified themselves as
The sampling error given in the survey is ±2%. Explain what the ±2% means.Of 1,050 randomly selected adults, 360 identified themselves as manual laborers, 280 identified themselves as non-manual wage earners, 250 identified themselves as midlevel managers, and 160 identified themselves as
Define the random variable X in words.A poll of 1,200 voters asked what the most significant issue was in the upcoming election. Sixty-five percent answered the economy. We are interested in the population proportion of voters who feel the economy is the most important.
Define the random variable P′ in words.A poll of 1,200 voters asked what the most significant issue was in the upcoming election. Sixty-five percent answered the economy. We are interested in the population proportion of voters who feel the economy is the most important.
Which distribution should you use for this problem?A poll of 1,200 voters asked what the most significant issue was in the upcoming election. Sixty-five percent answered the economy. We are interested in the population proportion of voters who feel the economy is the most important.
Construct a 90% confidence interval, and state the confidence interval and the error bound.A poll of 1,200 voters asked what the most significant issue was in the upcoming election. Sixty-five percent answered the economy. We are interested in the population proportion of voters who feel the
What would happen to the confidence interval if the level of confidence were 95%?A poll of 1,200 voters asked what the most significant issue was in the upcoming election. Sixty-five percent answered the economy. We are interested in the population proportion of voters who feel the economy is the
Showing 6700 - 6800
of 8575
First
61
62
63
64
65
66
67
68
69
70
71
72
73
74
75
Last
Step by Step Answers