New Semester
Started
Get
50% OFF
Study Help!
--h --m --s
Claim Now
Question Answers
Textbooks
Find textbooks, questions and answers
Oops, something went wrong!
Change your search query and then try again
S
Books
FREE
Study Help
Expert Questions
Accounting
General Management
Mathematics
Finance
Organizational Behaviour
Law
Physics
Operating System
Management Leadership
Sociology
Programming
Marketing
Database
Computer Network
Economics
Textbooks Solutions
Accounting
Managerial Accounting
Management Leadership
Cost Accounting
Statistics
Business Law
Corporate Finance
Finance
Economics
Auditing
Tutors
Online Tutors
Find a Tutor
Hire a Tutor
Become a Tutor
AI Tutor
AI Study Planner
NEW
Sell Books
Search
Search
Sign In
Register
study help
business
business statistics
Introductory Business Statistics 1st Edition Alexander Holmes , Barbara Illowsky , Susan Dean - Solutions
What is s1 in this problem?Two coworkers commute from the same building. They are interested in whether or not there is any variation in the time it takes them to drive to work. They each record their times for 20 commutes. The first worker’s times have a variance of 12.1. The second worker’s
What is s2 in this problem?Two coworkers commute from the same building. They are interested in whether or not there is any variation in the time it takes them to drive to work. They each record their times for 20 commutes. The first worker’s times have a variance of 12.1. The second worker’s
What is n?Two coworkers commute from the same building. They are interested in whether or not there is any variation in the time it takes them to drive to work. They each record their times for 20 commutes. The first worker’s times have a variance of 12.1. The second worker’s times have a
What is the F statistic?Two coworkers commute from the same building. They are interested in whether or not there is any variation in the time it takes them to drive to work. They each record their times for 20 commutes. The first worker’s times have a variance of 12.1. The second worker’s
Is the claim accurate?
State the null and alternative hypotheses.Two students are interested in whether or not there is variation in their test scores for math class. There are 15 total math tests they have taken so far. The first student’s grades have a standard deviation of 38.1. The second student’s grades have a
What is the F Statistic?Two students are interested in whether or not there is variation in their test scores for math class. There are 15 total math tests they have taken so far. The first student’s grades have a standard deviation of 38.1. The second student’s grades have a standard deviation
What is the critical value?Two students are interested in whether or not there is variation in their test scores for math class. There are 15 total math tests they have taken so far. The first student’s grades have a standard deviation of 38.1. The second student’s grades have a standard
At the 5% significance level, do we reject the null hypothesis?Two students are interested in whether or not there is variation in their test scores for math class. There are 15 total math tests they have taken so far. The first student’s grades have a standard deviation of 38.1. The second
State the null and alternative hypotheses.Two cyclists are comparing the variances of their overall paces going uphill. Each cyclist records his or her speeds going up 35 hills. The first cyclist has a variance of 23.8 and the second cyclist has a variance of 32.1. The cyclists want to see if their
What is the F Statistic?Two cyclists are comparing the variances of their overall paces going uphill. Each cyclist records his or her speeds going up 35 hills. The first cyclist has a variance of 23.8 and the second cyclist has a variance of 32.1. The cyclists want to see if their variances are the
At the 5% significance level, what can we say about the cyclists’ variances?Two cyclists are comparing the variances of their overall paces going uphill. Each cyclist records his or her speeds going up 35 hills. The first cyclist has a variance of 23.8 and the second cyclist has a variance of
Write one assumption.There are five basic assumptions that must be fulfilled in order to perform a one-way ANOVA test. What are they?
Write another assumption.There are five basic assumptions that must be fulfilled in order to perform a one-way ANOVA test. What are they?
Write a third assumption.There are five basic assumptions that must be fulfilled in order to perform a one-way ANOVA test. What are they?
Write a fourth assumption.There are five basic assumptions that must be fulfilled in order to perform a one-way ANOVA test. What are they?
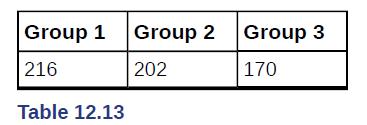
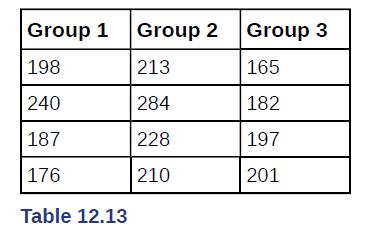
What is the Sum of Squares Factor?There are five basic assumptions that must be fulfilled in order to perform a one-way ANOVA test. What are they?Groups of men from three different areas of the country are to be tested for mean weight. The entries in Table 12.13 are the weights for the different
What is the Sum of Squares Error?Groups of men from three different areas of the country are to be tested for mean weight. The entries in Table 12.13 are the weights for the different groups. Group 1 Group 2 Group 3 216 202 Table 12.13 170
What is the df for the numerator?Groups of men from three different areas of the country are to be tested for mean weight. The entries in Table 12.13 are the weights for the different groups. Group 1 Group 2 Group 3 216 202 Table 12.13 170
What is the df for the denominator?Groups of men from three different areas of the country are to be tested for mean weight. The entries in Table 12.13 are the weights for the different groups. Group 1 Group 2 Group 3 216 202 Table 12.13 170
What is the Mean Square Factor?Groups of men from three different areas of the country are to be tested for mean weight. The entries in Table 12.13 are the weights for the different groups. Group 1 Group 2 Group 3 216 202 Table 12.13 170
What is the Mean Square Error?Groups of men from three different areas of the country are to be tested for mean weight. The entries in Table 12.13 are the weights for the different groups. Group 1 Group 2 Group 3 216 202 Table 12.13 170
What is the F statistic?Groups of men from three different areas of the country are to be tested for mean weight. The entries in Table 12.13 are the weights for the different groups. Group 1 Group 2 Group 3 216 202 Table 12.13 170
What is SSbetween?Groups of men from three different areas of the country are to be tested for mean weight. The entries in Table 12.13 are the weights for the different groups.Girls from four different soccer teams are to be tested for mean goals scored per game. The entries in Table 12.14 are the
What is the df for the numerator?Groups of men from three different areas of the country are to be tested for mean weight. The entries in Table 12.13 are the weights for the different groups.Girls from four different soccer teams are to be tested for mean goals scored per game. The entries in Table
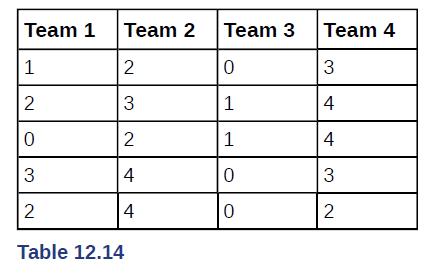
What is MSbetween?Girls from four different soccer teams are to be tested for mean goals scored per game. The entries in Table 12.14 are the goals per game for the different teams. Team 1 Team 2 Team 3 Team 4 1 2 0 3 2 3 1 4 0 2 1 4 3 4 0 3 2 4 0 2 Table 12.14
What is SSwithin?Girls from four different soccer teams are to be tested for mean goals scored per game. The entries in Table 12.14 are the goals per game for the different teams. Team 1 Team 2 Team 3 Team 4 1 2 0 3 2 3 1 4 0 2 1 4 3 4 0 3 2 4 0 2 Table 12.14
What is the df for the denominator?Girls from four different soccer teams are to be tested for mean goals scored per game. The entries in Table 12.14 are the goals per game for the different teams. Team 1 Team 2 Team 3 Team 4 1 2 0 3 2 3 1 4 0 2 1 4 3 4 0 3 2 4 0 2 Table 12.14
What is MSwithin?Girls from four different soccer teams are to be tested for mean goals scored per game. The entries in Table 12.14 are the goals per game for the different teams. Team 1 Team 2 Team 3 Team 4 1 2 0 3 2 3 1 4 0 2 1 4 3 4 0 3 2 4 0 2 Table 12.14
What is the F statistic?Girls from four different soccer teams are to be tested for mean goals scored per game. The entries in Table 12.14 are the goals per game for the different teams. Team 1 Team 2 Team 3 Team 4 1 2 0 3 2 3 1 4 0 2 1 4 3 4 0 3 2 4 0 2 Table 12.14
Judging by the F statistic, do you think it is likely or unlikely that you will reject the null hypothesis?Girls from four different soccer teams are to be tested for mean goals scored per game. The entries in Table 12.14 are the goals per game for the different teams. Team 1 Team 2 Team 3 Team 4 1
An F statistic can have what values?
What happens to the curves as the degrees of freedom for the numerator and the denominator get larger?
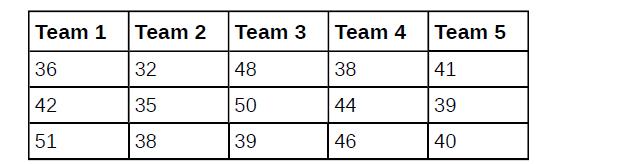
What is the df(num)?Four basketball teams took a random sample of players regarding how high each player can jump (in inches). The results are shown in Table 12.15. Team 1 Team 2 Team 3 Team 4 Team 5 36 32 48 38 41 42 35 50 44 39 51 38 39 46 40
What is the df(denom)?Four basketball teams took a random sample of players regarding how high each player can jump (in inches). The results are shown in Table 12.15. Team 1 Team 2 Team 3 Team 4 Team 5 36 32 48 38 41 42 35 50 44 39 51 38 39 46 40
What are the Sum of Squares and Mean Squares Factors?Four basketball teams took a random sample of players regarding how high each player can jump (in inches). The results are shown in Table 12.15. Team 1 Team 2 Team 3 Team 4 Team 5 36 32 48 38 41 42 35 50 44 39 51 38 39 46 40
What are the Sum of Squares and Mean Squares Errors?Four basketball teams took a random sample of players regarding how high each player can jump (in inches). The results are shown in Table 12.15. Team 1 Team 2 Team 3 Team 4 Team 5 36 32 48 38 41 42 35 50 44 39 51 38 39 46 40
What is the F statistic?Four basketball teams took a random sample of players regarding how high each player can jump (in inches). The results are shown in Table 12.15. Team 1 Team 2 Team 3 Team 4 Team 5 36 32 48 38 41 42 35 50 44 39 51 38 39 46 40
What is the p-value?Four basketball teams took a random sample of players regarding how high each player can jump (in inches). The results are shown in Table 12.15. Team 1 Team 2 Team 3 Team 4 Team 5 36 32 48 38 41 42 35 50 44 39 51 38 39 46 40
At the 5% significance level, is there a difference in the mean jump heights among the teams?Four basketball teams took a random sample of players regarding how high each player can jump (in inches). The results are shown in Table 12.15. Team 1 Team 2 Team 3 Team 4 Team 5 36 32 48 38 41 42 35 50 44
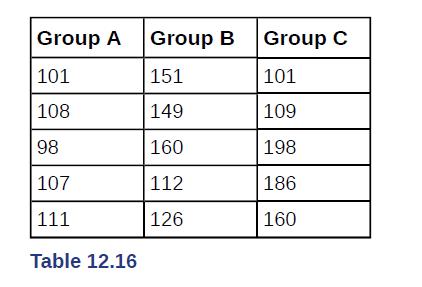
What is the df(num)?A video game developer is testing a new game on three different groups. Each group represents a different target market for the game. The developer collects scores from a random sample from each group. The results are shown in Table 12.16 Group A Group B Group C 101 151 101 108
What is the df(denom)?A video game developer is testing a new game on three different groups. Each group represents a different target market for the game. The developer collects scores from a random sample from each group. The results are shown in Table 12.16 Group A Group B Group C 101 151 101
What are the SSbetween and MSbetween?A video game developer is testing a new game on three different groups. Each group represents a different target market for the game. The developer collects scores from a random sample from each group. The results are shown in Table 12.16 Group A Group B Group C
What are the SSwithin and MSwithin?A video game developer is testing a new game on three different groups. Each group represents a different target market for the game. The developer collects scores from a random sample from each group. The results are shown in Table 12.16 Group A Group B Group C
What is the F Statistic?A video game developer is testing a new game on three different groups. Each group represents a different target market for the game. The developer collects scores from a random sample from each group. The results are shown in Table 12.16 Group A Group B Group C 101 151 101
What is the p-value?A video game developer is testing a new game on three different groups. Each group represents a different target market for the game. The developer collects scores from a random sample from each group. The results are shown in Table 12.16 Group A Group B Group C 101 151 101 108
At the 10% significance level, are the scores among the different groups different?A video game developer is testing a new game on three different groups. Each group represents a different target market for the game. The developer collects scores from a random sample from each group. The results
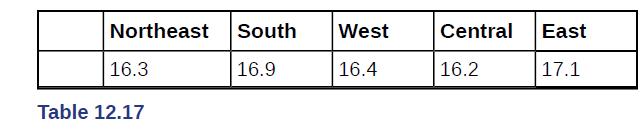
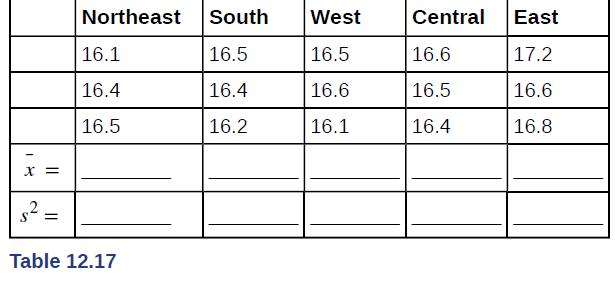
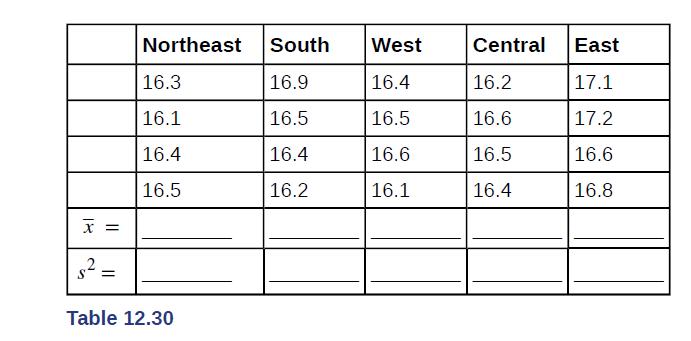
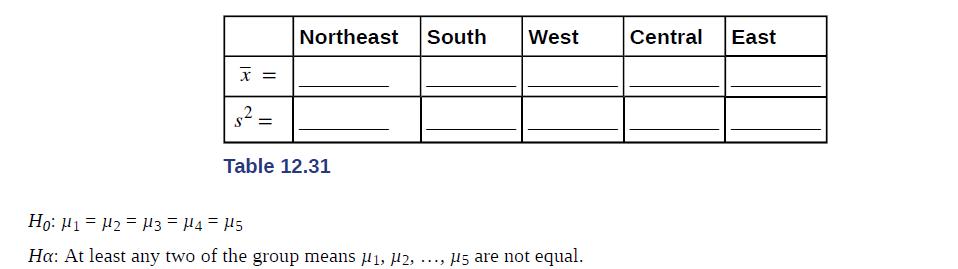
Suppose a group is interested in determining whether teenagers obtain their drivers licenses at approximately the same average age across the country. Suppose that the following data are randomly collected from five teenagers in each region of the country. The numbers represent the age at which
Suppose a group is interested in determining whether teenagers obtain their drivers licenses at approximately the same average age across the country. Suppose that the following data are randomly collected from five teenagers in each region of the country. The numbers represent the age at which
Suppose a group is interested in determining whether teenagers obtain their drivers licenses at approximately the same average age across the country. Suppose that the following data are randomly collected from five teenagers in each region of the country. The numbers represent the age at which
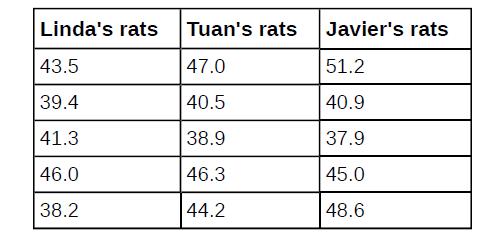
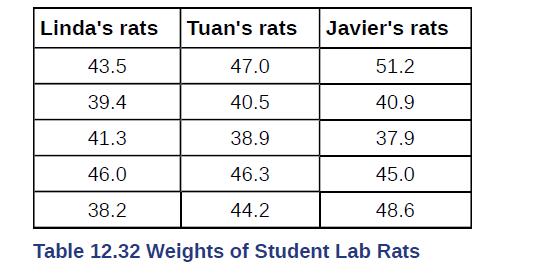
Three students, Linda, Tuan, and Javier, are given five laboratory rats each for a nutritional experiment. Each rat’s weight is recorded in grams. Linda feeds her rats Formula A, Tuan feeds his rats Formula B, and Javier feeds his rats Formula C. At the end of a specified time period, each rat is
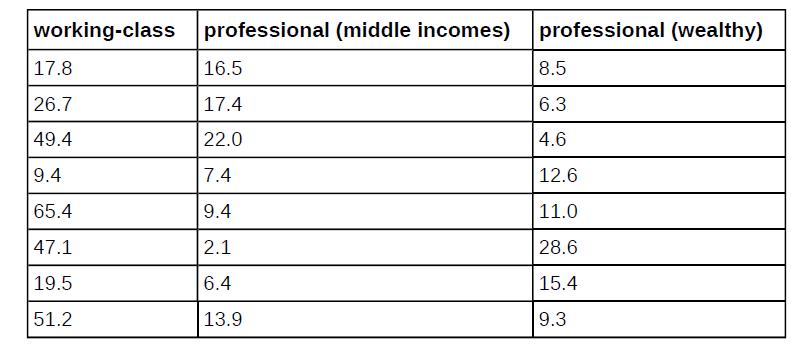
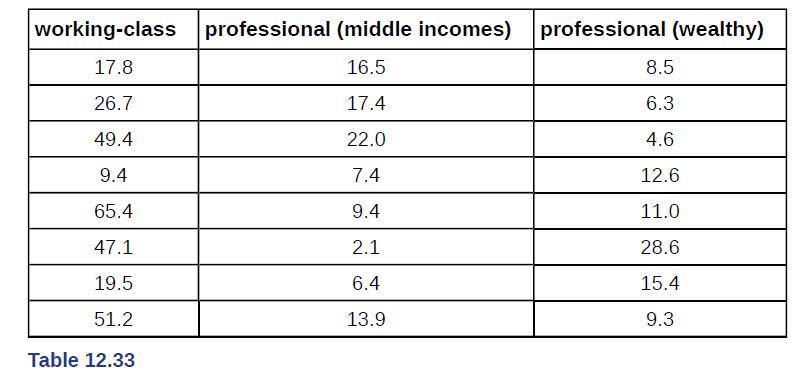
A grassroots group opposed to a proposed increase in the gas tax claimed that the increase would hurt working-class people the most, since they commute the farthest to work. Suppose that the group randomly surveyed 24 individuals and asked them their daily one-way commuting mileage. The results are
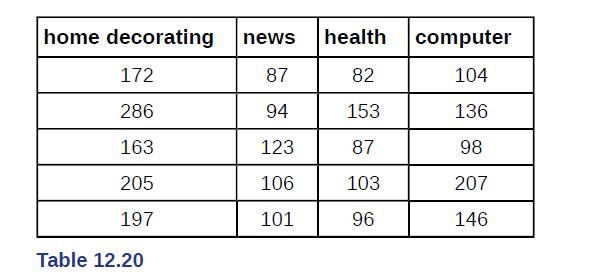
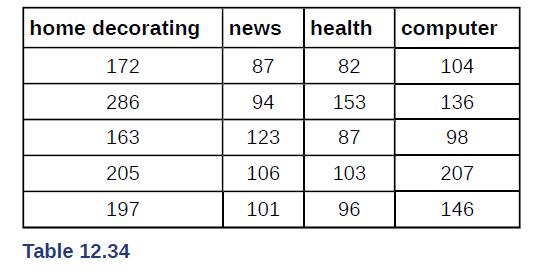
Which two magazine types do you think have the same variance in length?The following table lists the number of pages in four different types of magazines. home decorating news health computer 172 87 82 104 286 94 153 136 163 123 87 98 205 106 103 207 197 101 96 146 Table 12.20
Which two magazine types do you think have different variances in length?The following table lists the number of pages in four different types of magazines. home decorating news health computer 172 87 82 104 286 94 153 136 163 123 87 98 205 106 103 207 197 101 96 146 Table 12.20
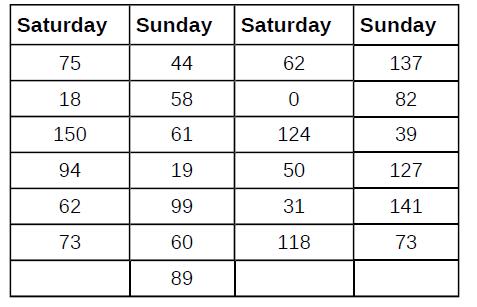
Is the variance for the amount of money, in dollars, that shoppers spend on Saturdays at the mall the same as the variance for the amount of money that shoppers spend on Sundays at the mall? Suppose that the Table 12.21 shows the results of a study. Saturday Sunday Saturday Sunday 75 44 62 137 18
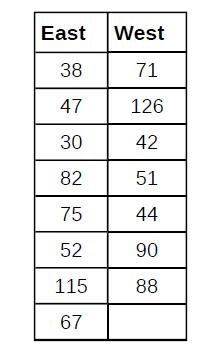
Are the variances for incomes on the East Coast and the West Coast the same? Suppose that Table 12.22 shows the results of a study. Income is shown in thousands of dollars. Assume that both distributions are normal. Use a level of significance of 0.05. East West 38 71 47 126 30 42 82 51 75 44 52 90
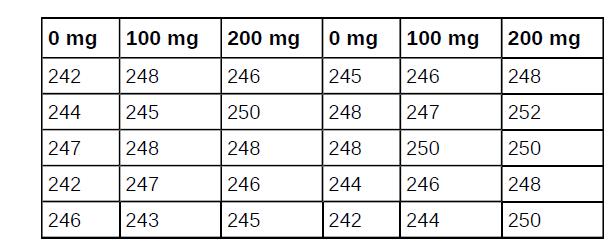
Thirty men in college were taught a method of finger tapping. They were randomly assigned to three groups of ten, with each receiving one of three doses of caffeine: 0 mg, 100 mg, 200 mg. This is approximately the amount in no, one, or two cups of coffee. Two hours after ingesting the caffeine, the
King Manuel I, Komnenus ruled the Byzantine Empire from Constantinople (Istanbul) during the years 1145 to 1180 A.D. The empire was very powerful during his reign, but declined significantly afterwards. Coins minted during his era were found in Cyprus, an island in the eastern Mediterranean Sea.
The American League and the National League of Major League Baseball are each divided into three divisions: East, Central, and West. Many years, fans talk about some divisions being stronger (having better teams) than other divisions.This may have consequences for the postseason. For instance, in
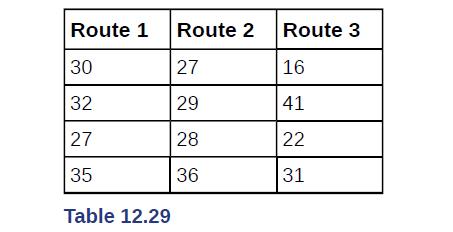
Three different traffic routes are tested for mean driving time. The entries in the Table 12.29 are the driving times in minutes on the three different routes.State SSbetween, SSwithin, and the F statistic. Route 1 Route 2 Route 3 30 27 16 32 29 41 27 28 22 35 36 31 Table 12.29
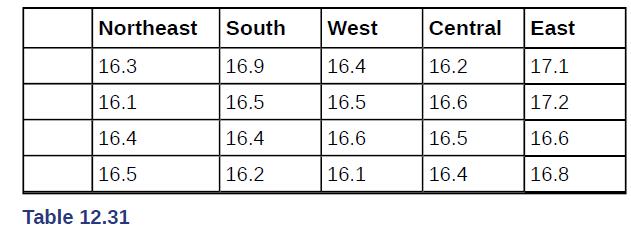
Suppose a group is interested in determining whether teenagers obtain their drivers licenses at approximately the same average age across the country. Suppose that the following data are randomly collected from five teenagers in each region of the country. The numbers represent the age at which
Suppose a group is interested in determining whether teenagers obtain their drivers licenses at approximately the same average age across the country. Suppose that the following data are randomly collected from five teenagers in each region of the country. The numbers represent the age at which
Suppose a group is interested in determining whether teenagers obtain their drivers licenses at approximately the same average age across the country. Suppose that the following data are randomly collected from five teenagers in each region of the country. The numbers represent the age at which
Suppose a group is interested in determining whether teenagers obtain their drivers licenses at approximately the same average age across the country. Suppose that the following data are randomly collected from five teenagers in each region of the country. The numbers represent the age at which
Three students, Linda, Tuan, and Javier, are given five laboratory rats each for a nutritional experiment. Each rat's weight is recorded in grams. Linda feeds her rats Formula A, Tuan feeds his rats Formula B, and Javier feeds his rats Formula C. At the end of a specified time period, each rat is
A grassroots group opposed to a proposed increase in the gas tax claimed that the increase would hurt working-class people the most, since they commute the farthest to work. Suppose that the group randomly surveyed 24 individuals and asked them their daily one-way commuting mileage. The results are
Using a significance level of 5%, test the hypothesis that the four magazine types have the same mean length.Table 12.34 lists the number of pages in four different types of magazines. home decorating news health computer 172 87 82 104 286 94 153 136 163 123 87 98 205 106 103 207 197 101 96 146
Eliminate one magazine type that you now feel has a mean length different from the others. Redo the hypothesis test, testing that the remaining three means are statistically the same. Use a new solution sheet. Based on this test, are the mean lengths for the remaining three magazines statistically
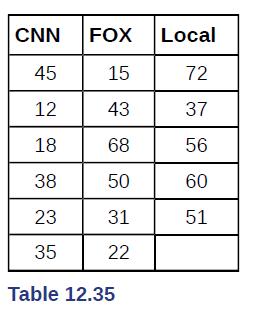
A researcher wants to know if the mean times (in minutes) that people watch their favorite news station are the same.Suppose that Table 12.35 shows the results of a study.Assume that all distributions are normal, the four population standard deviations are approximately the same, and the data were
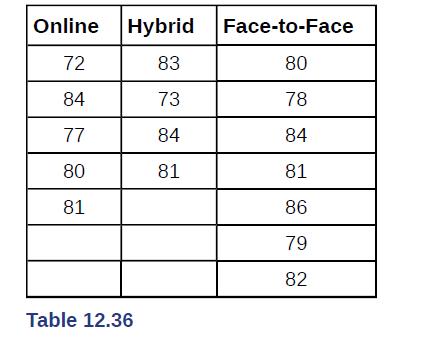
Are the means for the final exams the same for all statistics class delivery types? Table 12.36 shows the scores on final exams from several randomly selected classes that used the different delivery types.Assume that all distributions are normal, the four population standard deviations are
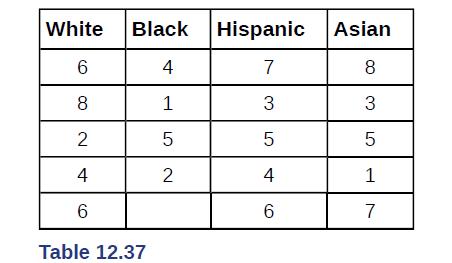
Are the mean number of times a month a person eats out the same for whites, blacks, Hispanics and Asians? Suppose that Table 12.37 shows the results of a study.Assume that all distributions are normal, the four population standard deviations are approximately the same, and the data were collected
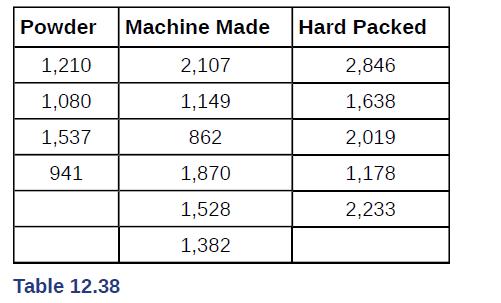
Are the mean numbers of daily visitors to a ski resort the same for the three types of snow conditions? Suppose that Table 12.38 shows the results of a study.Assume that all distributions are normal, the four population standard deviations are approximately the same, and the data were collected
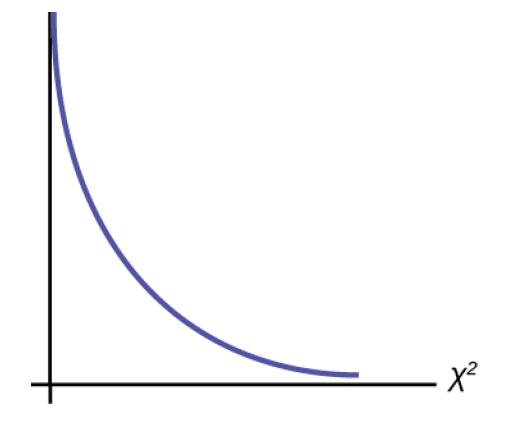
If the number of degrees of freedom for a chi-square distribution is 25, what is the population mean and standard deviation?
If df > 90, the distribution is _____________. If df = 15, the distribution is ________________.
When does the chi-square curve approximate a normal distribution?
Where is μ located on a chi-square curve?
Is it more likely the df is 90, 20, or two in the graph? x
What type of test should be used?An archer’s standard deviation for his hits is six (data is measured in distance from the center of the target). An observer claims the standard deviation is less.
State the null and alternative hypotheses.An archer’s standard deviation for his hits is six (data is measured in distance from the center of the target). An observer claims the standard deviation is less.
Is this a right-tailed, left-tailed, or two-tailed test?An archer’s standard deviation for his hits is six (data is measured in distance from the center of the target). An observer claims the standard deviation is less.
What type of test should be used?The standard deviation of heights for students in a school is 0.81. A random sample of 50 students is taken, and the standard deviation of heights of the sample is 0.96. A researcher in charge of the study believes the standard deviation of heights for the school is
State the null and alternative hypotheses.The standard deviation of heights for students in a school is 0.81. A random sample of 50 students is taken, and the standard deviation of heights of the sample is 0.96. A researcher in charge of the study believes the standard deviation of heights for the
The standard deviation of heights for students in a school is 0.81. A random sample of 50 students is taken, and the standard deviation of heights of the sample is 0.96. A researcher in charge of the study believes the standard deviation of heights for the school is greater than 0.81.df = ________
What type of test should be used?The average waiting time in a doctor’s office varies. The standard deviation of waiting times in a doctor’s office is 3.4 minutes. A random sample of 30 patients in the doctor’s office has a standard deviation of waiting times of 4.1 minutes. One doctor
What is the test statistic?The average waiting time in a doctor’s office varies. The standard deviation of waiting times in a doctor’s office is 3.4 minutes. A random sample of 30 patients in the doctor’s office has a standard deviation of waiting times of 4.1 minutes. One doctor believes the
What can you conclude at the 5% significance level?The average waiting time in a doctor’s office varies. The standard deviation of waiting times in a doctor’s office is 3.4 minutes. A random sample of 30 patients in the doctor’s office has a standard deviation of waiting times of 4.1 minutes.
An archeologist is calculating the distribution of the frequency of the number of artifacts she finds in a dig site. Based on previous digs, the archeologist creates an expected distribution broken down by grid sections in the dig site. Once the site has been fully excavated, she compares the
An economist is deriving a model to predict outcomes on the stock market. He creates a list of expected points on the stock market index for the next two weeks. At the close of each day’s trading, he records the actual points on the index. He wants to see how well his model matched what actually
A personal trainer is putting together a weight-lifting program for her clients. For a 90-day program, she expects each client to lift a specific maximum weight each week. As she goes along, she records the actual maximum weights her clients lifted. She wants to know how well her expectations met
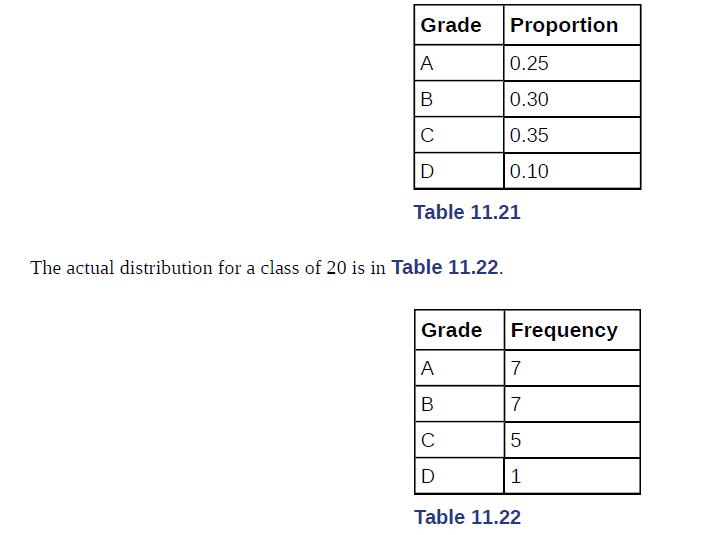
A teacher predicts that the distribution of grades on the final exam will be and they are recorded in Table 11.21.d f = ______ Grade Proportion A 0.25 B 0.30 C 0.35 D 0.10 Table 11.21 The actual distribution for a class of 20 is in Table 11.22. Grade Frequency A 7 B 7 C 5 D 1 Table 11.22
State the null and alternative hypotheses.A teacher predicts that the distribution of grades on the final exam will be and they are recorded in Table 11.21. Grade Proportion A 0.25 B 0.30 C 0.35 D 0.10 Table 11.21 The actual distribution for a class of 20 is in Table 11.22. Grade Frequency A 7 B 7
A teacher predicts that the distribution of grades on the final exam will be and they are recorded in Table 11.21.χ2 test statistic = ______ Grade Proportion A 0.25 B 0.30 C 0.35 D 0.10 Table 11.21 The actual distribution for a class of 20 is in Table 11.22. Grade Frequency A 7 B 7 C 5 D 1 Table
At the 5% significance level, what can you conclude?A teacher predicts that the distribution of grades on the final exam will be and they are recorded in Table 11.21. Grade Proportion A 0.25 B 0.30 C 0.35 D 0.10 Table 11.21 The actual distribution for a class of 20 is in Table 11.22. Grade
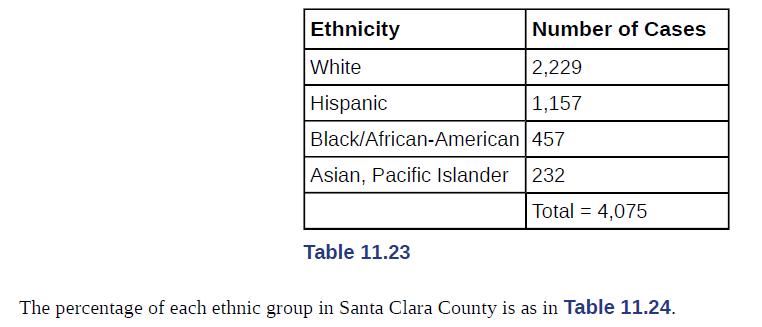
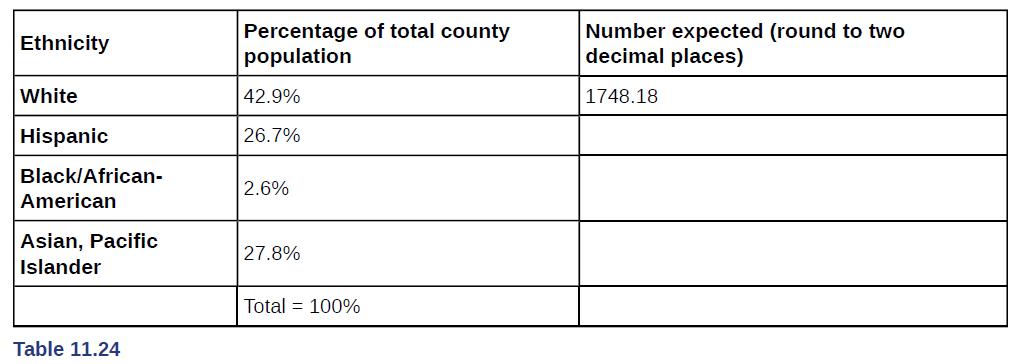
If the ethnicities of AIDS victims followed the ethnicities of the total county population, fill in the expected number of cases per ethnic group.Perform a goodness-of-fit test to determine whether the occurrence of AIDS cases follows the ethnicities of the general population of Santa Clara
The following data are real. The cumulative number of AIDS cases reported for Santa Clara County is broken down by ethnicity as in Table 11.23.H0: _______ Ethnicity White Hispanic Number of Cases 2,229 1,157 Black/African-American 457 Asian, Pacific Islander 232 Total = 4,075 Table 11.23 The
The following data are real. The cumulative number of AIDS cases reported for Santa Clara County is broken down by ethnicity as in Table 11.23.Ha: _______ Ethnicity White Hispanic Number of Cases 2,229 1,157 Black/African-American 457 Asian, Pacific Islander 232 Total = 4,075 Table 11.23 The
Is this a right-tailed, left-tailed, or two-tailed test?The following data are real. The cumulative number of AIDS cases reported for Santa Clara County is broken down by ethnicity as in Table 11.23. Ethnicity White Hispanic Number of Cases 2,229 1,157 Black/African-American 457 Asian, Pacific
The following data are real. The cumulative number of AIDS cases reported for Santa Clara County is broken down by ethnicity as in Table 11.23.degrees of freedom = _______ Ethnicity White Hispanic Number of Cases 2,229 1,157 Black/African-American 457 Asian, Pacific Islander 232 Total = 4,075 Table
The following data are real. The cumulative number of AIDS cases reported for Santa Clara County is broken down by ethnicity as in Table 11.23.χ2 test statistic = _______ Ethnicity White Hispanic Number of Cases 2,229 1,157 Black/African-American 457 Asian, Pacific Islander 232 Total = 4,075 Table
Graph the situation. Label and scale the horizontal axis. Mark the mean and test statistic. Shade in the region corresponding to the confidence level.Let α = 0.05 Decision: ________________ Reason for the Decision: ________________ Conclusion (write out in complete sentences): ________________ The
Showing 6400 - 6500
of 8575
First
58
59
60
61
62
63
64
65
66
67
68
69
70
71
72
Last
Step by Step Answers