New Semester
Started
Get
50% OFF
Study Help!
--h --m --s
Claim Now
Question Answers
Textbooks
Find textbooks, questions and answers
Oops, something went wrong!
Change your search query and then try again
S
Books
FREE
Study Help
Expert Questions
Accounting
General Management
Mathematics
Finance
Organizational Behaviour
Law
Physics
Operating System
Management Leadership
Sociology
Programming
Marketing
Database
Computer Network
Economics
Textbooks Solutions
Accounting
Managerial Accounting
Management Leadership
Cost Accounting
Statistics
Business Law
Corporate Finance
Finance
Economics
Auditing
Tutors
Online Tutors
Find a Tutor
Hire a Tutor
Become a Tutor
AI Tutor
AI Study Planner
NEW
Sell Books
Search
Search
Sign In
Register
study help
business
business statistics
Statistics, Enhanced Unlocking The Power Of Data 2nd Edition Robin H Lock, Patti Frazer Lock, Kari Lock Morgan, Eric F Lock, Dennis F Lock - Solutions
If lizards adapt their behavior to the fire ants, then lizards from the invaded habitats should twitch more than lizards from uninvaded habitats when exposed to red imported fire ants (twitching helps to repel the ants). Test this hypothesis. The variable Twitches is the number of twitches
Exercise 2.153 describes a study to compare the cost of restaurant meals when people pay individually versus splitting the bill as a group. In the experiment 48 subjects were randomly assigned to eight groups of six diners each. Half of the people were told that they would each be responsible for
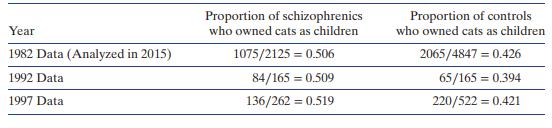
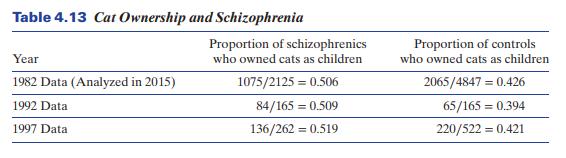
Could owning a cat as a child be related to mental illness later in life? Toxoplasmosis is a disease transmitted primarily through contact with cat feces, and has recently been linked with schizophrenia and other mental illnesses. Also, people infected with Toxoplasmosis tend to like cats more and
Testing \(H_{0}: p=0.5\) vs \(H_{a}: p>0.5\) using \(\hat{p}=0.55\) with each of the following sample sizes:(a) \(\hat{p}=55 / 100=0.55\)(b) \(\hat{p}=275 / 500=0.55\)(c) \(\hat{p}=550 / 1000=0.55\)The same sample statistic is used to test a hypothesis, using different sample sizes. In each case,
Testing \(H_{0}: p=0.5\) vs \(H_{a}: p>0.5\) using \(\hat{p}=0.58\) with each of the following sample sizes:(a) \(\hat{p}=29 / 50=0.58\)(b) \(\hat{p}=290 / 500=0.58\)The same sample statistic is used to test a hypothesis, using different sample sizes. In each case, use StatKey or other technology
Testing \(H_{0}: p_{1}=p_{2}\) vs \(H_{a}: p_{1}>p_{2}\) using \(\hat{p}_{1}-\hat{p}_{2}=0.8-0.7=0.10\) with each of the following sample sizes:(a) \(\hat{p}_{1}=24 / 30=0.8\) and \(\hat{p}_{2}=14 / 20=0.7\)(b) \(\hat{p}_{1}=240 / 300=0.8\) and \(\hat{p}_{2}=140 / 200=0.7\)The same sample statistic
Testing \(H_{0}: p_{1}=p_{2}\) vs \(H_{a}: p_{1}>p_{2}\) using \(\hat{p}_{1}-\hat{p}_{2}=0.45-0.30=0.15\) with each of the following sample sizes:(a) \(\hat{p}_{1}=9 / 20=0.45\) and \(\hat{p}_{2}=6 / 20=0.30\)(b) \(\hat{p}_{1}=90 / 200=0.45\) and \(\hat{p}_{2}=60 / 200=0.30\)(c) \(\hat{p}_{1}=900 /
100 tests conducted using a significance level of \(5 \%\).We are conducting many hypothesis tests to test a claim. In every case, assume that the null hypothesis is true. Approximately how many of the tests will incorrectly find significance?
300 tests using a significance level of \(1 \%\).We are conducting many hypothesis tests to test a claim. In every case, assume that the null hypothesis is true. Approximately how many of the tests will incorrectly find significance?
40 tests using a significance level of \(10 \%\).We are conducting many hypothesis tests to test a claim. In every case, assume that the null hypothesis is true. Approximately how many of the tests will incorrectly find significance?
800 tests using a significance level of \(5 \%\).We are conducting many hypothesis tests to test a claim. In every case, assume that the null hypothesis is true. Approximately how many of the tests will incorrectly find significance?
In Exercise 4.115, we compared the average difference between actual and scheduled arrival times for December flights on two major airlines: Delta and United. Suppose now that we are only interested in the proportion of flights arriving more than 30 minutes after the scheduled time. Of the 1,000
Exercise 4.119 on page 303 revealed an association between owning a cat as a child and developing schizophrenia later in life. Many people enjoy cats as pets, so this conclusion has profound implications and could change pet ownership habits substantially. However, because of the chance for false
Exercise 4.119 on page 303 revealed an association between owning a cat as a child and developing schizophrenia later in life. Many people enjoy cats as pets, so this conclusion has profound implications and could change pet ownership habits substantially. However, because of the chance for false
Does the ability to choose a mate improve offspring fitness in fruit flies? Researchers have studied this by taking female fruit flies and randomly dividing them into two groups; one group is put into a cage with a large number of males and able to freely choose who to mate with, while flies in the
Exercise 4.153 explores the question of whether mate choice improves offspring fitness in fruit flies, and describes two seemingly identical experiments yielding conflicting results (one significant, one insignificant). In fact, the second source was actually a series of three different
Approval Rating for Congress In a Gallup poll conducted in December 2015, a random sample of \(n=824\) American adults were asked "Do you approve or disapprove of the way Congress is handling its job?" The proportion who said they approve is \(\hat{p}=0.13\), and a \(95 \%\) confidence interval
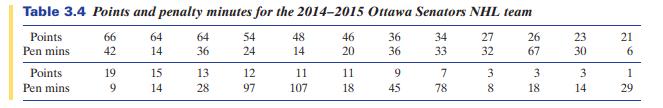
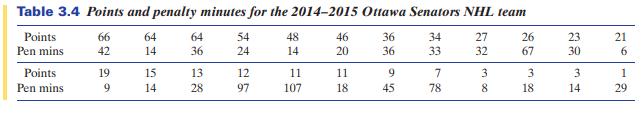
Correlation between points and penalty minutes for all 24 players with at least 10 games played for the 2014-2015 Ottawa Senators NHL hockey team. The data are given in Table 3.4 and the full data are available in the file OttawaSenators. Give the correct notation for the quantity described and
Correlation between height and weight for players on the 2014 Brazil World Cup Team, using data from all 23 players on the roster. State whether the quantity described is a parameter or a statistic and give the correct notation.
Proportion of US adults who own a cell phone. In a survey of 1006 US adults in 2014, 90% said they had a cell phone. Give the correct notation for the quantity described and give its value.
In March 2015, a Nielsen global online survey "found that consumers are increasingly willing to pay more for socially responsible products." Over 30,000 people in 60 countries were polled about their purchasing habits, and \(66\%\) of respondents said that they were willing to pay more for products
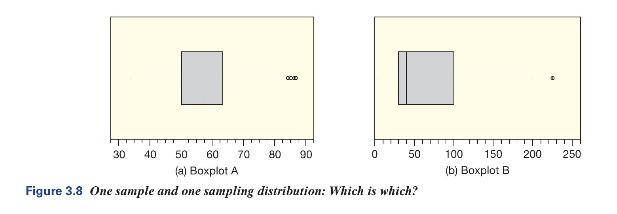
Data 2.7 on page 95 introduces the dataset HollywoodMovies, which contains information on more than 900 movies that came out of Hollywood between 2007 and 2013. One of the variables is the budget (in millions of dollars) to make the movie. Figure 3.8 shows two boxplots. One represents the budget
One of the many wonderful things about studying statistics is that graduate programs in statistics often pay their graduate students, which means that many graduate students in statistics are able to attend graduate school tuition free with an assistantship or fellowship. In 2009, there were 82 US
The dataset NFLContracts 2015 contains the yearly salary (in millions of dollars) from the contracts of all players on a National Football League (NFL) roster at the start of the 2015 season. (a) Use StatKey or other technology to select a random sample of 5 NFL contract Yearly-Salary values.
Exercise 3.31 introduced the dataset StatisticsPhD, which gives enrollment for all 82 graduate statistics programs in the US in 2009. Use StatKey or other technology to generate a sampling distribution of sample means using a sample size of n = 10 from the values in this dataset. What shape does
A Sampling Distribution for Average Salary of NFL Players Use StatKey or other technology to generate a sampling distribution of sample means using a sample of size \(n=5\) from the YearlySalary values in the dataset NFLContracts2015, which gives the total and yearly money values from the contracts
Data 2.7 on page 95 introduces the dataset HollywoodMovies, which contains information on more than 900 movies that came out of Hollywood between 2007 and 2013. We will consider this the population of all movies produced in Hollywood during this time period.(a) Find the mean and standard deviation
In Example 3.1, we see that \(27.5 \%\) of US adults are college graduates.(a) Use StatKey or other technology to generate a sampling distribution for the sample proportion of college graduates using a sample size of \(n=50\). Generate at least 1000 sample proportions. Give the shape and center of
Gender in the Rock and Roll Hall of Fame From its founding through 2015, the Rock and Roll Hall of Fame has inducted 303 groups or individuals. Forty-seven of the inductees have been female or have included female members. The full dataset is available in Rock-and-Roll.(a) What proportion of
Performers in the Rock and Roll Hall of Fame From its founding through 2015, the Rock and Roll Hall of Fame has inducted 303 groups or individuals, and 206 of the inductees have been performers while the rest have been related to the world of music in some way other than as a performer. The full
A Sampling Distribution for Gender in the Rock and Roll Hall of Fame Exercise 3.37 tells us that 47 of the 303 inductees to the Rock and Roll Hall of Fame have been female or have included female members. The data are given in Rock-and-Roll. Using all inductees as your population:(a) Use StatKey or
Exercise 3.38 tells us that 206 of the 303 inductees to the Rock and Roll Hall of Fame have been performers. The data are given in Rock-and-Roll. Using all inductees as your population:(a) Use StatKey or other technology to take many random samples of size \(n=10\) and compute the sample proportion
Researchers continue to find evidence that brains of adolescents behave quite differently than either brains of adults or brains of children. In particular, adolescents seem to hold on more strongly to fear associations than either children or adults, suggesting that frightening connections made
"For many people, being left alone with their thoughts is a most undesirable activity," says a psychologist involved in a study examining reactions to solitude. In the study, 146 college students were asked to hand over their cell phones and sit alone, thinking, for about 10 minutes. Afterward, 76
Exercise 3.58 describes a study in which college students found it unpleasant to sit alone and think. The same article describes a second study in which college students appear to prefer receiving an electric shock to sitting in solitude. The article states that "when asked to spend 15 minutes in
Throughout the US presidential election of 2016, polls gave regular updates on the sample proportion supporting each candidate and the margin of error for the estimates. This attempt to predict the outcome of an election is a common use of polls. In each case below, the proportion of voters who
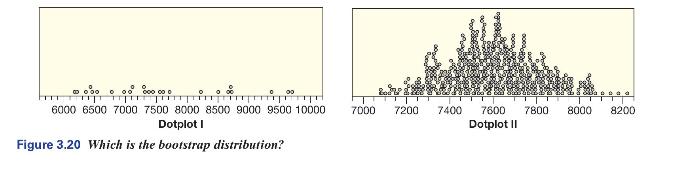
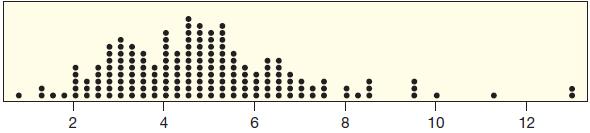
Exercise 2.143 introduces a study examining the relationship between football playing and hippocampal volume, in \(\mu \mathrm{L}\), in the brain. We use the \(n=25\) participants in the control group to estimate average brain hippocampus volume for all non-football playing people. Use the dotplots
For a random sample of 20 automobile models, we record the value of the model as a new car and the value after the car has been purchased and driven 10 miles. The difference between these two values is a measure of the depreciation on the car just by driving it off the lot. Depreciation values from
The data in CarDepreciation given in Exercise 3.93 contains information on both New price and Depreciation for a sample of 20 automobile models.(a) Find the correlation between New price and Depreciation from the original sample of 20 automobiles.(b) Use StatKey or other technology to create a
A study was conducted to investigate the relationship between severe headaches and being left- or right-handed. (Incidentally, Lisa Kudrow, who played Phoebe Buffay on the hit sitcom "Friends," is an author on this study.) Of 273 participants with cluster headaches, 24 were left-handed. Of 477
Use the closeness ratings before the activity (CloseBefore) to estimate the mean closeness rating one person would assign to others in a group.Use data from a study designed to examine the effect of doing synchronized movements (such as marching in step or doing synchronized dance steps) and the
Use the closeness ratings given after the activity (CloseAfter) to estimate the difference in mean rating of closeness between those who have just done a synchronized activity and those who do a non-synchronized activity.Use data from a study designed to examine the effect of doing synchronized
Use the pain tolerance ratings (PainTolerance) after the activity to estimate the difference in mean pain tolerance between those who just completed a synchronized activity and those who did a nonsynchronized activity.Use data from a study designed to examine the effect of doing synchronized
Use the pain tolerance ratings after the activity to estimate the difference in mean pain tolerance between those who just completed a high exertion activity and those who completed a low exertion activity.Use data from a study designed to examine the effect of doing synchronized movements (such as
We see that 75 of the 264 people in the study allowed the pressure to reach its maximum level of \(300 \mathrm{mmHg}\), without ever saying that the pain was too much (MaxPressure=yes). Use this information to estimate the proportion of people who would allow the pressure to reach its maximum
The study recorded whether participants were female or male \((S e x=F\) or M), and we see that 33 of the 165 females and 42 of the 99 males allowed the pressure to reach its maximum level of \(300 \mathrm{mmHg}\) after treatment, without ever saying that the pain was too much. Use this information
Table 3.4 on page 208 shows the number of points scored and penalty minutes for 24 ice hockey players on the Ottawa Senators NHL team for the 2014-2015 season. The data are also stored in OttawaSenators. Assume that we consider these players to be a sample of all NHL players.(a) Create a dotplot of
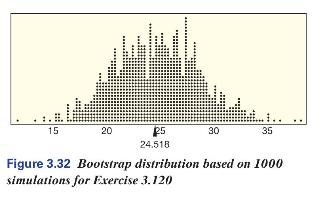
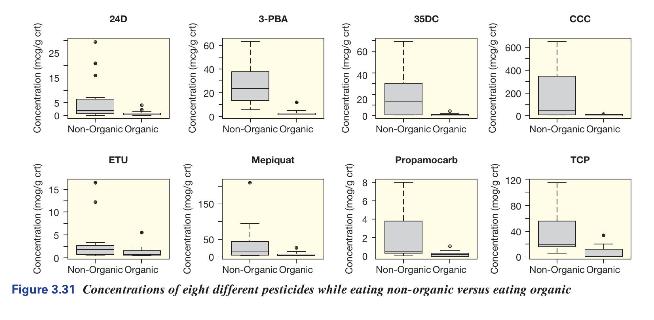
We first study 3-PBA, a commonly used insecticide found in grains, fruits, and vegetables. How much higher are 3-PBA concentrations while not eating organic versus eating organic? A bootstrap distribution based on 1000 samples of the mean concentration before the switch minus the mean concentration
This is actually a paired data situation (since each person was measured before and after eating organic), so we create a new variable, the differences in pesticide concentration, by taking pesticide concentration for a particular pesticide before eating organic (on say, the first day of the week)
You should have found that the confidence interval when utilizing the paired structure of the data was narrower than the confidence interval ignoring this structure (this will generally be the case, and is the primary reason for pairing). How else could we change the width of the confidence
In addition to the quantitative variable pesticide concentration, the researchers also report whether or not the pesticide was detected in the urine (at standard detection levels). Before the participants started eating organic, 111 of the 240 measurements (combining all pesticides and people)
There is some evidence that "young blood" might improve the health, both physically and cognitively, of elderly people (or mice). Exercise 2.69 on page 75 introduces one study in which old mice were randomly assigned to receive transfusions of blood from either young mice or old mice. Researchers
Of all 1,672,395 members of the high school class of 2014 who took the SAT (Scholastic Aptitude Test), 793,986 were minority students. Give the relevant proportion using correct notation.
Sports-Related Concussions in Kids Researchers examined all sports-related concussions reported to an emergency room for children ages 5 to 18 in the United States over the course of one year. Table 2.7 displays the number of concussions in each of the major activity categories.(a) Are these
Culture and Mental Illness A recent study examining the link between schizophrenia and culture interviewed 60 people who had been diagnosed with schizophrenia and who heard voices in their heads. The participants were evenly split between the US, India, and Ghana, and each was interviewed to
Help for Insomniacs In Exercise 1.23, we learned of a study to determine whether just one session of cognitive behavioral therapy can help people with insomnia. In the study, forty people who had been diagnosed with insomnia were randomly divided into two groups of 20 each. People in one group
Success at Quitting Smoking After six months, 156 of the 914 smokers who accepted the invitation to be in the reward-only program stopped smoking, while 78 of the 146 smokers who paid a deposit quit. Set up a two-way table and compare the success rates between participants who entered the two
Accounting for Participation Rates Exercises 2.30 and 2.31 show that smokers who agreed to be in the Deposit group (having their own money at risk) were much more likely to quit smoking than those enrolled in the Reward group, but many fewer of the original subjects assigned to that group agreed
Class Year in Statistics The StudentSurvey data file contains information from a survey done the first day of an introductory statistics course. The Year variable shows the class year (FirstYear, Sophomore, Junior, or Senior) for each student.(a) Use technology to construct a frequency table
Bistro Servers The RestaurantTips data file comes from a sample of 157 bills at a small bistro/wine bar. Three different servers (labeled A, $\mathrm{B}$, and $\mathrm{C}$ ) worked on the nights the bills were collected. Use technology to find the relative frequency for the server who had the most
Class Year by Gender Exercise 2.35 deals with the distribution of class Year for students in an introductory statistics course. The StudentSurvey data also has information on the Gender for each student. Use technology to produce a two-way table showing the gender distribution within each class
Credit Card by Server The RestaurantTips data in Exercise 2.36 also has information on whether each bill was paid with a credit card or cash $($ Credit $=\mathrm{y}$ or $\mathrm{n})$. Use technology to produce a twoway table showing the credit/cash distribution for each server. Comment on any
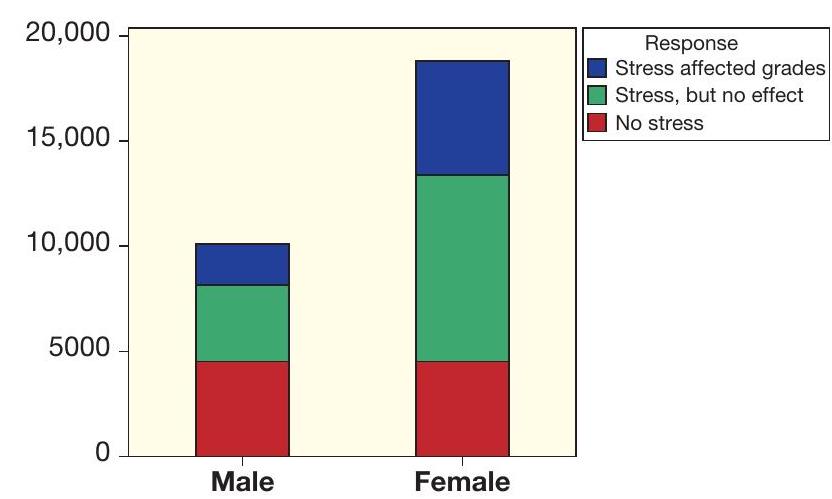
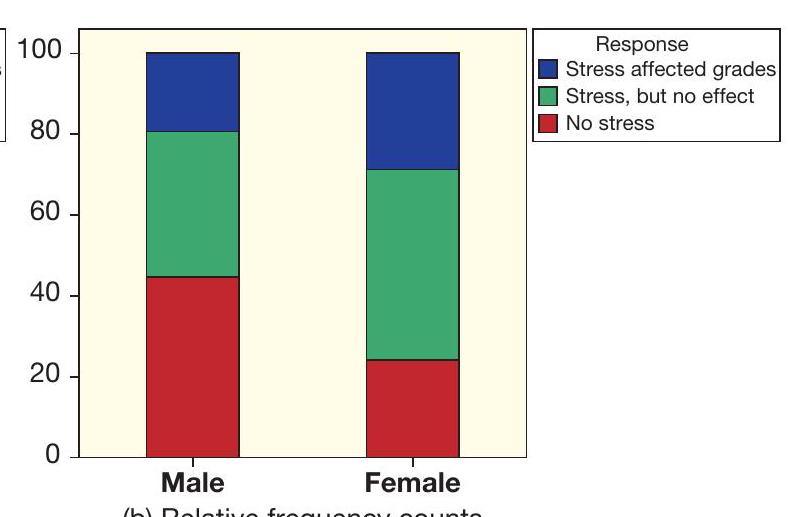
Use technology and the data in StudentSurvey to construct a graph of the relationship between class Year and Gender for the situation in Exercise 2.37.Data From Exercise 2.37:Class Year by Gender Exercise 2.35 deals with the distribution of class Year for students in an introductory statistics
Use technology and the data in RestaurantTips to construct a graph of the relationship between Server and Credit for the situation in Exercise 2.38.Data From Exercise 2.38:Credit Card by Server The RestaurantTips data in Exercise 2.36 also has information on whether each bill was paid with a credit
Donating Blood to Grandma? Can young blood help old brains? Several studies in mice indicate that it might. In the studies, old mice (equivalent to about a 70-year-old person) were randomly assigned to receive blood plasma either from a young mouse (equivalent to about a 25 -year-old person) or
Price Differentiating E-commerce websites "alter results depending on whether consumers use smartphones or particular web browsers," 34 reports a new study. The researchers created clean accounts without cookies or browser history and then searched for specific items at different websites using
The BirthRate variable in the AllCountries dataset gives the birth rate per 1000 people for all the countries in the world. Use technology to create a histogram for this variable, and describe the shape of the distribution: is it relatively symmetric, mildly skewed to the left or right, or strongly
Distribution of Death Rate The DeathRate variable in the AllCountries dataset gives the death rate per 1000 people for all the countries in the world. Use technology to create a histogram for this variable, and describe the shape of the distribution: is it relatively symmetric, mildly skewed to the
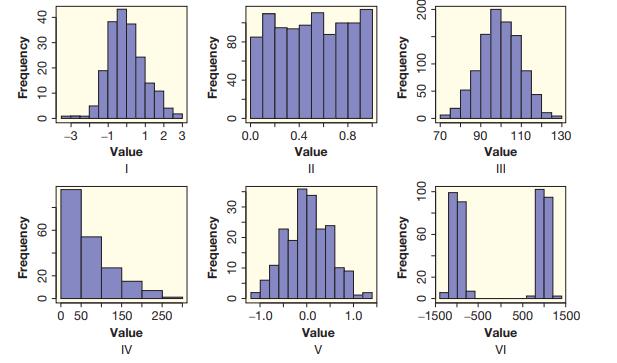
Match each five number summary with one of the histograms in Figure 2.23. The scale is the same on all four histograms.(a) $(1,3,5,7,9)$(b) $(1,4,5,6,9)$(c) $(1,5,7,8,9)$(d) $(1,1,2,4,9)$Figure 2.23: Frequency 0 20 60 Frequency 10 20 30 40 0 3 0 50 150 250 Value IV -1 1 2 3 Value Frequency 0 10 20
Public Expenditure on Education Figure 2.27 shows the public expenditure on education as percentage of Gross Domestic Product (GDP) for all countries. The mean expenditure is $\mu=4.7 %$ and the standard deviation of the expenditures is $\sigma=2 %$. The data are stored in EducationLiteracy.(a)
Distribution of Blocked Shots in the NBA The variable Blocks in the dataset NBAPlayers 2015 includes information on the number of blocked shots during the season for each of the 182 players in the dataset.(a) Use technology to find the mean and the standard deviation of the number of blocked
Which Accomplishment of LeBron James Is Most Impressive? Table 2.23 shows the means and standard deviations for four of the variables in the NBAPlayers2015 dataset. FGPct is the field goal percentage, Points is total number of points scored during the season, Assists is total number of assists
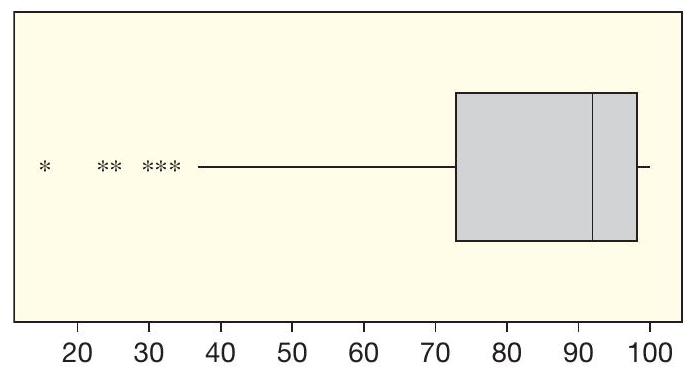
Literacy Rate Figure 2.39 gives a boxplot showing the literacy rate of the countries of the world.Figure 2.39 Literacy rate for countries of the world(a) Describe the shape of the distribution.(b) The middle half of all literacy rates are between approximately what two values?(c) Approximate the
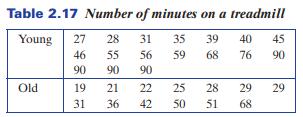
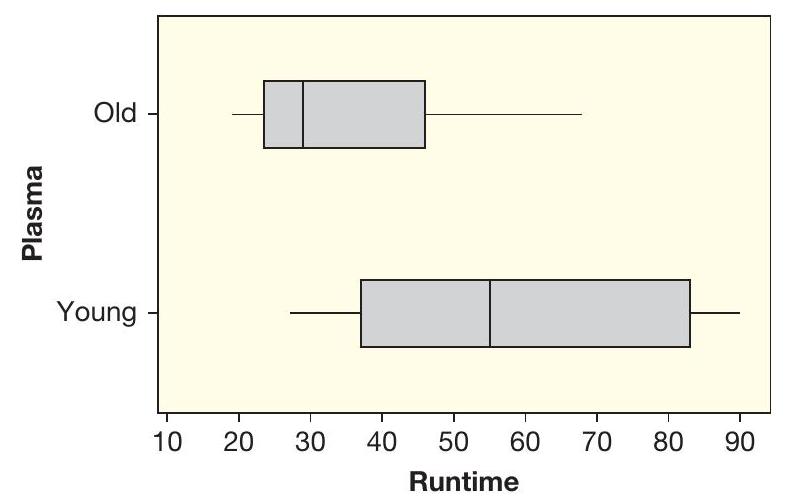
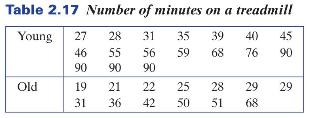
Young Blood Helps Old Brains Exercise 2.69 introduces a study in which old mice were randomly assigned to receive transfusions of blood from either young mice or old mice. Researchers then measured, among other things, the number of minutes each mouse was able to run on a treadmill. The results are
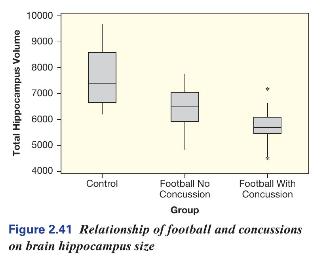
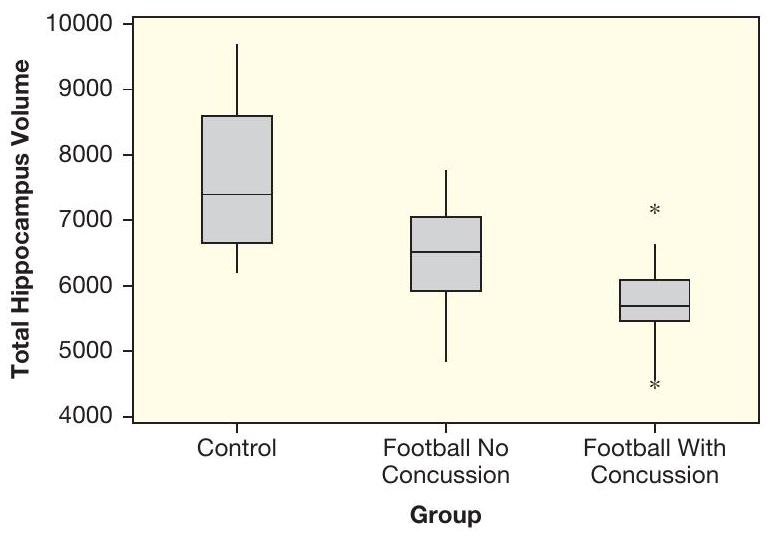
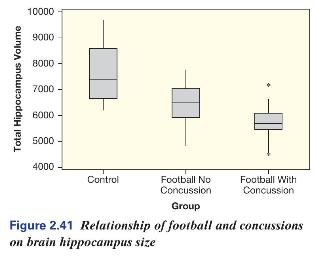
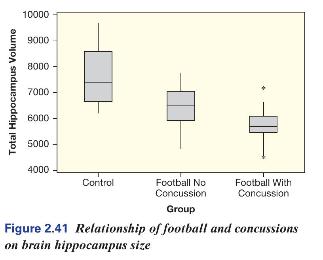
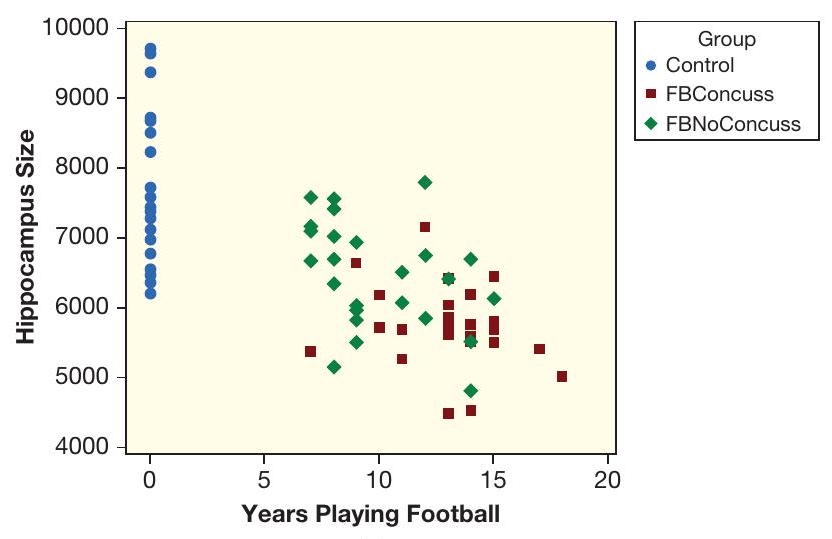
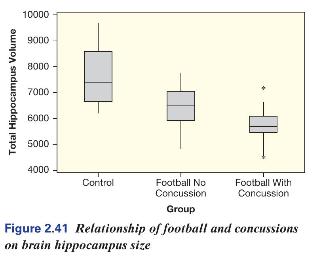
Football and Brain Size A recent study examined the relationship of football and concussions on hippocampus volume in the brain. The study included three groups with $n=25$ in each group: heathy controls who had never played football, football players with no history of concussions, and football
Ronda Rousey Fight Times Perhaps the most popular fighter since the turn of the decade, Ronda Rousey is famous for defeating her opponents quickly. The five number summary for the times of her first 12 UFC (Ultimate Fighting Championship) fights, in seconds, is $(14,25,44,64,289)$.(a) Only three of
Audience Scores on Rotten Tomatoes The variable AudienceScore in the dataset HollywoodMovies gives audience scores (on a scale from 1 to 100) from the Rotten Tomatoes website. The five number summary of these scores is $(19,49,61,74,96)$. Are there any outliers in these scores, according to the IQR
Do Audience Ratings Differ Based on the Genre of the Movie? The dataset HollywoodMovies includes a quantitative variable on the AudienceScore of the movie as well as a categorical variableVariableGenreNMeanStDevMinimumQ1MedianQ3MaximumAudience
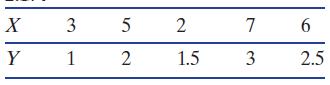
The data in Exercise 2.174.Use technology to find the correlation for the data indicated.Data From Exercise 2.174:Make a scatterplot of the data. Put the $X$ variable on the horizontal axis and the $Y$ variable on the vertical axis. X 3 5 2 7 6 Y 1 2 1.5 3 2.5
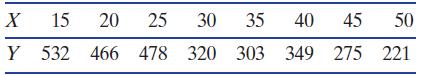
The data in Exercise 2.175.Use technology to find the correlation for the data indicated.Data From Exercise 2.175:Make a scatterplot of the data. Put the $X$ variable on the horizontal axis and the $Y$ variable on the vertical axis. X 15 20 25 30 35 40 45 50 Y 532 466 478 320 303 349 275 221
Social Jetlag Social jetlag refers to the difference between circadian and social clocks, and is measured as the difference in sleep and wake times between work days and free days. For example, if you sleep between $11 \mathrm{pm}$ and 7 am on weekdays but from $2 \mathrm{am}$ to $10 \mathrm{am}$
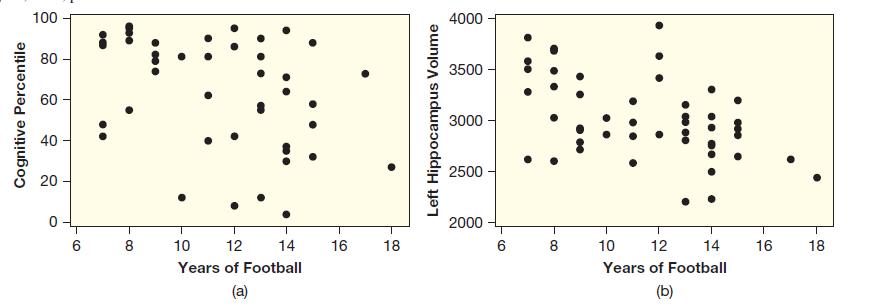
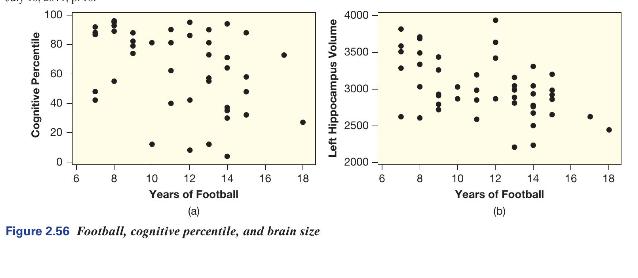
Football, Brain Size, and Cognitive Scores Exercise 2.143 on page 102 introduces a study that examines the association between playing football, brain size as measured by left hippocampal volume (in $\mu \mathrm{L}$ ), and percentile on a cognitive reaction test. Figure 2.56 gives two scatterplots.
Does pre-season success indicate regular season success in the US National Football League? We looked at the number of preseason wins and regular season wins for all 32 NFL teams over a 10 -year span.(a) What would a positive association imply about the relationship between pre-season and regular
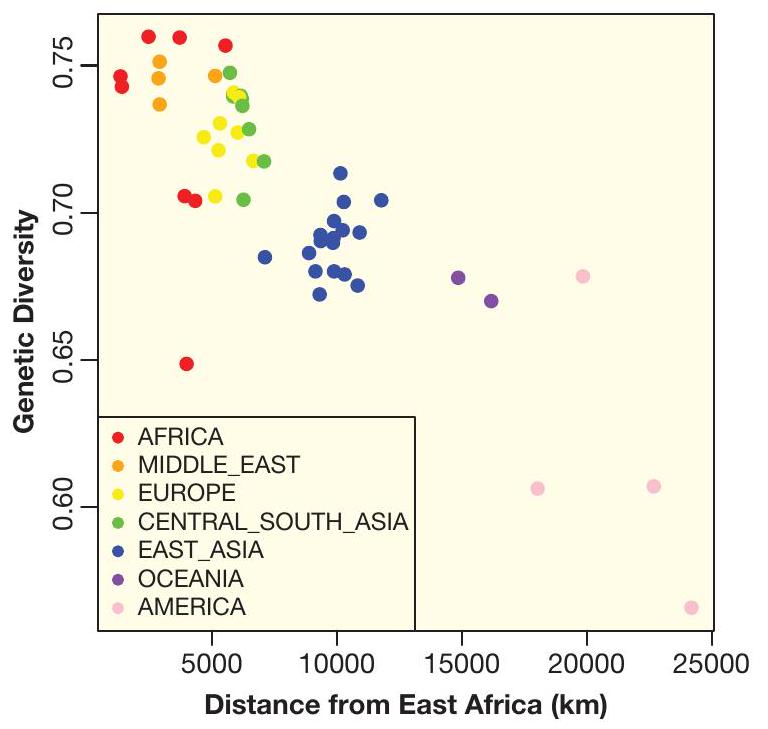
Genetic Diversity and Distance from Africa It is hypothesized that humans originated in East Africa, and migrated from there. We compute a measure of genetic diversity for different populations, and the geographic distance of each population from East Africa (Addis Ababa, Ethiopia), as one would
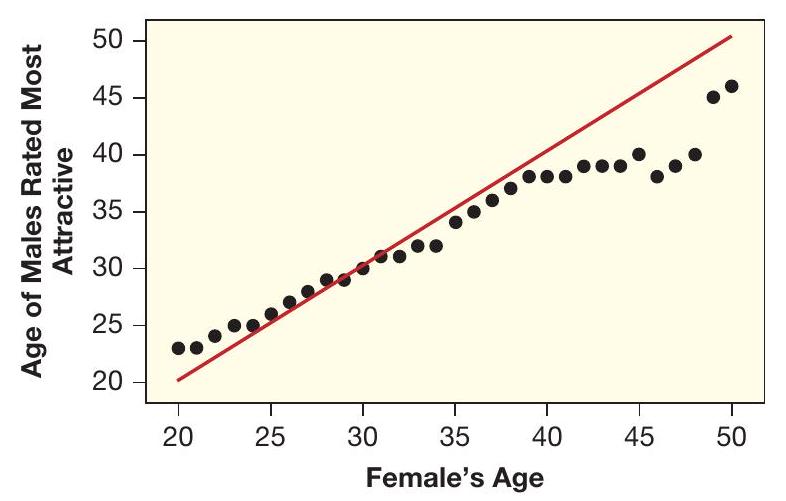
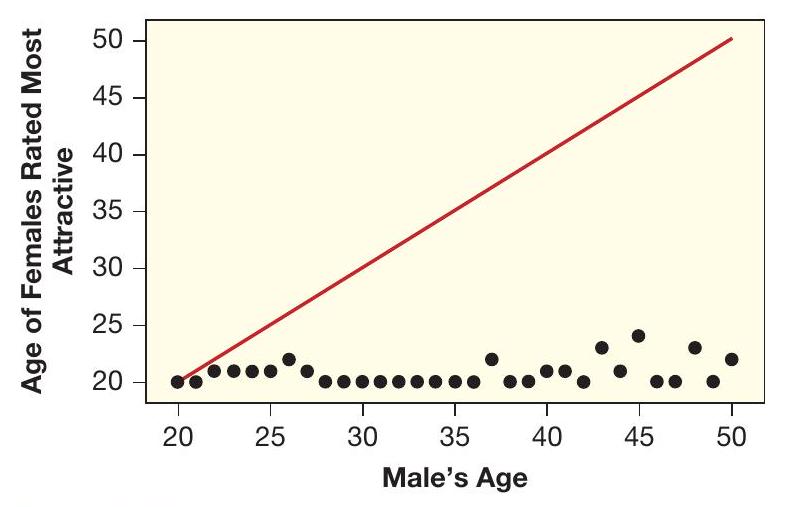
Females Rating Males on OKCupid The OKCupid dating site provides lots of very interesting data. Figure 2.61 shows a scatterplot of the age of males that females find most attractive, based on the age of the females doing the rating. The $X$ variable is the age of heterosexual females using the
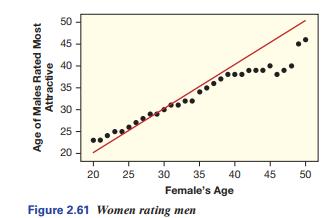
Males Rating Females on OKCupid Exercise 2.188 introduced data showing the age of males that females find most attractive, based on the age of the females doing the rating. Here we examine the ratings males give for females. Figure 2.62 shows a scatterplot of the age of females that males find most
Use technology to find the regression line to predict $Y$ from $X$.$X$35276$Y$121.532.5
Use technology to find the regression line to predict $Y$ from $X$.$X$24681012$Y$505855616968
Football and Cognitive Percentile Exercise 2.143 on page 102 introduces a study that examines several variables on collegiate football players, including the variable Years, which is number of years playing football, and the variable Cognition, which gives percentile on a cognitive reaction test.
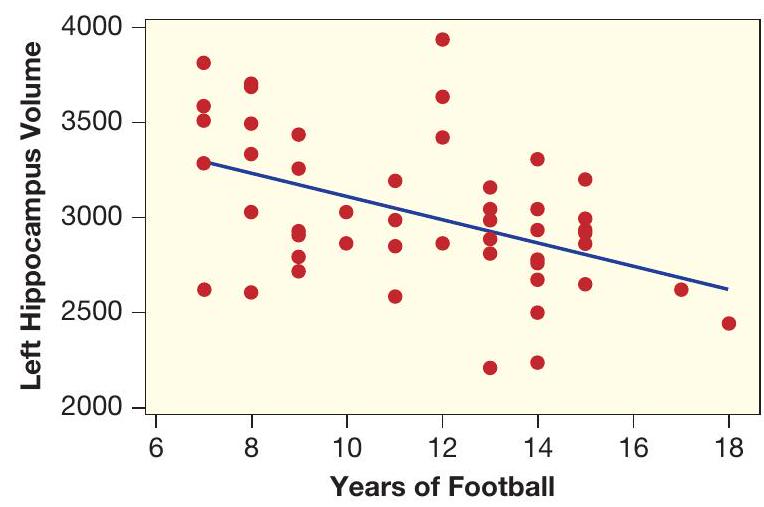
Football and Brain Size Exercise 2.143 on page 102 introduces a study that examines several variables on collegiate football players, including the variable Years, which is number of years playing football, and the variable BrainSize, which is volume of the left hippocampus in the brain measured in
The Honeybee dataset contains data collected from the USDA on the estimated number of honeybee colonies (in thousands) for the years 1995 through 2012. We use technology to find that a regression line to predict number of (thousand) colonies from year (in calendar year) is\[\widehat{\text {
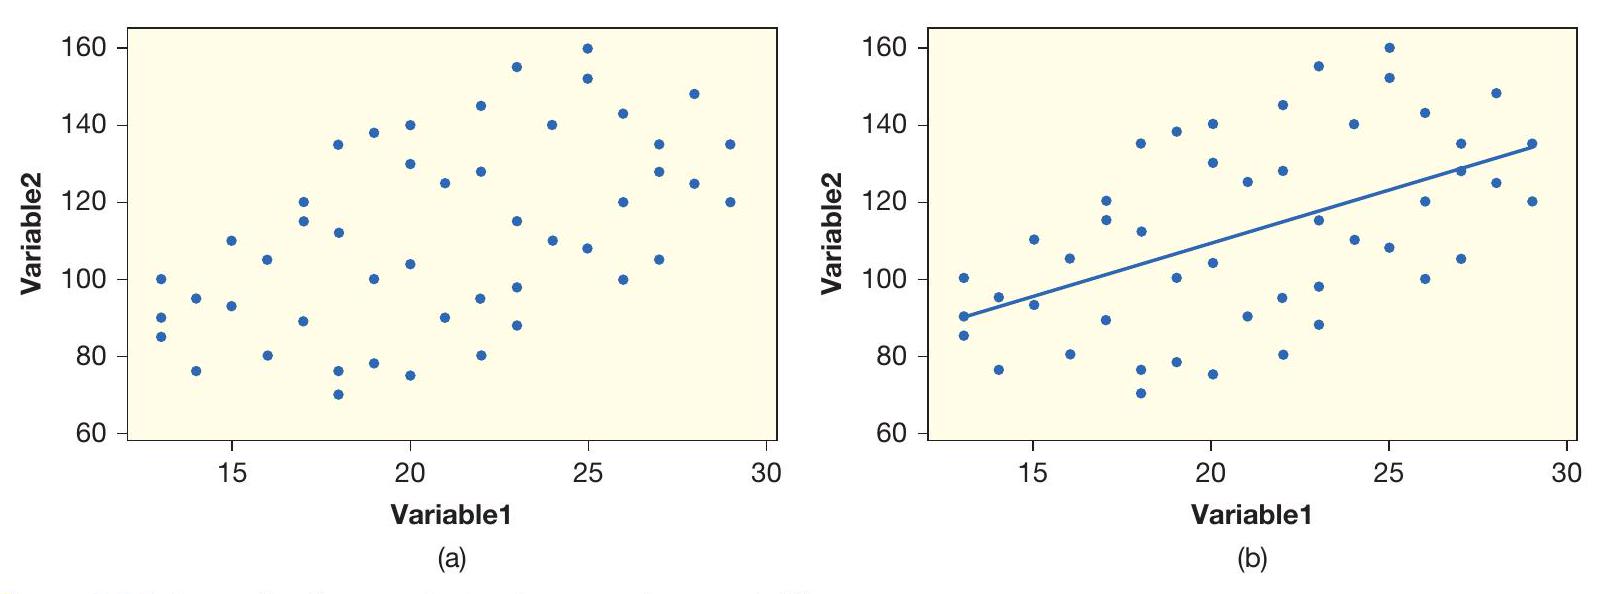
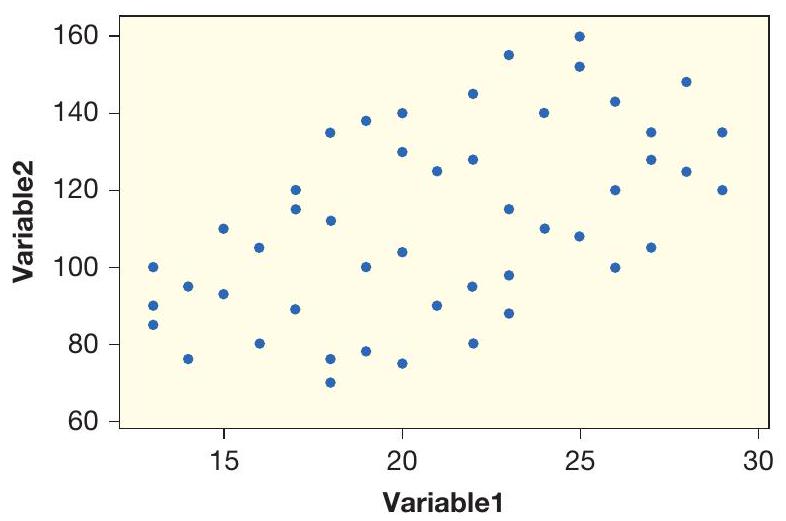
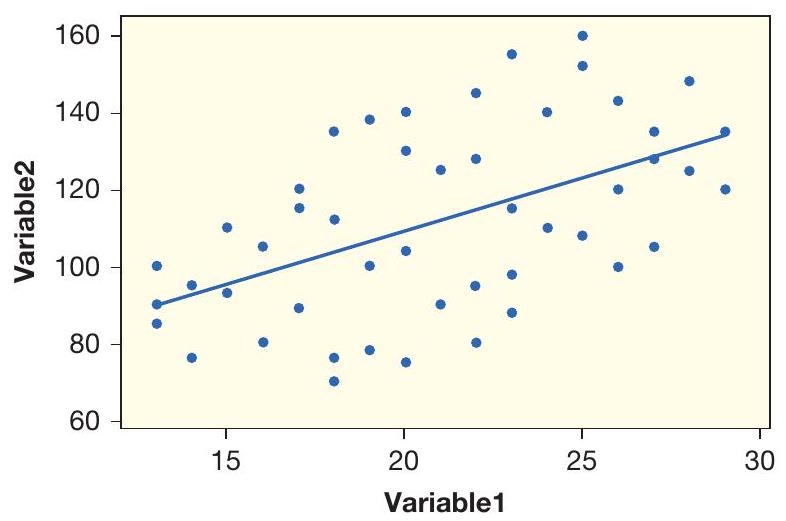
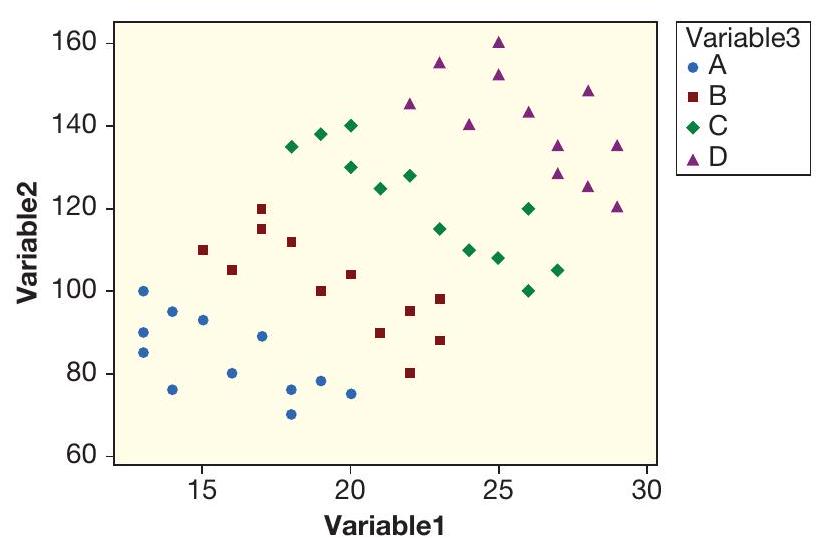
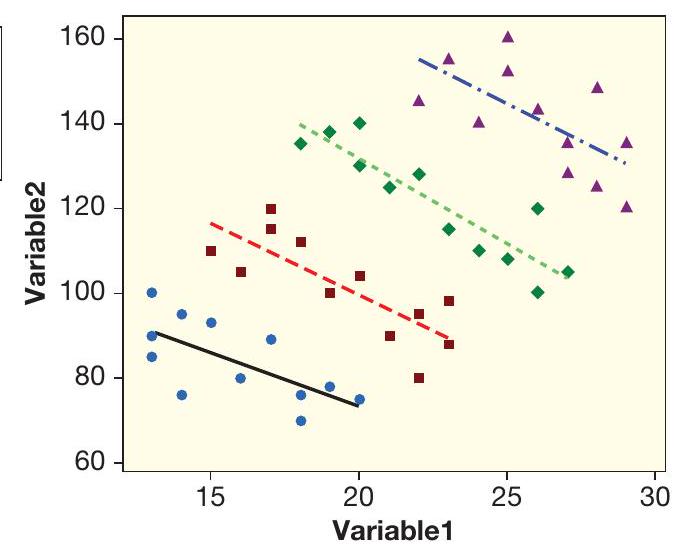
(a) How many variables are included in the scatterplot in Figure 2.84(a)? Identify each as categorical or quantitative. Estimate the range for Variable1 and for Variable2.(b) In Figure 2.84(a), does the association between the variables appear to be positive or negative?(c) Figure 2.84 (b) shows
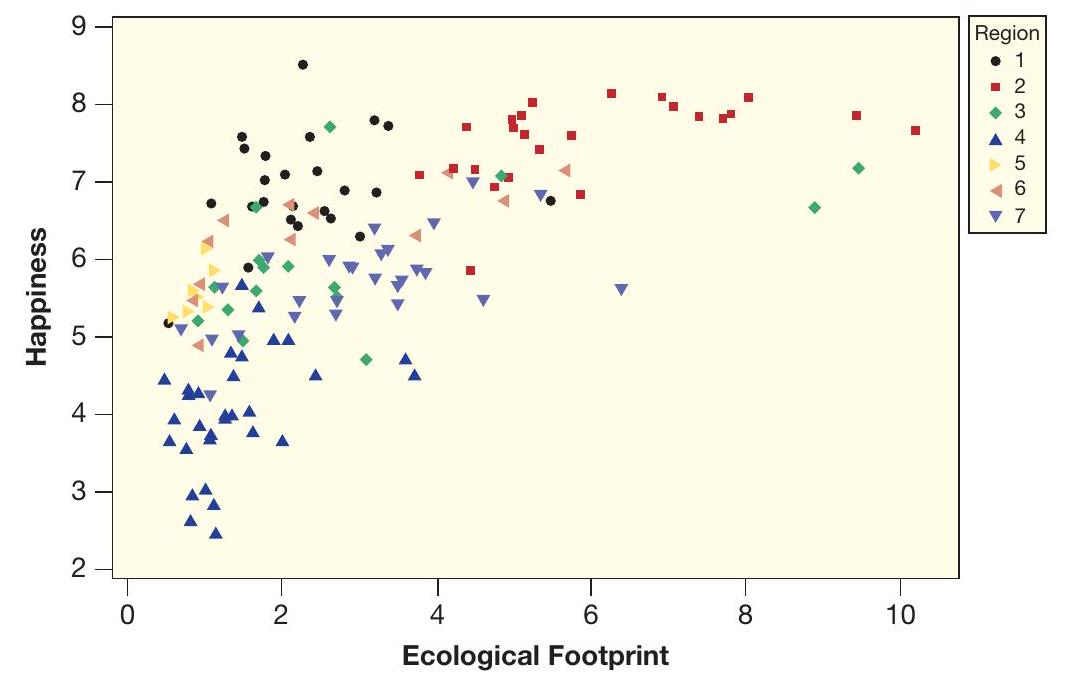
Figure 2.86 shows a scatterplot illustrating three different variables from the dataset HappyPlanetIndex. The variable Happiness is a measure of the well-being of a country, with larger numbers indicating greater happiness, health, and well-being. The variable Footprint is a per capita measure of
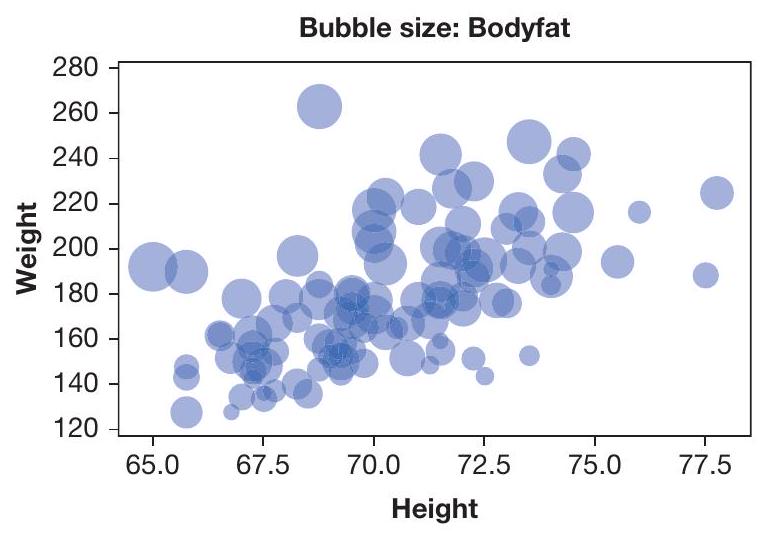
Height, Weight, and BodyFat Figure 2.87 shows a bubble plot of height, weight, and body fat percentage for a sample of $100 \mathrm{men}$, from the dataset BodyFat. The body fat percentage is indicated by the size of the bubble for each case.(a) How many variables are shown in the scatterplot?
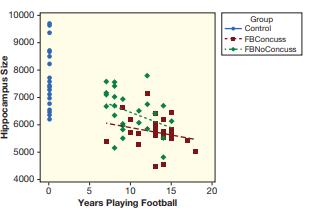
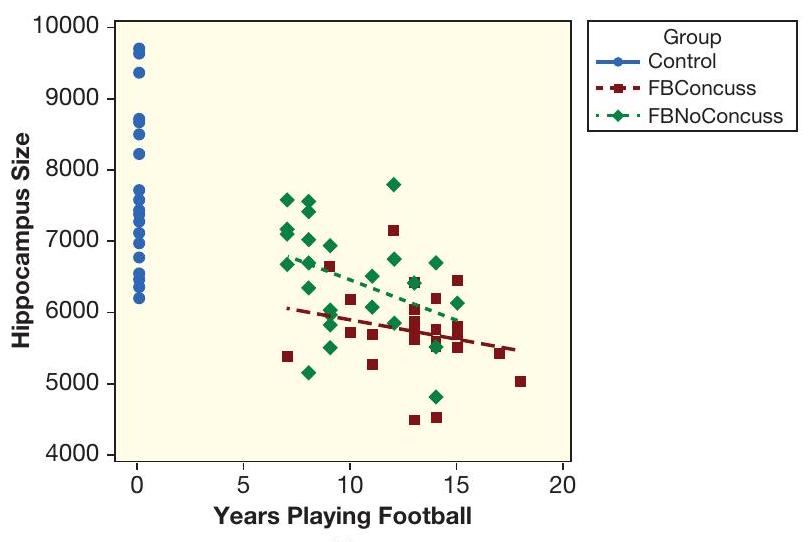
Visualizing Football and Brain Size Exercise 2.143 introduces a study in which the number of years playing football and the size of the hippocampus in the brain were recorded for each person in the study. There were three different groups in the study: football players who had been diagnosed with
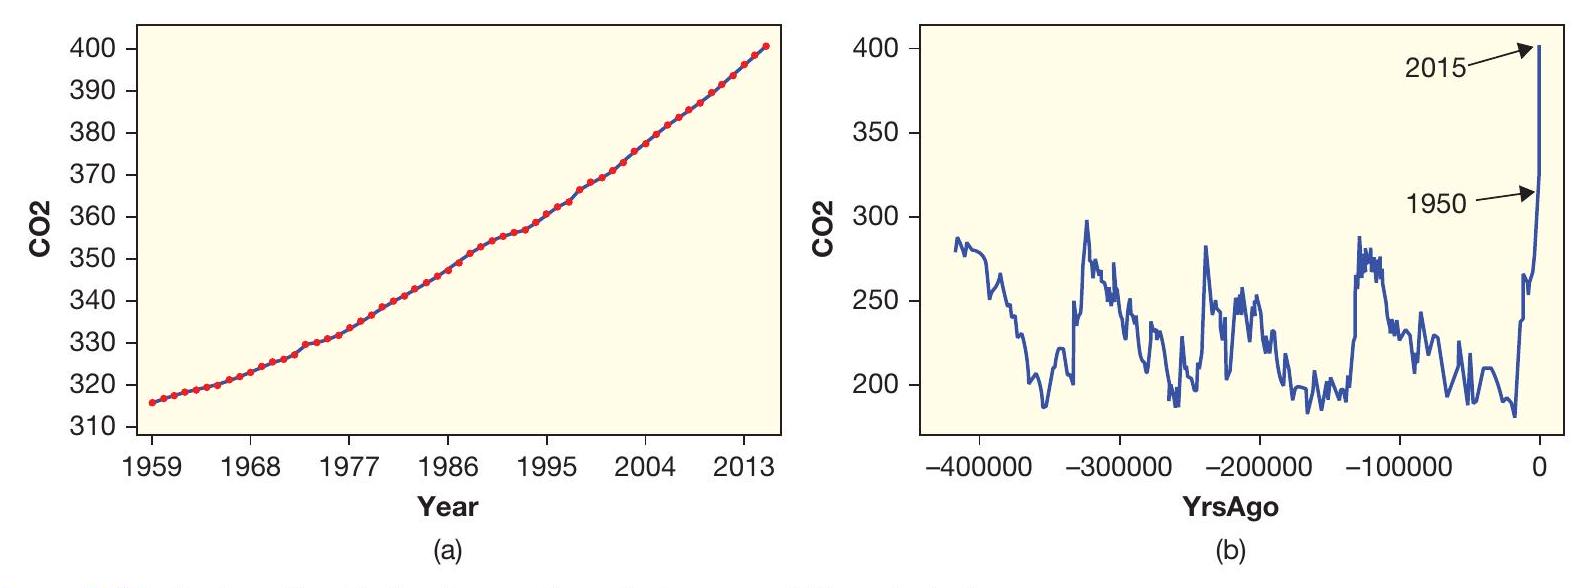
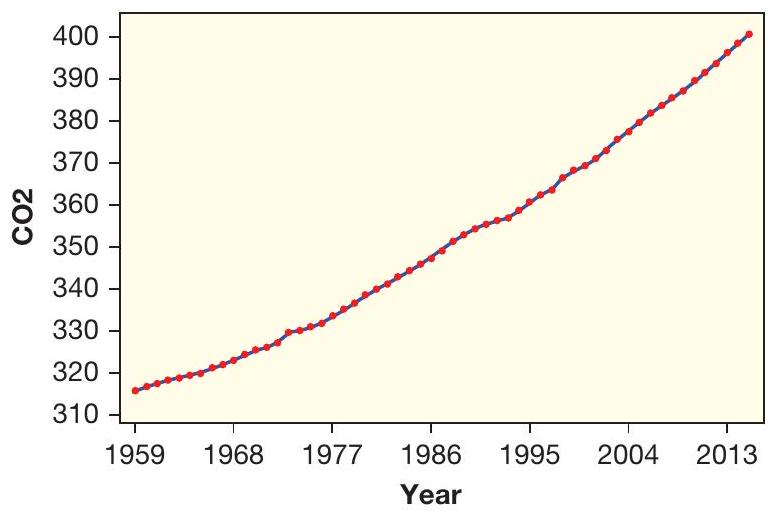
Carbon Dioxide Levels Over Time Scientists are concerned about global warming and the effect of carbon dioxide emissions on the atmosphere. Figure 2.89 shows the concentration of carbon dioxide $(\mathrm{CO} 2)$ in the atmosphere, in parts per million (ppm), over two different time intervals.
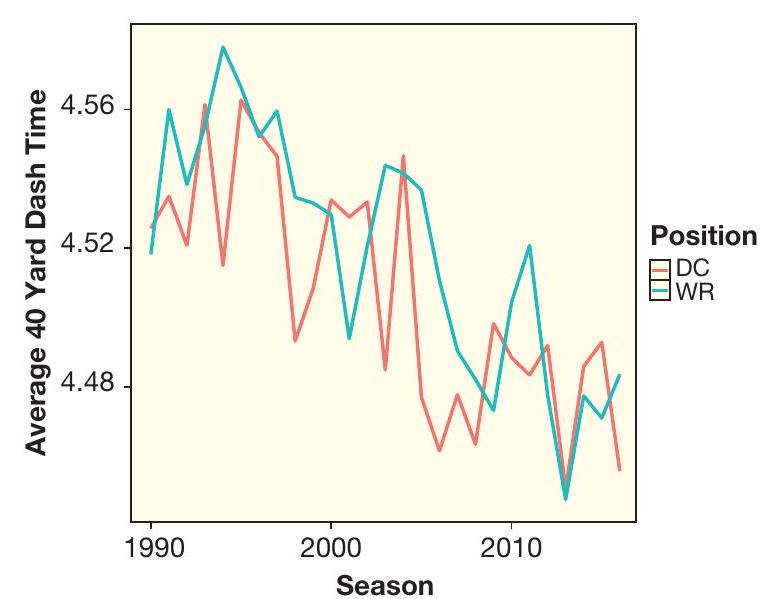
Every year the National Football League invites 335 draft eligible college football players to a scouting combine where they participate in a variety of drills and exercises. One of the more popular drills, called the 40 -yard dash, is the time it takes each player to run 40 -yards. We computed the
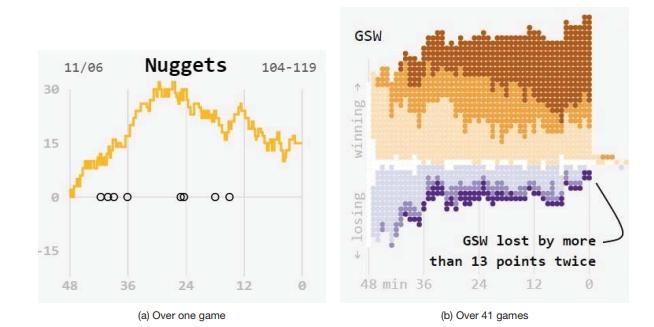
Golden State Warriors: One Game During a record breaking season the Golden State Warriors of the National Basketball Association (NBA) won 24 straight games to start the 2015-2016 season. Adam Pearce plotted the point differential, Golden State points - Opponent points, each minute of the first 16
Exercise 2.229 plotted the Golden State Warriors point differential, Golden State points - Opponent points, each minute of one game during their record breaking 2015-2016 season. Adam Pearce of roadtolarissa.com also plotted the game state (winning or losing or tied) every minute of every game over
Using the Gapminder software (https://www.gapminder .org/tools), set the vertical axis to Age at 1st marriage (women) and the horizontal axis to Babies per woman. This scatterplot shows the mean age at which woman marry, and the mean number of children they have, for various countries. Click the
Showing 7800 - 7900
of 8575
First
72
73
74
75
76
77
78
79
80
81
82
83
84
85
86
Step by Step Answers