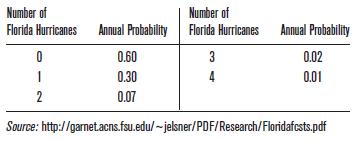
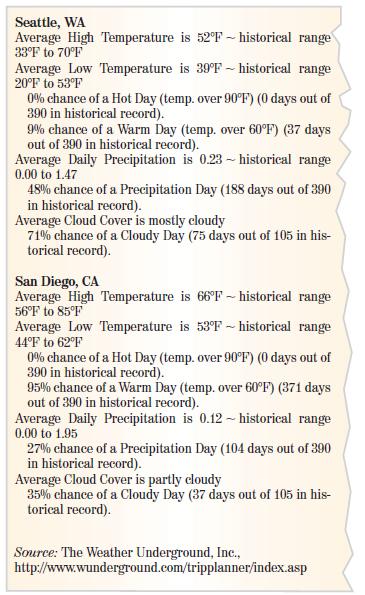
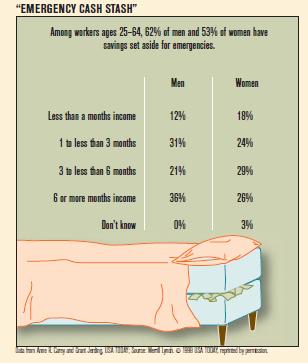
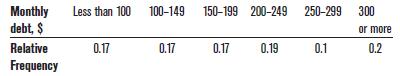
All Matches
Solution Library
Expert Answer
Textbooks
Search Textbook questions, tutors and Books
Oops, something went wrong!
Change your search query and then try again
Toggle navigation
FREE Trial
S
Books
FREE
Tutors
Study Help
Expert Questions
Accounting
General Management
Mathematics
Finance
Organizational Behaviour
Law
Physics
Operating System
Management Leadership
Sociology
Programming
Marketing
Database
Computer Network
Economics
Textbooks Solutions
Accounting
Managerial Accounting
Management Leadership
Cost Accounting
Statistics
Business Law
Corporate Finance
Finance
Economics
Auditing
Ask a Question
Search
Search
Sign In
Register
study help
business
elementary statistics
Questions and Answers of
Elementary Statistics
A simple random sample of 300 voters was polled several months before a presidential election. One of the questions asked was: ‘‘Are you satisfied with the choice of candidates for
Eighteen concrete blocks were sampled and tested for crushing strength in order to estimate the proportion that were sufficiently strong for a certain application. Sixteen of the 18 blocks were
During an economic downturn, 20 companies were sampled and asked whether they were planning to increase their workforce. Only 3 of the 20 companies were planning to increase their workforce. Use the
A sample of voters in a certain city was asked whether they planned to vote for the incumbent mayor in the next election. The following display from a TI-84 Plus calculator presents a 99% confidence
A sample of employed people was asked whether they had changed jobs in the past two years.The following display from a TI-84 Plus calculator presents a 95% confidence interval for the population
A sample of drivers was asked whether they regularly use seat belts. The following MINITAB output presents a confidence interval for the population proportion who regularly use seat belts.a. Fill in
A football game starts with the toss of a coin to determine which team will get the ball first.Before the game, the referee tosses the coin a number of times and records the number of times the coin
The United States Senate consists of 100 senators. In January 2017, 21 of them were women. Explain why these data should not be used to construct a 95% confidence interval for the proportion of
At the end of a television documentary on the nature of government, viewers are invited to tweet an answer to the question, ‘‘Do you believe that women are more effective at governing than men
In a certain high school, 9 out of 15 tenth graders said they planned to go to college after graduating.Construct a 95% confidence interval for the proportion of tenth graders who plan to attend
Refer to Exercise 41.a. Which of the three confidence intervals is the narrowest?b. Does the small-sample method provide a good approximation to Wilson’s interval in this case?c. Explain why the
The small-sample method is a good approximation to Wilson’s method for all confidence levels commonly used in practice, but is best when zα∕2 is close to 2. Refer to Exercise 41.a. Use
Find the critical values for a 95% confidence interval using the chi-square distribution with 18 degrees of freedom.
Find the critical values for a 99% confidence interval using the chi-square distribution with 25 degrees of freedom.
Construct a 95% confidence interval for the population standard deviation σ if a sample of size 10 has standard deviation s = 6.
Construct a 99% confidence interval for the population standard deviation σ if a sample of size 23 has standard deviation s = 12.
To find a confidence interval for a standard deviation from a sample of size 15, we use a chi-square distribution with ____________ degrees of freedom.In Exercises 5 and 6, fill in each blank with
The method described for finding confidence intervals should be used only when the distribution of the population is almost exactly _________________ .In Exercises 5 and 6, fill in each blank with
When constructing a confidence interval for a standard deviation, we must find two critical values.In Exercises 7 and 8, determine whether the statement is true or false. If the statement is false,
If we have a confidence interval for a variance, we can obtain a confidence interval for the standard deviation by squaring the confidence bounds.In Exercises 7 and 8, determine whether the statement
Find the critical values for a 95% confidence interval using the chi-square distribution with 15 degrees of freedom.
Find the critical values for a 99% confidence interval using the chi-square distribution with 5 degrees of freedom.
Construct a 95% confidence interval for the population standard deviation σ if a sample of size 25 has standard deviation s = 15.
Scores on the math SAT are normally distributed.A sample of 20 SAT scores had standard deviation s = 87.a. Construct a 98% confidence interval for the population standard deviation σ.b. Someone says
Scores on an IQ test are normally distributed. A sample of 25 IQ scores had standard deviation s = 8.a. Construct a 95% confidence interval for the population standard deviation σ.b. The developer
Following are weights of 12 two-month-old baby girls. Assume that the population is normally distributed.a. Find the sample standard deviation s.b. Construct a 95% confidence interval for the
Boxes of cereal are labeled as containing 14 ounces. Following are the weights of a sample of 12 boxes.Assume that the population is normally distributed.a. Find the sample standard deviation s.b.
Six measurements were made of the mineral content (in percent) of spinach, with the following results.Assume that the population is normally distributed.a. Find the sample standard deviation s.b.
Following are interest rates (annual percentage rates) for a 30-year fixed rate mortgage from a sample of lenders in Macon, Georgia on a recent day. It is reasonable to assume that the population is
A sample of size 101 from a normal population has sample standard deviation s = 40.Use Table A.4 to find the exact critical values X2 0.025 and X2 0.975 for a 95% confidence interval, and construct a
Refer to Exercise 19.Use the normal approximation to estimate the critical values X2 0.025 and X2 0.975 for a 95% confidence interval, and construct a 95% confidence interval for σ.The chi-square
How close is the confidence interval based on the normal approximation constructed in Exercise 20 to the exact confidence interval constructed in Exercise 19?The chi-square distribution is skewed,
Refer to Exercise 19.Use the more accurate normal approximation to estimate the critical values X2 0.025 and X2 0.975 for a 95% confidence interval, and construct a 95% confidence interval for σ.A
How close is the confidence interval based on the more accurate normal approximation to the exact one?A more accurate normal approximation to X2 α is given bywhere zα is the z-score that has area
A simple random sample of size 15 has mean x̄ = 10.34 and standard deviation s = 3.48. The population is normally distributed. Construct a 95% confidence interval for the population standard
A simple random sample of size 80 has mean x̄ = 7.31. The population standard deviation is σ = 6.26. Construct a 99% confidence interval for the population mean.In Exercises 1–4, state which type
In a simple random sample of 100 children, 22 had reading skills above their grade level. Construct a 99% confidence interval for the proportion of children who have reading skills above their grade
A simple random sample of size 25 has mean x̄ = 17.4 and standard deviation s = 5.3. The population is approximately normally distributed. Construct a 95%confidence interval for the population
A simple random sample of size 18 has mean x̄ = 71.32 and standard deviation s = 15.78. The population is approximately normally distributed. Construct a 95% confidence interval for the population
In a simple random sample of 400 voters, 220 said that they were planning to vote for the incumbent mayor in the next election. Construct a 99% confidence interval for the proportion of voters who
A simple random sample of size 8 has mean x̄ = 3.21 and standard deviation s = 1.69. The population is normally distributed. Construct a 99% confidence interval for the population standard
A simple random sample of size 12 has mean x̄ = 3.37. The population standard deviation is σ = 1.62. The population is approximately normally distributed. Construct a 95%confidence interval for the
In a survey of 250 employed adults, 185 said that they had missed one or more days of work in the past six months.Construct a 95% confidence interval for the proportion of employed adults who missed
A simple random sample of size 17 has mean x̄ = 8.44 and standard deviation s = 5.38. The population is normally distributed. Construct a 95% confidence interval for the population standard
A simple random sample of size 120 has mean x̄ = 8.45. The population standard deviation is σ = 4.81. Construct a 99%confidence interval for the population mean.In Exercises 5–12, state which
A simple random sample of size 23 has mean x̄ = 1.48 and standard deviation s = 1.32. The population is approximately normally distributed. Construct a 99% confidence interval for the population
The weights of 52 randomly selected NFL football players are presented below. The sample mean is x̄ = 248.38 and the sample standard deviation is s = 46.68.Construct a 95% confidence interval for
A simple random sample of 100 U.S.college students had a mean age of 22.68 years. Assume the population standard deviation is σ = 4.74 years. Construct a 99% confidence interval for the mean age of
Following are the numbers of calories in a random sample of 10 slices of bread. Assume the population is normally distributed.Construct a 95% confidence interval for the standard deviation of the
In a survey of 1118 U.S. adults conducted by the Financial Industry Regulatory Authority, 626 said they always pay their credit cards in full each month. Construct a 95% confidence interval for the
Mt. Washington, New Hampshire, is one of the windiest places in the United States. Wind speed measurements on a simple random sample of 50 days had a sample mean of 45.01 mph. Assume the population
Following are the numbers of grams of sugar per 100 grams of apple in a random sample of six Red Delicious apples. Assume the population is normally distributed.Construct a 95% confidence interval
In a simple random sample of 1500 patients admitted to the hospital with pneumonia, 145 were under the age of 18.Construct a 99% confidence interval for the proportion of pneumonia patients who are
A simple random sample of 35 colleges and universities in the United States had a mean tuition of \($18,702\) with a standard deviation of \($10,653\). Construct a 95%confidence interval for the mean
Define the following terms:a. Point estimateb. Confidence intervalc. Confidence level
Find the critical value tα∕2 needed to construct a 90% confidence interval for a population mean with sample size 27.
An owner of a fleet of taxis wants to estimate the mean gas mileage, in miles per gallon, of the cars in the fleet. A random sample of 40 cars is followed for one month, and the sample mean gas
Construct a 95% confidence interval for the population standard deviation σ if a sample of size 20 has standard deviation s = 10.
A cookie manufacturer wants to estimate the length of time that her boxes of cookies spend in the store before they are bought. She visits a sample of 15 supermarkets and determines the number of
A person selects a random sample of 15 credit cards and determines the annual interest rate, in percent, of each. The sample mean is 12.42 with a sample standard deviation of 1.3. Construct a 95%
Construct a 90% confidence interval for the population standard deviation σ if a sample of size 6 has standard deviation s = 22.
Find the critical value zα∕2 needed to construct a confidence interval for a population proportion with confidence level 92%.
Find the critical values for a 98% confidence interval using the chi-square distribution with 18 degrees of freedom.
The amount of time that a certain cell phone will keep a charge is known to be normally distributed with standard deviationσ = 16 hours. A sample of 40 cell phones had a mean time of 141 hours. Let
Refer to Exercise 10.Suppose that a 95% confidence interval is to be constructed for the mean time.a. What is the critical value?b. What is the margin of error?c. Construct the 95% confidence
Refer to Exercise 10.What sample size is necessary so that a 95% confidence interval will have a margin of error of 1 hour?Exercise 10The amount of time that a certain cell phone will keep a charge
In a survey of 802 U.S. adult drivers, 265 state that traffic is getting worse in their community. Construct a 99%confidence interval for the proportion of adult drivers who think that traffic is
Refer to Exercise 13.How large a sample is needed so that a 99% confidence interval will have margin of error of 0.08, using the sample proportion for p̂ ?Exercise 13 In a survey of 802 U.S. adult
Refer to Exercise 13.How large a sample is needed so that a 99% confidence interval will have margin of error of 0.08, assuming no estimate of p̂ is available?Exercise 13 In a survey of 802 U.S.
A meteorology student examines precipitation records for a certain city and discovers that of the last 365 days, it rained on 46 of them. Explain why these data cannot be used to construct a
When constructing a confidence interval for μ when σ is known, we assume that we have a simple random sample, that σis known, and that either the sample size is large or the population is
What factors can you think of that may affect the width of a confidence interval? In what way does each factor affect the width?
Explain the difference between confidence and probability.
According to a survey of 1000 American adults, 55% of Americans do not have a will specifying the handling of their estate. The survey’s margin of error was plus or minus 3%.In Exercises 4 and 5,
In a survey of 5050 U.S. adults, 29% would consider traveling abroad for medical care because of medical costs. The survey’s margin of error was plus or minus 2%.In Exercises 4 and 5, express the
When constructing a confidence interval for μ, how do you decide whether to use the t distribution or the normal distribution? Are there any circumstances when it is acceptable to use either
It is stated in the text that there are many different t distributions. Explain how this is so.In Exercises 4 and 5, express the following survey results in terms of confidence intervals for p:
The town of Libby, Montana, has experienced high levels of air pollution in the winter because many of the houses in Libby are heated by wood stoves that produce a lot of pollution. In an attempt to
Last year, the mean amount spent by customers at a certain restaurant was $35. The restaurant owner believes that the mean may be higher this year. State the appropriate null and alternate hypotheses.
In a recent year, the mean weight of newborn boys in a certain country was 6.6 pounds. A doctor wants to know whether the mean weight of newborn girls differs from this. State the appropriate null
A certain model of car can be ordered with either a large or small engine. The mean number of miles per gallon for cars with a small engine is 25.5. An automotive engineer thinks that the mean for
A test is made of H0 : μ = 100 versus H1: μ ≠ 100.The true value of μ is 150, and H0 is rejected. Is this a Type I error, a Type II error, or a correct decision?
A test is made of H0 : μ = 18 versus H1: μ > 18.The true value of μ is 20, and H0 is not rejected. Is this a Type I error, a Type II error, or a correct decision?
A test is made of H0 : μ = 3 versus H1: μ < 3.The true value of μ is 3, and H0 is rejected. Is this a Type I error, a Type II error, or a correct decision?
The _______________ hypothesis states that a parameter is equal to a certain value while the __________________ hypothesis states that the parameter differs from this value.In Exercises 7 and 8, fill
Rejecting H0 when it is true is called a __________________ error, and failing to reject H0 when it is false is called a _______________ error.In Exercises 7 and 8, fill in each blank with the
H1: μ > 50 is an example of a left-tailed alternate hypothesis.In Exercises 9–12, determine whether the statement is true or false. If the statement is false, rewrite it as a true statement.
If we reject H0, we conclude that H0 is false.In Exercises 9–12, determine whether the statement is true or false. If the statement is false, rewrite it as a true statement.
If we do not reject H0, then we conclude that H1 is false.In Exercises 9–12, determine whether the statement is true or false. If the statement is false, rewrite it as a true statement.
If we do not reject H0, we conclude that H0 is true.In Exercises 9–12, determine whether the statement is true or false. If the statement is false, rewrite it as a true statement.
H0: μ = 5 H1: μ < 5 In Exercises 13–16, determine whether the alternate hypothesis is left-tailed, right-tailed, or two-tailed.
H0: μ = 10 H1: μ > 10 In Exercises 13–16, determine whether the alternate hypothesis is left-tailed, right-tailed, or two-tailed.
H0: μ = 1 H1: μ ≠ 1 In Exercises 13–16, determine whether the alternate hypothesis is left-tailed, right-tailed, or two-tailed.
H0: μ = 26 H1: μ ≠ 26 In Exercises 13–16, determine whether the alternate hypothesis is left-tailed, right-tailed, or two-tailed.
A test is made of H0: μ = 20 versus H1: μ ≠ 20.The true value of μ is 25, and H0 is rejected.In Exercises 17–20, determine whether the outcome is a Type I error, a Type II error, or a correct
A test is made of H0: μ = 5 versus H1: μ < 5.The true value of???? is 5, and H0 is rejected.In Exercises 17–20, determine whether the outcome is a Type I error, a Type II error, or a correct
A test is made of H0: μ = 63 versus H1: μ > 63.The true value of μ is 75, and H0 is not rejected.In Exercises 17–20, determine whether the outcome is a Type I error, a Type II error, or a
A test is made of H0: μ = 45 versus H1: μ < 45.The true value of μ is 40, and H0 is rejected.In Exercises 17–20, determine whether the outcome is a Type I error, a Type II error, or a correct
A new type of fertilizer is being tested on a plot of land in an orange grove, to see whether it increases the amount of fruit produced. The mean number of pounds of fruit on this plot of land with
A sample of 100 flounder of a certain species have sample mean weight 21.5 grams. Scientists want to perform a hypothesis test to determine how strong the evidence is that the mean weight differs
Showing 200 - 300
of 2069
1
2
3
4
5
6
7
8
9
10
11
12
13
14
15
Last