New Semester
Started
Get
50% OFF
Study Help!
--h --m --s
Claim Now
Question Answers
Textbooks
Find textbooks, questions and answers
Oops, something went wrong!
Change your search query and then try again
S
Books
FREE
Study Help
Expert Questions
Accounting
General Management
Mathematics
Finance
Organizational Behaviour
Law
Physics
Operating System
Management Leadership
Sociology
Programming
Marketing
Database
Computer Network
Economics
Textbooks Solutions
Accounting
Managerial Accounting
Management Leadership
Cost Accounting
Statistics
Business Law
Corporate Finance
Finance
Economics
Auditing
Tutors
Online Tutors
Find a Tutor
Hire a Tutor
Become a Tutor
AI Tutor
AI Study Planner
NEW
Sell Books
Search
Search
Sign In
Register
study help
business
introduction to probability statistics
Introduction To Probability And Statistics 3rd Edition William Mendenhall - Solutions
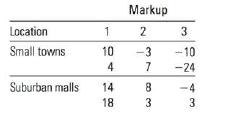
11.47 Demand for Diamonds A chain of jewellery stores conducted an experiment to investigate the effect of price and location on the demand for its diamonds. Six small-town stores were selected for the study, as well as six stores located in large suburban malls. Two stores in each of these
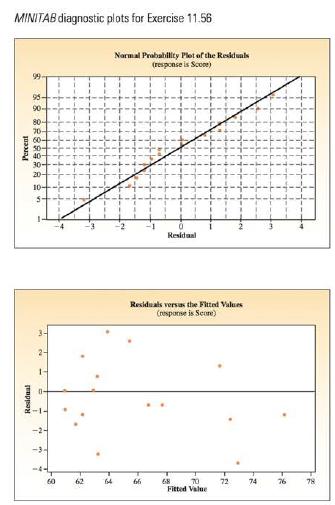
11.56 Refer to Exercise 11.54. What do the normal probability plot and the residuals versus fit plot tell you about the validity of your analysis of variance results? Residual MINITAB diagnostic plots for Exercise 11.56 99- Normal Probability Plot of the Residuals (response is Score) 95- 90- 80-
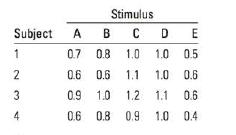
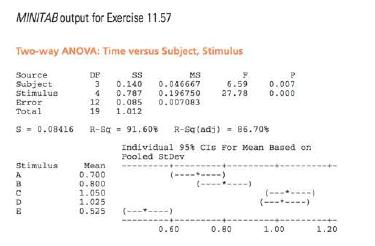
11.57 Reaction Times II The experiment in Exercise 11.54 might have been conducted more effectively using a randomized block design with people as blocks, since you would expect mean reac- tion time to vary from one person to another. Hence, four people were used in a new experiment, and each
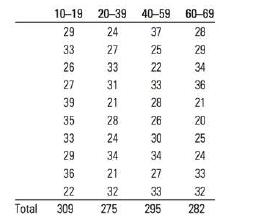
11.58 Heart Rate and Exercise An experiment was conducted to examine the effect of age on heart rate when a person is subjected to a specific amount of exercise. Ten male subjects were randomly selected from four age groups: 10-19, 20-39, 40-59, and 60-69. Each subject walked on a treadmill at a
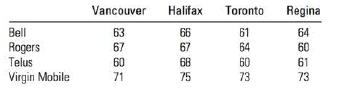
11.71 Cell Phones How satisfied are you set with your current cell phone service provider? Surveys indicate that there is a high level of dissatis- faction among consumers, resulting in high customer turnover rates. The table shows the overall satisfaction scores, based on a maximum score of 100,
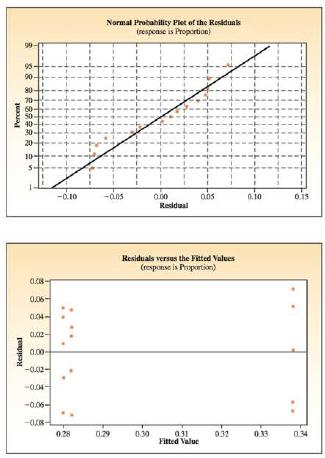
11.72 Cell Phones, continued Refer to Exercise 11.71. The diagnostic plots for this experiment are shown below. Does it appear that any of the analysis of variance assumptions have been violated? Explain. Residual 0.08- 0.06- CL04- -200 0.00- 99 95- 90 80 70 60- 50 40 30 Percent 20- 10 Normal
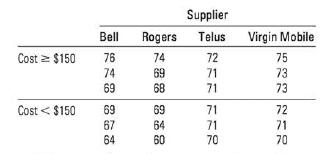
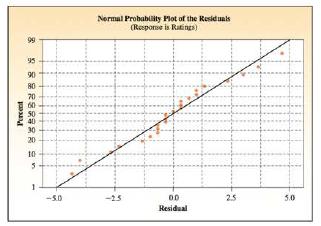
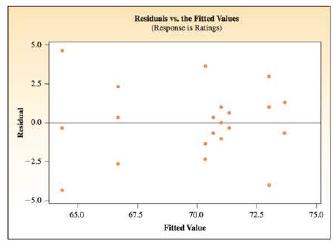
11.73 Smart Phones A smart phone is a cell phone that offers more advanced com- puting ability and connectivity than a contemporary basic "feature phone." The data that follow are the ratings for six smart phones from each of the four suppliers, three of which cost $150 or more and three of which
11.74 Smart Phones, continued Refer to Exercise 11.73. The diagnostic plots for this experiment are shown below. Does it appear that any of the analysis of variance assumptions have been violated? Explain. Percent 99 Normal Probability Plot of the Residuals (Response is Ratings) 95 90 80 70 60 50
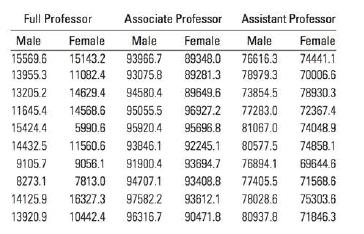
11.75 Professor's Salaries II Each year, Statstics Canada reports on salaries of academic professors at universities and colleges in Canada. The following data (in dollars), adapted from this report, are based on samples of n = 10 in each of three professorial ranks, for both male and female
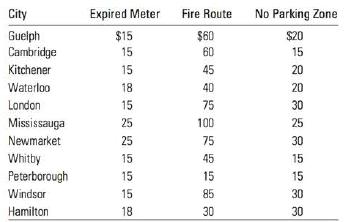
1. Identify the design used for the data collection in this case study.Do you risk a parking ticket by parking where you shouldn't or forgetting how much time you have left on the parking meter? Do the fines associated with various parking infractions vary depending on the city in which you receive
2. Analyze the data using the appropriate analysis. What can you say about the varia- tion among the cities in this study? Among fines for the three types of violations? Can Tukey's procedure be of use in further delineating any significant differences you may find? Would confidence interval
3. Summarize the results of your analysis of these data.Do you risk a parking ticket by parking where you shouldn't or forgetting how much time you have left on the parking meter? Do the fines associated with various parking infractions vary depending on the city in which you receive a parking
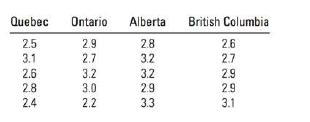
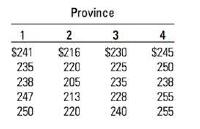
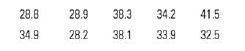
a. A group of researchers were interested in comparing salt intake among four Cana- dian provinces. Five people were randomly selected from each of the four provinces and their sodium intake was measured in grams in a given day. The sample data is given in the following table.Each day, the average
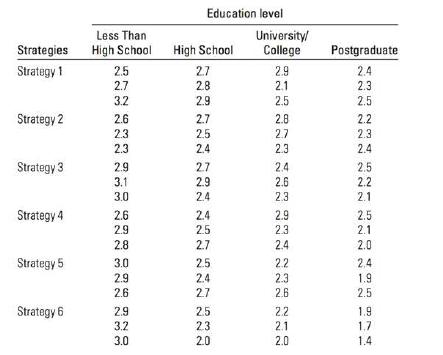
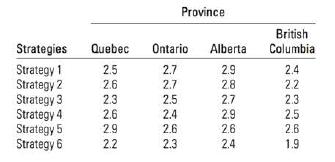
c. A researcher suspects that the effectiveness of the different strategies for lowering the amount of salt intake is affected by the education level of the subjects. There- fore, she used a 6 x 4 factorial design with three replicates in each cell to examine her conjecture. The data is summarized
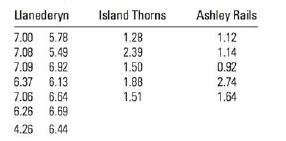
11.70 Pottery in the United Kingdom An article in Archaeometry involved an analysis of 26 samples of Romano-British pottery, found at four different kiln sites in the United Kingdom. Since one site only yielded two samples, consider the samples found at the other three sites. The samples were ana-
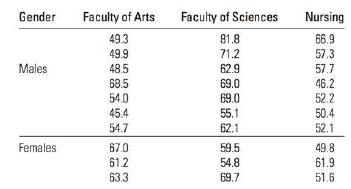
11.69 Professor's Salaries In a study of starting salaries of assistant professors, five male assistant professors and five female assistant professors at each of three types of faculties granting doctoral degrees were polled and their initial starting salaries were recorded. The results of the
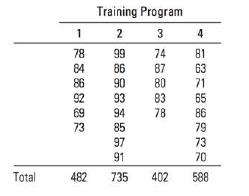
11.59 Learning to Sell A company wished to study the effects of four training programs on the sales abilities of their sales personnel. Thirty-two people were randomly divided into four groups of equal size, and each group was then sub- jected to one of the different sales training programs.
11.60 4 x 2 Factorial Suppose you were to conduct a two-factor factorial experiment, factor A at four levels and factor B at two levels, with r replications per treatment.a. How many treatments are involved in the experiment?b. How many observations are involved?c. List the sources of variation and
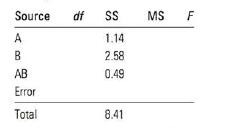
11.61 2 x 3 Factorial The analysis of variance table for a 2 3 factorial experiment, factor A at two levels and factor B at three levels, with five observa- tions per treatment, is shown in the table. a. Do the data provide sufficient evidence to indicate an interaction between factors A and B?
11.62 Refer to Exercise 11.61. The means of all observations at the factor A levels A1 and A2 are 3.7 and 1.4, respectively. Find a 95% confi- dence interval for the difference in mean response for factor levels A1 and A2.
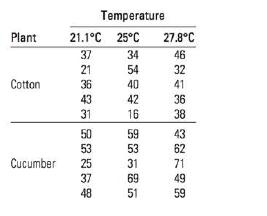
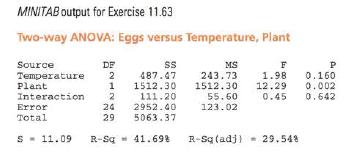
11.63 The Whitefly in British Columbia The whitefly, which causes defoliation of shrubs and trees and a reduction in salable crop yields, has emerged as a pest in British Columbia. In a study to determine factors that affect the life cycle of the whitefly, an experiment was conducted in which
11.64 Pollution from Chemical Plants Four chemical plants, producing the same product and owned by the same company, discharge effluents into streams in the vicinity of their locations . To check on the extent of the pollution created by the effluents and to determine whether this varies from plant
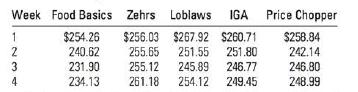
11.65 Canada's Food Basics Exercise 10.42 examined an advertisement for Food Basics, a supermarket chain in Canada. The advertiser claims that Food Basics has consistently had lower prices than four other full-service supermarkets. The average weekly total based on the prices of approximately 95
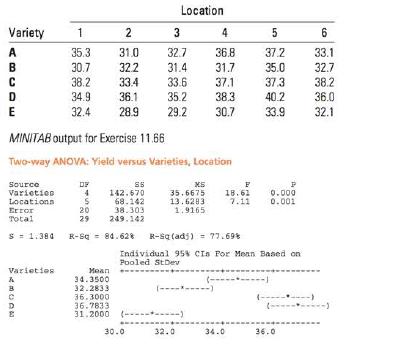
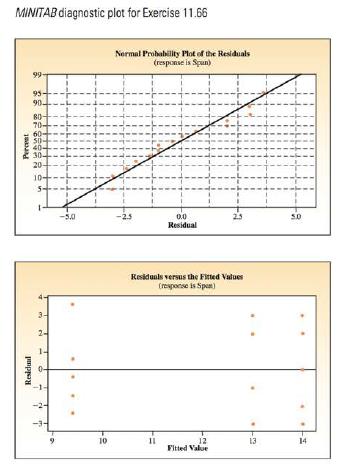
11.66 Yield of Wheat The yields of wheat (in kilogram per hectare) were compared for five different varieties, A, B, C, D, and E, at six dif- ferent locations. Each variety was randomly assigned to a plot at each location. The results of the experiment are shown in the accompanying table, along
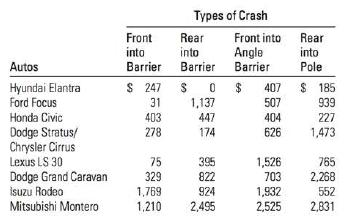
11.67 Crash Tests Information on crash tests conducted by the Insurance Institute for Highway Safety regarding bumper repair costs for damage sustained in front and rear crashes of vehicles into barriers/poles at approximately 8 km/h are given in the following table. These types of crash tests
11.68 Physical Fitness Researchers Russell R. Pate and colleagues analyzed the results of the National Health and Nutrition Examination Survey to assess cardiorespiratory fitness levels in youth aged 12 to 19 years. Estimated maximum oxygen uptake (VO2max) was used to measure a person's
A group of people is randomly divided into an experimental and a control group. The control group is given an aptitude test after having eaten a full breakfast. The experi- mental group is given the same test without having eaten any breakfast. What are the factors, levels, and treatments in this
b. A number of people from the selected provinces were randomized to the above strategies for lowering the salt intake. The data summarized in the following table were collected.Each day, the average Canadian consumes excessive amounts of sodium-an average of 3,100 milligrams-more than double the
11.8 Refer to Exercise 11.7 and data set EX1107. Do the data provide sufficient evidence to indicate a difference between 2 and 3? Test using the test of Section 10.4 with a = 0.05.
11.9 Refer to Exercise 11.7 and data set EX1107.a. Find a 90% confidence interval for .b. Find a 90% confidence interval for the difference (14-13).
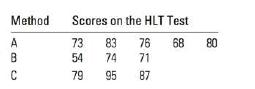
11.10 Reducing Hostility A clinical psychologist wished to compare three methods for reducing hostility levels in university students using a certain psycho- logical test (HLT). High scores on this test were taken to indicate great hostility. Eleven students who got high and nearly equal scores
11.11 Hostility, continued Refer to Exercise 11.10. Let A and B, respectively, denote the mean scores at the end of the semester for the populations of extremely hostile students who were treated throughout that semester by method A and method B.a. Find a 95% confidence interval for A-b. Find a 95%
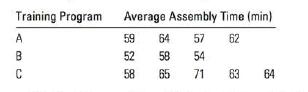
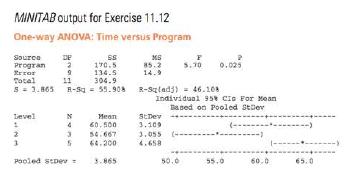
11.12 Assembling Electronic Equipment An experiment was conducted to compare the effectiveness of three training programs, A, B, and C, in training assemblers of a piece of electronic equip- ment. Fifteen employees were randomly assigned, five each, to the three programs. After completion of the
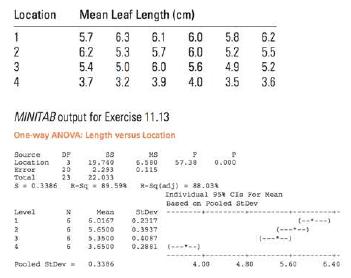
11.13 Swampy Sites An ecological study was conducted to compare the rates of growth of vegetation at four swampy undeveloped sites and to determine the cause of any differences that might be observed. Part of the study involved measuring the leaf lengths of a particular plant species on a
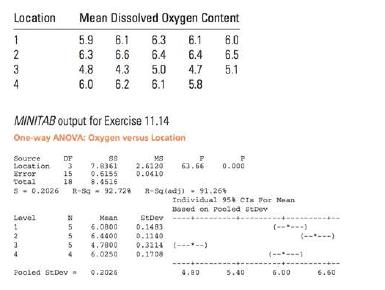
11.14 Dissolved O Content Water samples were taken at four different locations in a river to determine whether the quantity of dissolved oxygen, a measure of water pollution, varied from one location to another. Locations 1 and 2 were selected above an industrial plant, one near the shore and the
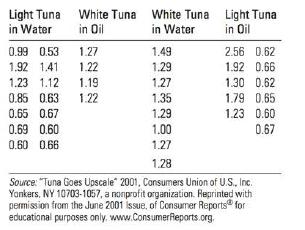
11.16 Tuna Fish In Exercise 10.6, we reported the estimated average prices for a 170-gram can of tuna fish, based on prices paid nationally for a variety of different brands of tuna.a. Use an analysis of variance for a completely ran- domized design to determine if there are significant differences
11.6 The sample means corresponding to populations 1 and 2 in Exercise 11.4 are = 88.0 and x2 = 83.9.a. Find a 90% confidence interval for .b. Find a 90% confidence interval for the difference (11-12).
11.5 The values of Total SS and SST for the experi- ment in Exercise 11.4 are Total SS = 473.2 and SST = 339.8.a. Complete the ANOVA table for Exercise 11.4.b. How many degrees of freedom are associated with the F statistic for testing Ho = = 3 = 14?c. Give the rejection region for the test in part
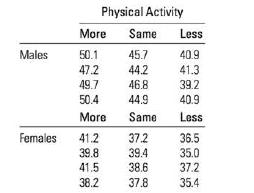
Suppose that the experimenter in Example 11.1 began by randomly selecting 20 men and 20 women for the experiment. These two groups were then randomly divided into 10 each for the experimental and control groups. What are the factors, levels, and treat- ments in this experiment?
A researcher is interested in the effects of five types of insecticides in controlling boll weevils in cotton fields. Explain how to implement a completely randomized design to investigate the effects of the five insecticides on crop yield.
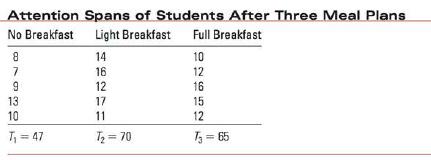
In an experiment to determine the effect of nutrition on the attention spans of elemen- tary school students, a group of 15 students were randomly assigned to each of three meal plans: no breakfast, light breakfast, and full breakfast. Their attention spans (in minutes) were recorded during a
Do the data in Example 11.4 provide sufficient evidence to indicate a difference in the average attention spans depending on the type of breakfast eaten by the student?
The researcher in Example 11.4 believes that students who eat no breakfast will have significantly shorter attention spans, but that there may be no difference between those who eat a light and a full breakfast. Find a 95% confidence interval for the average attention span for students who eat no
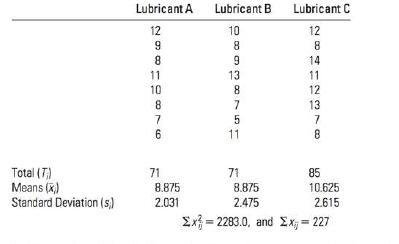
A mechanical engineer at a manufacturing plant in Hamilton, Ontario, keeps a close watch on the performance and condition of the machines, inspecting for wear due to friction. The following data are the weight losses (in milligrams) of certain machine parts due to friction when used with three
11.2 The values of Total SS and SSE for the experiment in Exercise 11.1 are Total SS = 21.4 and SSE=16.2.a. Complete the ANOVA table for Exercise 11.1.b. How many degrees of freedom are associated with the F statistic for testing Ho = ... = pg? Ho =... 146?c. Give the rejection region for the test
11.3 The sample means corresponding to populations 1 and 2 in Exercise 11.1 are = 3.07 and = 2.52.a. Find a 95% confidence interval for .b. Find a 95% confidence interval for the difference (1412).
11.17 The Cost of Lumber A national home builder wants to compare the prices per 2.4 cubic metres board of standard or better grade Douglas fir framing lumber. He randomly selects five suppliers in each of the four provinces where the builder is planning to begin construction. The prices are given
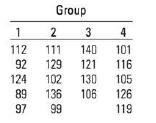
11.18 Good at Math? Twenty third graders were randomly separated into four equal groups, and each group was taught a math- ematical concept using a different teaching method. At the end of the teaching period, progress was measured by a unit test. The scores are shown below (one child in Group 3
Refer to Example 11.4, in which you compared the average attention spans for students given three different "meal" treatments in the morning: no breakfast, a light breakfast, or a full breakfast. The ANOVA F test in Example 11.5 indicated a significant differ- ence in the population means. Use
11.28 A randomized block design was used to com- pare the means of three treatments within six blocks. Construct an ANOVA table showing the sources of variation and their respective degrees of freedom.
11.29 Suppose that the analysis of variance calculations for Exercise 11.28 are SST = 11.4, SSB 17.1, and Total SS = 42.7. Complete the ANOVA table, showing all sums of squares, mean squares, and pertinent F-values.
11.30 Do the data of Exercise 11.28 provide sufficient evidence to indicate differences among the treatment means? Test using a = 0.05.
11.31 Refer to Exercise 11.28. Find a 95% confidence interval for the difference between a pair of treatment means A and B if x = 21.9 and x = 24.2.
11.32 Do the data of Exercise 11.28 provide sufficient evidence to indicate that blocking increased the amount of information in the experiment about the treatment means? Justify your answer.
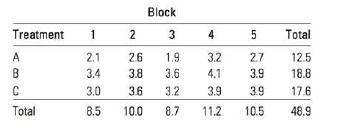
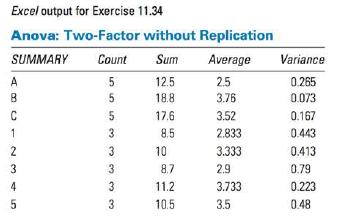
11.34 The data shown here are observations O collected from an experiment that compared three treatments, A, B, and C, within each of five blocks, using a randomized block design:Use the Excel ouput to analyze the experiment. Investi- gate possible differences in the block and/or treatment means
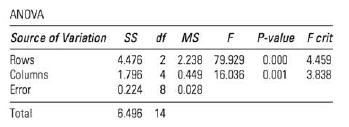
11.36 Fuel Efficiency A study was conducted to compare automobile fuel efficiency for three brands of gasoline, A, B, and C. Four automobiles, all of the same make and model, were used in the experi- ment, and each gasoline brand was tested in each automobile. Using each brand in the same
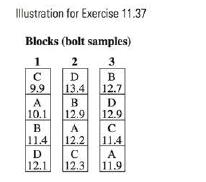
11.37 Water Resistance in Textiles An experiment was conducted to compare the effects of four different chemicals, A, B, C, and D, in producing water resistance in textiles. A strip of material, randomly selected from a bolt, was cut into four pieces, and the four pieces were randomly assigned to
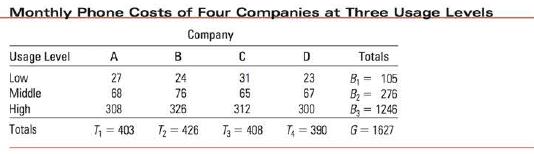
Identify the nature of any differences you found in the average monthly cell phone costs from Example 11.9.
Do the data in Example 11.9 provide sufficient evidence to indicate a difference in the average monthly cell phone cost depending on the company the customer uses?
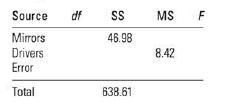
11.38 Glare in Rearview Mirrors An experiment was conducted to compare the glare characteristics of four types of automobile rearview mirrors. Forty driv- ers were randomly selected to participate in the experi- ment. Each driver was exposed to the glare produced by a headlight located 9 metres
11.19 Suppose you wish to use Tukey's method for paired comparisons to rank a set of population means. In addition to the analysis of variance assumptions, what other property must the treatment means satisfy?
11.20 Consult Tables 11(a) and 11(b) in Appendix I and find the values of qa(k, df) for these cases: = =a. a 0.05, k 5, df = 7b. a 0.05, k = 3, df = 10c. a = 0.01, k = 4, df = 8d. a 0.01, k 7, df = 5
11.21 If the sample size for each treatment is n, and if s is based on 12 df, find wo in these cases:a. a = 0.05, k = 4, n = 5 =b. a 0.01, k 6, n,= 8 =
11.22 An independent random sampling design was used to compare the means of six treatments based on samples of four observations per treatment. The pooled estimator of o is 9.12, and the sample means follow: = 101.6 2 98.4 x = 112.3 x4 = 92.9x5=104.2 x6 = 113.8a. Give the value of w that you would
11.23 Swamp Sites, again Refer to Exercise 11.13 and data set EX1113. Rank the mean leaf growth for the four locations. Use a = 0.01.
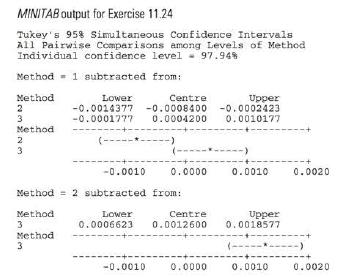
11.24 Calcium Refer to Exercise 11.15 and data set EX1115. The paired comparisons option in MINITAB generated the output provided here. What do these results tell you about the differences in the popula- tion means? Does this confirm your conclusions in Exercise 11.15? MINITAB output for Exercise
The cellular phone industry is involved in a fierce battle for customers, with each com- pany devising its own complex pricing plan to lure customers. Since the cost of a cell phone minute varies drastically depending on the number of minutes per month used by the customer, a consumer watchdog
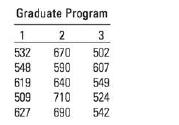
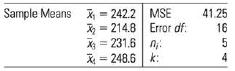
11.27 GRE Scores The Graduate Record Examination (GRE) scores were recorded for students admitted to three different graduate programs at a local university.a. Do these data provide sufficient evidence to indicate a difference in the mean GRE scores for applicants admitted to the three programs?b.
11.26 The Cost of Lumber, continued The analysis of variance F test in Exercise 11.17 (and data set EX1117) determined that there was indeed a differ- ence in the average cost of lumber for the four prov- inces. The following information from Exercise 11.17 is given in the table:Use Tukey's method
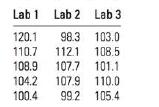
11.25 Glucose Tolerance Physicians depend on laboratory test results when managing medical problems such as diabetes or epilepsy. In a uniformity test for glucose tolerance, three different laboratories were each sent n, = 5 identical blood samples from a person who had drunk 50 milligrams (mg) of
For at distribution with 5 degrees of freedom, the value of that has area 0.05 to its right is found in row 5 in the column marked to 050. For this particular distribution, the area to the right of t = 2.015 is 0.05; only 5% of all values of the t statistic will exceed this value.
Suppose you have a sample of size n = 10 from a normal distribution. Find a value of 1 such that only 1% of all values of t will be smaller.
A new process for producing synthetic diamonds can be operated at a profitable level only if the average weight of the diamonds is greater than 0.5 karat. To evaluate the profitability of the process, six diamonds are generated, with recorded weights 0.46, 0.61, 0.52, 0.48, 0.57, and 0.54 karat. Do
Labels on 3.79 litre (L) cans of paint usually indicate the drying time and the area that can be covered in one coat. Most brands of paint indicate that, in one coat, 3.79 L will cover between 23.2 and 46.4 square metres (m2), depending on the texture of the surface to be painted. One manufacturer,
Suppose the average fuel consumption of a SUV manufactured at an automobile plant in Windsor is 12.9 L/100 km in city. The average fuel consumption (in L/100 km) for seven randomly selected SUVs is 13.5, 13.0, 12.6, 12.2, 12.8, 12.9, and 13.1. Assume that the distribution of fuel consumption
A manufacturer claims that the average lifetime of an electrical component produced at its plant is 75 weeks. A consumer agency reports that the lifetime (in weeks) of nine ran- domly selected components were 74.5, 75.0, 72.3, 76.0, 75.2, 75.1, 75.3, 74.9, and 74.8. Assume the component lifetime
"Tar" is the term used to describe the toxic chemicals found in cigarettes. The con- centration of tar in a cigarette determines its rating: High-tar cigarettes contain at least 22 milligrams (mg) of tar; medium-tar cigarettes from 15 mg to 21 mg; and low-tar cigarettes 7 mg or less of tar. In
A red blood cell (RBC) count is a useful blood test that can provide information about how the number of red blood cells in a person's blood. This test might be done as one component of a complete blood cell (CBC) count. A RBC count is the number of red blood cells per volume of blood, and is
10.1 Find the following t-values in Table 4 of Appendix I:a. 10.05 for 5 dfc. 10.10 for 18 dfb. 10.025 for 8 dfd. 10.025 for 30 df
10.2 Find the critical value(s) of t that specify the rejection region in these situations:a. A two-tailed test with a = 0.01 and 12 dfb. A right-tailed test with a 0.05 and 16 dfc. A two-tailed test with a = 0.05 and 25 dfd. A left-tailed test with a = 0.01 and 7 df
10.3 Use Table 4 in Appendix I to approximate the p-value for the statistic in each situation:a. A two-tailed test with t = 2.43 and 12 dfb. A right-tailed test with t = 3.21 and 16 dfc. A two-tailed test with -1.19 and 25 dfd. A left-tailed test with t = -8.77 and 7 df
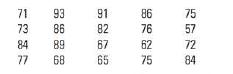
10.4 Test Scores The test scores on a 100-point test were recorded for 20 students:a. Can you reasonably assume that these test scores have been selected from a normal population? Use a stem and leaf plot to justify your answer.b. Calculate the mean and standard deviation of the scores.c. If these
10.5 The following n = 10 observations are a sample from a normal population: 7.4 7.1 6.5 7.5 7.6 6.3 6.9 7.7 6.5 7.0a. Find the mean and standard deviation of these data.b. Find a 99% upper one-sided confidence bound for the population mean .c. Test Ho=7.5 versus Ha:
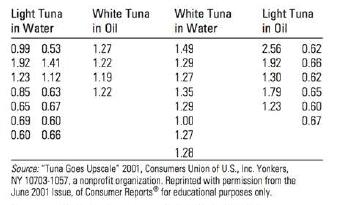
10.6 Tuna Fish Is there a difference in the prices of tuna, depending on the method of packaging? Consumer Reports gives the estimated average price for a 170-gram (g) can or a 200-gram pouch of tuna, based on prices paid nationally in supermarkets. These prices are recorded for a variety of
10.7 Dissolved O Content Industrial wastes and sewage dumped into our rivers and streams absorb oxygen and thereby reduce the amount of dissolved oxygen available for fish and other forms of aquatic life. One provincial agency requires a minimum of 5 parts per million (ppm) of dissolved oxygen in
10.8 Lobsters In a study of the infestation of the Thenus orientalis lobster by two types of barnacles, Octolasmis tridens and O. lowei, the carapace lengths (in millimetres mm) of 10 randomly selected lobsters caught in the seas near Singapore are measured: 78 66 65 63 60 60 58 56 52 50 Find a 95%
10.9 Smoking and Lung Capacity It is recognized that cigarette smoking has a deleterious effect on lung function. In a study of the effect of cigarette smoking on the carbon monoxide diffusing capacity (DL) of the lung, researchers found that current smokers had DL readings significantly lower than
10.10 Wayne Gretzky In Exercise 2.35 (EX0235), the number of goals scored by Wayne Gretzky were recorded for seasons 1978-1999.a. Construct a stem and leaf plot of the n = 21 observations. Based on this plot, is it reasonable to assume that the underlying population is approximately normal, as
10.11 Purifying Organic Compounds Organic chemists often purify organic compounds by a method known as fractional crystallization. An experimenter wanted to prepare and purify 4.85 g of aniline. Ten 4.85 g quantities of aniline were individually prepared and purified to acetanilide. The following
10.12 Organic Compounds, continued Refer to Exercise 10.11. Approximately how many 4.85 g speci- mens of aniline are required if you wish to estimate the mean number of grams of acetanilide correct to within 0.06 g with probability equal to 0.95?
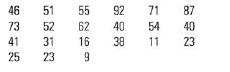
10.13 Bulimia Although there are many treatments for bulimia nervosa, some subjects fail to benefit from treatment. In a study to determine which factors predict who will benefit from treatment, an article in the British Journal of Clinical Psychology indicates that self-esteem was one of these
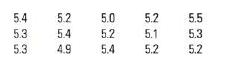
10.14 RBC Counts Here are the red blood cell counts (in 10 cells per microlitre) of a healthy person measured on each of 15 days:Find a 95% confidence interval estimate of , the true mean red blood cell count for this person during the period of testing. 555 5.4 5.3 5.3 433 5.2 5.0 5.2 5.4 5.2 5.1
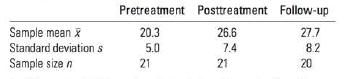
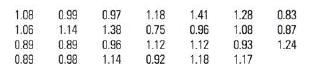
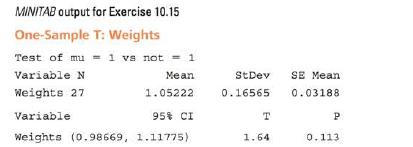
10.15 Ground Beef These data are the weights (in kilograms) of 27 packages of ground beef in a supermarket meat display:a. Interpret the accompanying MINITAB printouts for the one-sample test and estimation procedures.b. Verify the calculated values of 7 and the upper and lower confidence limits.
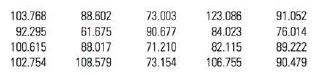
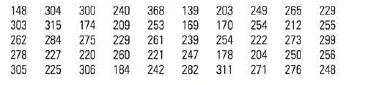
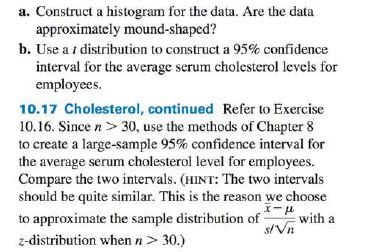
10.16 Cholesterol The serum cholesterol levels of 50 subjects randomly selected from the L.A. Heart Data, data from an epidemiological heart disease study on employees, follow."a. Construct a histogram for the data. Are the data approximately mound-shaped?b. Use at distribution to construct a 95%
10.17 Cholesterol, continued Refer to Exercise 10.16. Since n > 30, use the methods of Chapter 8 to create a large-sample 95% confidence interval for the average serum cholesterol level for employees. Compare the two intervals. (HINT: The two intervals should be quite similar. This is the reason
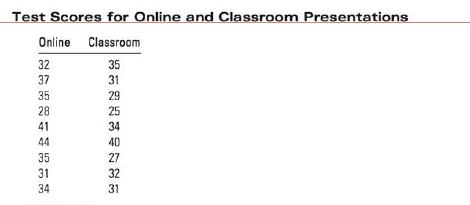
A course can be taken for credit either by attending lecture sessions at fixed times and days, or by doing online sessions that can be done at the student's own pace and sched- ule. The course coordinator wants to determine if these two ways of taking the course resulted in a significant difference
Find the p-value that would be reported for the statistical test in Example 10.9.
Use a lower 95% confidence bound to estimate the difference (u) in Example 10.9. Does the lower confidence bound indicate that the online test score average is significantly higher than the classroom test score average?
10.18 Give the number of degrees of freedom for s, the pooled estimator of o, in these cases:a. n = 16, n = 8b. n = 10, n = 12c. n = 15, n = 3
10.19 Calculate s, the pooled estimator for , in these cases: =a. n 10, n24, s = 3.4, s=4.9b. n =12, n = 21, s = 18, s = 23
Showing 3800 - 3900
of 7136
First
32
33
34
35
36
37
38
39
40
41
42
43
44
45
46
Last
Step by Step Answers