New Semester
Started
Get
50% OFF
Study Help!
--h --m --s
Claim Now
Question Answers
Textbooks
Find textbooks, questions and answers
Oops, something went wrong!
Change your search query and then try again
S
Books
FREE
Study Help
Expert Questions
Accounting
General Management
Mathematics
Finance
Organizational Behaviour
Law
Physics
Operating System
Management Leadership
Sociology
Programming
Marketing
Database
Computer Network
Economics
Textbooks Solutions
Accounting
Managerial Accounting
Management Leadership
Cost Accounting
Statistics
Business Law
Corporate Finance
Finance
Economics
Auditing
Tutors
Online Tutors
Find a Tutor
Hire a Tutor
Become a Tutor
AI Tutor
AI Study Planner
NEW
Sell Books
Search
Search
Sign In
Register
study help
business
introduction to probability statistics
Introduction To Probability Volume 2 1st Edition Narayanaswamy Balakrishnan, Markos V. Koutras, Konstadinos G. Politis - Solutions
7.83 Elevator Loads The maximum load (with a generous safety factor) for the elevator in an office building is 900 kg. The relative frequency distribution of the weights of all men and women using the elevator is mound-shaped (slightly skewed to the heavy weights), with mean equal to 65 kg and
7.84 Wiring Packages The number of wiring pack- ages that can be assembled by a company's employees has a normal distribution, with a mean equal to 16.4 per hour and a standard deviation of 1.3 per hour.a. What are the mean and standard deviation of the number x of packages produced per worker in
7.85 Wiring Packages, continued Refer to Exercise 7.84. Suppose the company employs 10 assemblers of wiring packages.a. Find the mean and standard deviation of the com- pany's daily (8-hour day) production of wiring packages.b. What is the probability that the company's daily pro- duction is less
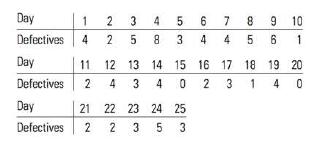
7.86 Defective Light bulbs The table lists the number of defective 60-watt light bulbs found in samples of 100 bulbs selected over 25 days from a manufacturing process. Assume that during these 25 days the manufacturing process was not pro- ducing an excessively large fraction of defectives.a.
Where do Canada's most clever people live? Who wins the IQ battle of the sexes? We found out on March 18, 2007. "Test the Nation" was the biggest survey ever conducted to see just how smart Ca- nadians are. In this live two-hour special, 1.5 million Canadians participated in a real- time
A computer database at a downtown law firm contains files for N = 1000 clients. The firm wants to select n = 5 files for review. Select a simple random sample of 5 files from this database.
7.13 Tai Chi and Fibromyalgia A small new study shows that tai chi, an ancient Chinese practice of exer- cise and meditation, may relieve symptoms of chronic painful fibromyalgia. The study assigned 66 fibromy- algia patients to take either a 12-week tai chi class or attend a wellness education
7.14 Blood Thinner A study of an experimental blood thinner was conducted to determine whether it works better than the simple aspirin tablet in warding off heart attacks and strokes.' The study reported in the Press Enterprise involved 19,185 people who had suffered heart attacks, strokes, or pain
7.15 Health Care: Canada Speaks Two differ- ent polls were conducted by two different organizations, both of which involved people's feelings about national priorities/important issues. Here is a question from each, along with the response of the sampled Canadians:a. Read the two poll questions.
7.16 Ask Canada A nationwide policy survey was sent by the Conservative Party Election Committee to voters asking for opinions on a variety of political issues. Here are some questions from the survey: In recent years has the federal government grown more or less intrusive in your personal and
A population consists of N = 5 numbers: 3, 6, 9, 12, 15. If a random sample of size n = 3 is selected without replacement, find the sampling distributions for the sample mean x and the sample median m.
The duration of Alzheimer's disease from the onset of symptoms until death ranges from 3 to 20 years; the average is 8 years with a standard deviation of 4 years. The administrator of a large medical centre randomly selects the medical records of 30 deceased Alzheimer's patients from the medical
To avoid difficulties with the federal or provincial and local consumer protection agen- cies, a beverage bottler must make reasonably certain that 355 millilitre (mL) bottles actually contain 355 mL of beverage. To determine whether a bottling machine is working satisfactorily, one bottler
Statistics Canada reports that the birth weight of newborn babies in Saskatchewan has a mean of 3.45 kg for both sexes." Suppose the standard deviation is 0.70 kg. Further, we randomly sample 49 birth certificates in Saskatchewan and record the birth weights of sampled babies. Find the mean and
7.17 Random samples of size n were selected from populations with the means and variances given here. Find the mean and standard deviation of the sampling distribution of the sample mean in each case: -a. n = 36, u 10,0 = 9b. n 100, u 5,0 = 4c. n = 8, p =120,0 = 1 7.18 Refer to Exercise 7.17.a. If
7.19 Refer to Exercise 7.17, partb. a. Sketch the sampling distribution for the sample mean and locate the mean and the interval 20/Vn along the x-axis.b. Shade the area under the curve that corresponds to the probability that lies within 0.15 unit of the population mean .c. Find the probability
7.20 A population consists of N = 5 numbers: 1, 3, 5, 6, and 7. It can be shown that the mean and standard deviation for this population are = 4.4 and 2.15, respectively.a. Construct a probability histogram for this population.b. Use the random number table, Table 10 in Appendix I, to select a
7.21 Refer to Exercise 7.20.a. Use the data entry method in your calculator to find the mean and standard deviation of the 50 values of x given in Exercise 7.20, partc. b. Compare the values calculated in part a to the theo- retical mean and the theoretical standard deviation on for the sampling
7.12 MRIs In a study described in the American Journal of Sports Medicine, Peter D. Franklin and col- leagues reported on the accuracy of using magnetic resonance imaging (MRI) to evaluate ligament sprains and tears on 35 patients. Consecutive patients with acute or chronic knee pain were selected
7.11 Racial Bias? Does the race of an interviewer matter? This question was investigated by Chris Gilberg and colleagues and reported in an issue of Chance magazine. The interviewer asked, "Do you feel that affirmative action should be used as an occupation selection criteria?" with possible
A research chemist is testing a new method for measuring the amount of titanium (Ti) in ore samples. She chooses 10 ore samples of the same weight for her experi- ment. Five of the samples will be measured using a standard method, and the other 5 using the new method. Use random numbers to assign
Identify the sampling design for each of the following: 1. The faculty of mathematics and science at the Brock University consists of six academic departments and two centres. Dr. S. Ejaz Ahmed, the academic Dean of the faculty, decides which research proposals submitted to him by each department
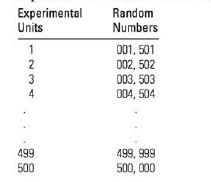
7.1 A population consists of N = 500 experimental units. Use a random number table to select a random sample of n = 20 experimental units. (HINT: Since you need to use three-digit numbers, you can assign two three- digit numbers to each of the sampling units in the manner shown in the table.) What
7.5 Every 10th Person A random sample of public opinion in a small town was obtained by selecting every 10th person who passed by the busiest corner in the down- town area. Will this sample have the characteristics of a random sample selected from the town's citizens? Explain.
7.6 Parks and Recreation A questionnaire was mailed to 1000 registered municipal voters selected at random. Only 500 questionnaires were returned, and of the 500 returned, 360 respondents were strongly opposed to a surcharge proposed to support the city Parks and Recreation Department. Are you
7.7 MPAC Lists and Jury Selection Juries are selected in Ontario through a process described in the Juries Act. Enumeration lists are obtained from the Municipal Property Assessment Corporation (MPAC). These lists are updated only once every four years, and persons at the households contacted by
7.8 Sex and Violence One question on a survey questionnaire is phrased as follows: "Don't you agree that there is too much sex and violence during prime TV viewing hours?" Comment on possible problems with the responses to this question. Suggest a better way to pose the question.
7.9 Omega-3 Fats Contrary to current thought about omega-3 fatty acids, new research shows that the ben- eficial fats may not help reduce second heart attacks in heart attack survivors. The study included 4837 men and women being treated for heart disease. The experi- mental group received an
7.10 Cancer in Rats The Press Enterprise identified a byproduct of chlorination called MX that has been linked to cancer in rats. A scientist wants to conduct a valida- tion study using 25 rats in the experimental group, each to receive a fixed dose of MX, and 25 rats in a control group that will
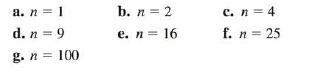
7.22 A random sample of n observations is selected from a population with standard deviation = 1. Calculate the standard error of the mean (SE) for these values of n: a. n 1 b. n = 2 c. n=4 d. n = 9 e. n = 16 f. n = 25 g. n = 100
7.47 Calculate SE(p) for n = 100 and these values of p:a. p = 0.01b. p = 0.10c. p = 0.30d. p = 0.50e. p = 0.70f. p = 0.90 g. p = 0.99 h. Plot SE(p) versus p on graph paper and sketch a smooth curve through the points. For what value of p is the standard deviation of the sampling distribu- tion of p
7.37 Potassium Levels The normal daily human potassium requirement is in the range of 2000 to 6000 milligrams (mg), with larger amounts required during hot summer weather. The amount of potassium in food varies, depending on the food. For example, there are approximately 7 mg in a cola drink, 46 mg
7.38 Deli Sales The total daily sales, x, in the deli section of a local market is the sum of the sales generated by a fixed number of customers who make purchases on a given day.a. What kind of probability distribution do you expect the total daily sales to have? Explain.b. For this particular
7.39 Normal Temperatures In Exercise 1.68, Allen Shoemaker derived a distribution of human body temperatures with a distinct mound shape.10 Suppose we assume that the temperatures of healthy humans is approximately normal with a mean of 37 Celsius and a standard deviation of 0.2 degrees.a. If 130
7.40 Sports and Achilles Tendon Injuries Some sports that involve a significant amount of running, jumping, or hopping put participants at risk for Achilles tendinopathy (AT), an inflammation and thickening of the Achilles tendon. A study in The American Journal of Sports Medicine looked at the
A sports facility located in Prince Edward Island recently conducted a survey on the importance of sports for children. In the survey, 500 mothers and fathers were asked about the importance of sports for boys and girls. Of the parents interviewed, 60% agreed that the genders are equal and should
Refer to Example 7.8. Suppose the proportion p of parents in the population is actually equal to 0.55. What is the probability of observing a sample proportion as large as or larger than the observed value p = 0.60?
7.41 Random samples of size n were selected from binomial populations with population parameters p given here. Find the mean and the standard deviation of the sampling distribution of the sample proportion p in each case:a. n 100, p = 0.3b. n 400, p = 0.1c. n = 250, p = 0.6
7.42 Sketch each of the sampling distributions in Exercise 7.41. For each, locate the mean p and the interval p 2 SE along the p-axis of the graph.
7.43 Refer to the sampling distribution in Exercise 7.41, parta. a. Sketch the sampling distribution for the sample proportion and shade the area under the curve that corresponds to the probability that lies within 0.08 of the population proportion p.b. Find the probability described in part a.
7.44 Is it appropriate to use the normal distribution to approximate the sampling distribution of p in the fol- lowing circumstances?a. n = 50, p = 0.05b. n = 75, p = 0.1c. n=250, p = 0.99
7.45 Random samples of size n = 75 were selected from a binomial population with p = 0.4. Use the normal distribution to approximate the following probabilities:a. P(p 0.43)b. P(0.35 p 0.43)
7.46 Random samples of size n = 500 were selected from a binomial population with p = 0.1.a. Is it appropriate to use the normal distribution to approximate the sampling distribution of p? Check to make sure the necessary conditions are met. Using the results of parta, find these probabilities:b.
7.24 A random sample of n observations is selected from a population with standard deviation = 5. Calculate the standard error of the mean (SE) for these values of n:a. n = 1b. n = 2c. n = 4d. n = 9e. n = 16f. n = 25 g. n = 100
7.36 Paper Strength A manufacturer of paper used for packaging requires a minimum strength of 1400 g/cm. To check on the quality of the paper, a random sample of 10 pieces of paper is selected each hour from the previous hour's production and a strength measurement is recorded for each. The
7.23 Refer to Exercise 7.22. Plot the standard error of the mean (SE) versus the sample size n and con- nect the points with a smooth curve. What is the effect of increasing the sample size on the standard error?
7.25 Refer to Exercise 7.24. Plot the standard error of the mean (SE) versus the sample size n and connect the points with a smooth curve. What is the effect of increasing the sample size on the standard error?
7.26 A random sample of size n = 49 is selected from a population with mean = 53 and standard deviation = 21.a. What will be the approximate shape of the sampling distribution of X?b. What will be the mean and standard deviation of the sampling distribution of x?
7.27 Refer to Exercise 7.26. Find the probability that the sample mean is greater than 55.
7.28 A random sample of size n = 40 is selected from a population with mean deviation or = 20. = 100 and standarda. What will be the approximate shape of the sampling distribution of X?b. What will be the mean and standard deviation of the sampling distribution of x?
7.29 Refer to Exercise 7.28. Find the probability that the sample mean is between 105 and 110.
7.31 Measurement Error When research chemists perform experiments, they may obtain slightly dif- ferent results on different replications, even when the experiment is performed identically each time. These differences are due to a phenomenon called "measure- ment error."a. List some variables in a
7.32 Tomatoes Explain why the weight of a pack- age of one dozen tomatoes should be approximately normally distributed if the dozen tomatoes represent a random sample.
7.33 Bacteria in Water Use the Central Limit Theorem to explain why a Poisson random variable- say, the number of a particular type of bacteria in a cubic metre of water-has a distribution that can be approximated by a normal distribution when the mean is large.
7.34 Faculty Salaries Suppose that university faculty with the rank of assistant professor earn an average of $74,000 per year with a standard deviation of $6000. In an attempt to verify this salary level, a random sample of 60 assistant professors was selected from a personnel database for all
7.35 Tax Savings An important expectation of a federal income tax reduction is that consumers will reap a substantial portion of the tax savings. Suppose estimates of the portion of total tax saved, based on a random sampling of 35 economists, have a mean of 26% and a standard deviation of 12%.a.
The density function of X is f (x) = 32x−3, x ≥ 4.The expected value of X is 2.
If the distribution of X has a jump at the pointa, then P(X =a) = 0.
If X has a mixed distribution, then its range contains infinitely many points.
The distribution function of X is given by F(x) =⎧⎪⎨⎪⎩0, x < 0(x2 + 1)∕5, 0 ≤ x < 2 1, x ≥ 2.Then X has a mixed distribution.
If a continuous random variable X has distribution function F, then for anya, b, P(a < X
A random variable X has density f (x) = 2(3x − x2)9 , 0 < x < 3.Then the probability P(1 < X < 2) equals 13∕27.
The manufacturing time, X, for an item produced by a machine has distribution function F(t) = 1 − e−2t2, t ≥ 0.Then, the probability P(X > 2) equals e−8.16. A random variable has probability density f (x) = x3∕4, 0 ≤ x ≤ 2.The variance of X is 8∕75.
Let X be a continuous variable whose range is the entire real line and which has distribution function FX, and let Y = |X|. Then for the distribution function, FY , of Y, we have FY (y) = FX(y) − FX(−y), y ≥ 0.
Let X be a random variable with density function f (x) = 1 3, 0 ≤ x ≤ 3.Then we have P(X2 ≤ 1) = 1∕3.
If X has distribution function F(t) =⎧⎪⎨⎪⎩0, t < 2,(t − 2)∕4, 2 ≤ t < 6, 1, t ≥ 6, then E(X) = 5.
The density function of a random variable X is f (x) = xe−x, x > 0.The distribution function of X (for x > 0) is(a) 1 − e−x (b) 1 − xe−x (c) 1 − x − e−x(d) 1 − (1 + x)e−x (e) 1 − x2e−x
The density function of X is f (x) = c(x + 3)2 , 0 ≤ x ≤ 3.Then the value of c is(a) 2 (b) 6 (c) 3 (d) 1∕6 (e)1∕2
A random variable X has distribution function F(t) =⎧⎪⎨⎪⎩0, t < −2,(t + 2)∕8, −2 ≤ t < 1, 5∕8, 1 ≤ t < 3, 1, t ≥ 3.Then the probability P(−1 ≤ X < 3) equals(a) 5 8(b) 3 8(c) 1 2(d) 7 8(e) 3 4
A continuous variable X has density function f (x) = 3x2, 0 ≤ x ≤ b.The value of b is(a) 1 (b) 1∕3 (c) 3 (d)3 √3 (e) 3 √2
A random variable has probability density function f (x) = c|x|, −2 ≤ x ≤ 2.The value of c is(a) 1 (b) 2 (c) 4 (d) 1∕2 (e)1∕4
Let X be a continuous variable with density fX(x) = (2x + 1)∕6, 0 < x < 2.Then the density function of Y = X2 is fY (y) = (2y + 1)2∕36, 0 < y < 4.
Let f be a density function of a random variable X. Then, we have limx→∞ f (x) = 1.
The function f (x) = 3(4x − x2)∕8, 0 ≤ x ≤ 4, can be the density function of a continuous random variable.
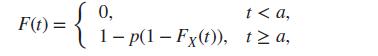
Let FX be the distribution function and fX be the density function of a variable X for which we know that P(X ≥a) = 1, where a ∈ ℝ is a given constant. We define the functionwhere 0 (i) Verify that F is the distribution function of a random variable Y, which is neither (purely) discrete nor
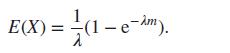
A random variable X has distribution functionwhere ???? and m are positive constants.(i) Identify the point(s) at which F has jumps.(ii) Find the density function associated with the continuous part of this distribution.(iii) Show that the expectation of X is11. An insurance contract with
The lifetime of an electrical appliance (in thousands of hours) is a random variable X with density function f (x) ={0, x < 0, 0.5 ⋅ (x∕20)9 ⋅ e−(x∕20)10, x ≥ 0.(i) Find the distribution function of X.(ii) Find the proportions of appliances of this type with a lifetime(a) more than 20
Draw a graph of the density functions for the distributions given in Exercise 21 of Section 6.1. Hence find, in each case, the point a around which the density is symmetric. Moreover, verify numerically that for each of these distribution functions, we have F(a − x) + F(a + x) = 1 for any x ∈
Suppose that X is a continuous random variable with distribution function⎧⎪⎨⎪⎩0, t < 2, 0.5t − 1, 2 ≤ t ≤ 4, 1, t > 4.Draw a graph of the difference between the exact value of the probability P(|X − 3| ≥ t), t > 0, and the upper bound for this that we get from Chebyshev’s
Find the value of the constant c ∈ ℝ for which the function f defined by f (x) =⎧⎪⎨⎪⎩c ⋅2 + cos(√x)ex∕3 , 0 ≤ x ≤ π2, 0, elsewhere, is a density function for a continuous random variable X. Using this value ofc, find the mean and the variance of X.
The value of an investment at the end of a certain period is described by a random variable X with density function f (x) =⎧⎪⎨⎪⎩1 x√2πe−(ln x−4)2∕2, x > 0, 0, x ≤ 0.(i) Find the probability that, at the end of the period, the value of the investment is(a) at least 35 monetary
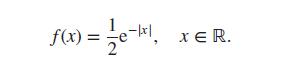
The density function of a random variable X is given by f (x) = c ⋅ e−|x|, −∞ < x < ∞, for a real constant c.(i) Find the value of c and draw the graphs of the density function and the distribution function of the variable X.(ii) Obtain the expectation ???? = E(X) and the variance
After reading the applications section of this chapter (Section 6.10), draw a graph of the mean monthly profit, as a function of the ordered quantity z, and find the value of z that maximizes this profit, in each of the following cases:(i) ???? = 10, ???? = 5, f (x) = 3x2 8e−x3∕8, x > 0;(ii)
A probability density function can take positive, zero, and negative values.
A continuous variable X has density function f (x) = 2c + 3, 2 ≤ x ≤ 6.Then the value of c is 1∕2.
The density function of a random variable is always a decreasing function.
If a continuous random variable X with density function f and distribution function F takes only positive values then, for any x > 0, we have F(x) =∫x 0f (y)dy.
For a continuous random variable X with distribution function F, we have F′(x) =P(X = x).
An insurance company classifies the claims it receives as being either small (if they are up to $5000) or large. During a calendar year, an insured customer may either make one claim or none. It has been estimated that 85% of the company’s customers make no claims during a year, 10% make a small
The density function of a random variable is given by f (x) = 2x(c + 1)5 , 0 < x < 2.The distribution function of X is(a) F(t) =⎧⎪⎨⎪⎩0, t < 0, t∕2, 0 ≤ t < 2, 1, t ≥ 2(b) F(t) =⎧⎪⎨⎪⎩0, t < 0, t2∕2, 0 ≤ t < 2, 1, t ≥ 2(c) F(t) =⎧⎪⎨⎪⎩0, t < 0, t2∕4, 0 ≤ t
The pressure P, in lb ft−2, developed at the wings of an aircraft is given by P = 3 ⋅ 10−3V2, where V is the velocity (in miles per hour) of the wind surrounding the wings. The pressure can be considered as a random variable with density function f (p) = c√p, 0 ≤ p ≤ a, for c > 0 and a
The measurement error of an instrument can be described by a random variable X with distribution function(i) Calculate the following probabilities P(X (ii) Find the density function and the expectation of the random variable X.(iii) Obtain the distribution for the magnitude of the error (i.e. that
The percentage concentration, in alcohol, of a medical substance is a continuous variable X with density function f (x) = cx(1 − x)n, 0 < x < 1, where c is a real constant and n is a positive integer.(i) Find the value ofc, as a function of n.(ii) For n = 7, show that the average content in
The time, in minutes, that a medicine for pain relief takes until it starts to have effect is a random variable X with density functionwhere ???? > 0 is the parameter of the distribution of X. Find (i) the distribution function F(t) and the probability P(a b) for 0 (ii) the mean and variance of
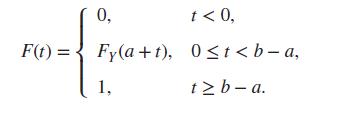
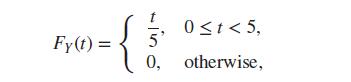
A continuous random variable X has distribution function(i) Obtain an expression for the probability P(a b) for a 0.(ii) Verify that the density function of X is given byiii) Calculate the expected value and the variance of X.(iv) Find the distribution function, the mean, and the variance of the
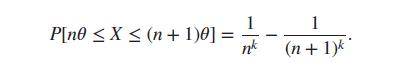
Let X be a random variable having the Pareto distribution (Example 6.6). The density of X is given by(i) What is the distribution function F(t) of X?(ii) For a given positive integer n, show that(iii) Derive the value of the limit 1 P[ne X (n+1)0] = nk (n+1)k
The lifetime, in hundreds of hours, of a light bulb is a continuous random variable with density function f (x) = ????2xe−????x, x > 0, where ???? > 0.(i) Calculate the distribution function of X.(ii) What is the expected value and the variance for the lifetime of a bulb?(iii) From past data, it
Let X1 and X2 be two continuous random variables with density functions f1 and f2, expected values ????1 and ????2 and variances ????2 1 and ????2 2 , respectively. Consider now a function f defined by f (x) = ????f1(x) + (1 − ????)f2(x), x ∈ ℝ, where 0 ≤ ???? ≤ 1.(i) Verify that f is the
Let X and Y be two continuous random variables with densities fX and fY , respectively, and with the same range of values, R. Is it possible that fX(x) < fY (x) for all x ∈ R?If it is, give an example, otherwise explain why this cannot happen.
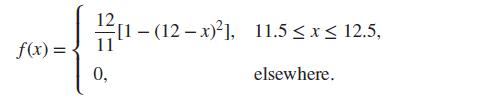
A manufacturing unit produces metal tubes with a nominal diameter of 12 in. The actual diameter of a tube can be regarded as a random variable having density function (in inches)Assuming that the length of each tube is 20 ft, answer the following:(i) Find the density function and the distribution
Showing 4300 - 4400
of 7136
First
37
38
39
40
41
42
43
44
45
46
47
48
49
50
51
Last
Step by Step Answers