New Semester
Started
Get
50% OFF
Study Help!
--h --m --s
Claim Now
Question Answers
Textbooks
Find textbooks, questions and answers
Oops, something went wrong!
Change your search query and then try again
S
Books
FREE
Study Help
Expert Questions
Accounting
General Management
Mathematics
Finance
Organizational Behaviour
Law
Physics
Operating System
Management Leadership
Sociology
Programming
Marketing
Database
Computer Network
Economics
Textbooks Solutions
Accounting
Managerial Accounting
Management Leadership
Cost Accounting
Statistics
Business Law
Corporate Finance
Finance
Economics
Auditing
Tutors
Online Tutors
Find a Tutor
Hire a Tutor
Become a Tutor
AI Tutor
AI Study Planner
NEW
Sell Books
Search
Search
Sign In
Register
study help
business
introduction to probability statistics
Introduction To Probability And Statistics 3rd Edition William Mendenhall - Solutions
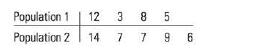
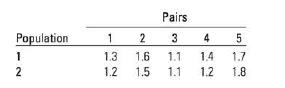
10.20 Two independent random samples of sizes n = 4 and n = 5 are selected from each of two normal populations: Population 1 Population 2 12 3 8 5 14 7 7 96
10.21 Independent random samples of n = 16 and n2 13 observations were selected from two normal populations with equal variances:a. Suppose you wish to detect a difference between the population means. State the null and alternative hypotheses for the test.b. Find the rejection region for the test
10.22 Refer to Exercise 10.21. Find a 99% confidence interval for (-).
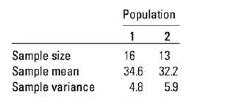
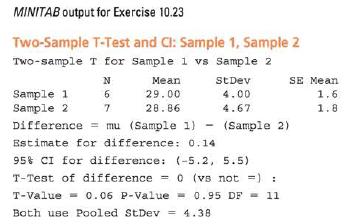
10.23 The MINITAB printout shows a test for the difference in two population means.a. Do the two sample standard deviations indicate that the assumption of a common population variance is reasonable?b. What is the observed value of the test statistic? What is the p-value associated with this
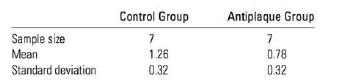
10.25 Healthy Teeth Jan Lindhe conducted a study on the effect of an oral antiplaque rinse on plaque buildup on teeth. Fourteen people whose teeth were thoroughly cleaned and polished were randomly assigned to two groups of seven subjects each. Both groups were assigned to use oral rinses (no
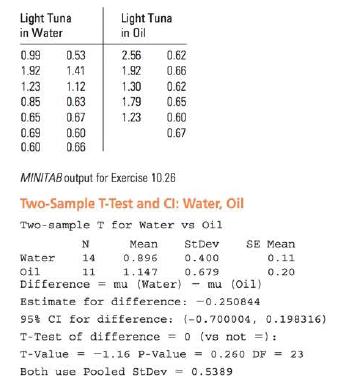
10.26 Tuna Fish, again In Exercise 10.6 we presented data on the estimated average price for a 170 g can or a 200 g pouch of tuna, based on prices paid nationally in supermarkets. A portion of the data is reproduced in the table below. Use the MINITAB printout to answer the questions.a. Do the data
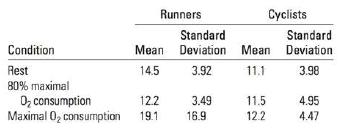
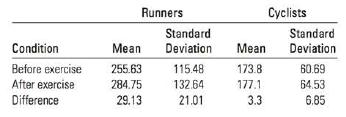
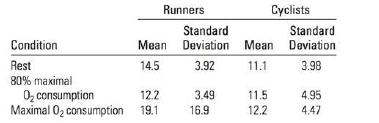
10.27 Runners and Cyclists Chronic anterior compartment syndrome is a condition characterized by exercise-induced pain in the lower leg. Swelling and impaired nerve and muscle function also accompany this pain, which is relieved by rest. Susan Beckham and colleagues conducted an experiment
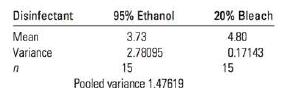
10.28 Disinfectants An experiment published in The American Biology Teacher studied the efficacy of using 95% ethanol or 20% bleach as a disinfectant in removing bacterial and fungal contamination when culturing plant tissues. The experiment was repeated 15 times with each disinfectant, using
10.29 Titanium A geologist collected 20 different ore samples, all of the same weight, and randomly divided them into two groups. The titanium contents of the samples, found using two different methods, are listed in the table:a. Use an appropriate method to test for a significant difference in the
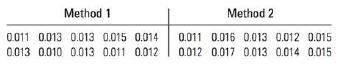
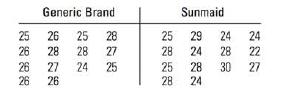
10.30 Raisins The numbers of raisins in each of 14 miniboxes (15 g) were counted for a generic brand and for Sunmaid brand raisins:a. Although counts cannot have a normal distribution, do these data have approximately normal distributions? (HINT: Use a histogram or stem and leaf plot.)b. Are you
10.31 Dissolved O Content, continued Refer to Exercise 10.7, in which we measured the dissolved oxygen content in river water to determine whether a stream had sufficient oxygen to support aquatic life. A pollution control inspector suspected that a river community was releasing amounts of
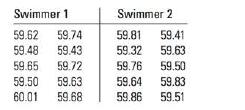
10.32 Freestyle Swimmers In an effort to EX1032 compare the average swimming times for two swimmers, each swimmer was asked to swim freestyle for a distance of 100 metres (m) at randomly selected times. The swimmers were thoroughly rested between laps and did not race against each other, so that
10.33 Freestyle Swimmers, continued Refer to Exercise 10.32. Construct a lower 95% one-sided confidence bound for the difference in the average times for the two swimmers. Does this interval confirm your conclusions in Exercise 10.32?
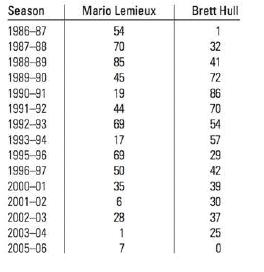
10.34 Comparing NHL Superstars How does Mario Lemieux compare to Brett Hull? The table below shows number of goals scored for each player for selected years.a. Does the data indicate that there is a difference in the average number of goals scored for the two players? Test using a = 0.05.b.
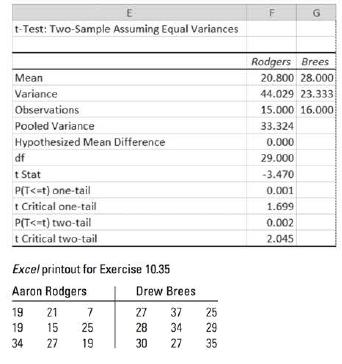
10.35 Comparing NFL Quarterbacks How does Aaron Rodgers, quarterback for the 2011 Super Bowl Champion Green Bay Packers, compare to Drew Brees, quarterback for the 2010 Super Bowl Champion New Orleans Saints? The table below shows the number of completed passes for each athlete during the 2010 NFL
10.36 An Archeological Find An article in Archaeometry involved an analysis of 26 samples of Romano-British pottery, found at four different kiln sites in the United Kingdom. 13 The samples were analyzed to determine their chemical- composition and the percentage of aluminum oxide in each of 10
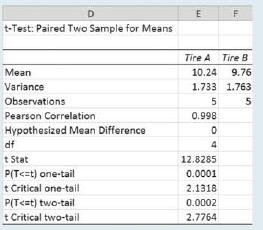
Do the data in Table 10.3 provide sufficient evidence to indicate a difference in the mean wear for tire types A and B? Test using = 0.05.
Find a 95% confidence interval for (u1-u2) = using the data in Table 10.3.
10.37 A paired-difference experiment was conducted using n = 10 pairs of observations.a. Test the null hypothesis Ho: () = 0 against H ( )0 for a = 0.05, d=0.3, and s=0.16. Give the approximate p-value for the test.b. Find a 95% confidence interval for (-2).c. How many pairs of observations do you
10.38 A paired-difference experiment consists of n = 18 pairs, d = 5.7, and s=256. Suppose you wish to detect > 0.a. Give the null and alternative hypotheses for the test.b. Conduct the test and state your conclusions.
10.39 A paired-difference experiment was conducted to compare the means of two populations:a. Do the data provide sufficient evidence to indicate differs from ? Test using a = 0.05. thatb. Find the approximate p-value for the test and interpret its value.c. Find a 95% confidence interval for (-).
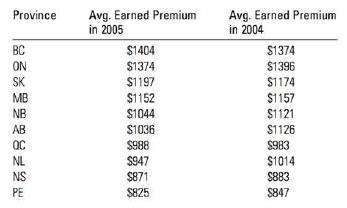
10.40 Auto Insurance The cost of automobile insurance has become a sore subject because the rates are dependent on so many variables, such as the province in which you live, the number of cars you insure, and the company with which you are insured. The table is adapted from a publication of Fraser
10.41 Runners and Cyclists II Refer to Exercise 10.27. In addition to the compartment pressures, the level of creatine phosphokinase (CPK) in blood samples, a measure of muscle damage, was determined for each of 10 runners and 10 cyclists before and after exercise. The data summary CPK values in
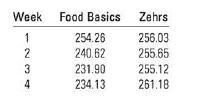
10.42 Canada's Food Basics An advertisement for Food Basics claims that Food Basics has had consistently lower prices than four other full-service supermarkets. As part of a survey conducted by an "independent market basket price-checking company," the average weekly total, based on the prices (in
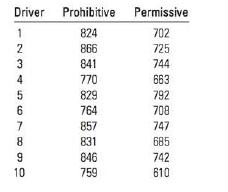
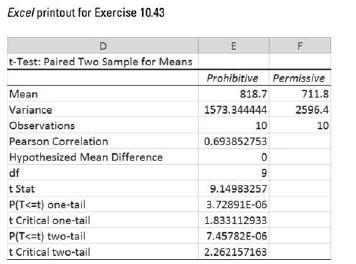
10.43 No Left Turn An experiment was conducted to compare the mean reaction times to two types of traffic signs: prohibitive (No Left Turn) and permis- sive (Left Turn Only). Ten drivers were included in the experiment. Each driver was presented with 40 traffic signs, 20 prohibitive and 20
10.44 Healthy Teeth II Exercise 10.25 describes a dental experiment conducted to investigate the effectiveness of an oral rinse used to inhibit the growth of plaque on teeth. Subjects were divided into two groups: One group used a rinse with an antiplaque ingredient, and the control group used a
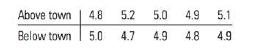
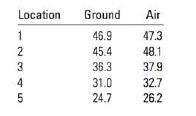
10.45 Ground or Air? The earth's temperature (which affects seed germination, crop survival in bad weather, and many other aspects of agricultural production) can be measured using either ground-based sensors or infrared-sensing devices mounted in aircraft or space satellites. Ground-based
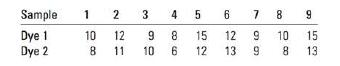
10.46 Red Dye To test the comparative brightness of two red dyes, nine samples of cloth were taken from a production line and each sample was divided into two pieces. One of the two pieces in each sample was randomly chosen and red dye 1 applied; red dye 2 was applied to the remaining piece. The
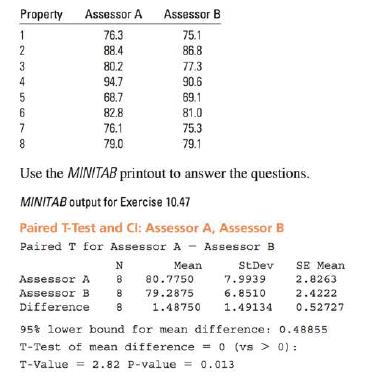
10.47 Tax Assessors In response to a complaint that a particular tax assessor (A) was biased, an experiment was conducted to compare the assessor named in the complaint with another tax assessor (B) from the same office. Eight properties were selected, and each was assessed by both asses- sors. The
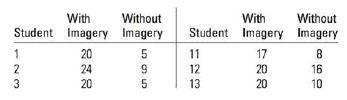
10.48 Memory Experiments A psychology class performed an experiment to compare whether a recall score in which instructions to form images of 25 words were given is better than an initial recall score for which no imagery instructions were given. Twenty students participated in the experiment with
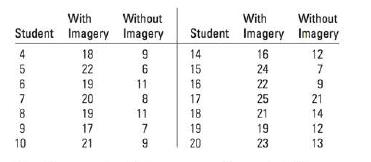
10.49 Music in the Workplace Before contracting to have stereo music piped into each of his suites of offices, an executive had his office manager randomly select seven offices in which to have the system installed. The average time (in minutes) spent outside these offices per excursion among the
Check your ability to use Table 5 in Appendix I by verifying the following statements: 1. The probability that x, based on n = 16 measurements (df = 15), exceeds 24.9958 is 0.05. 2. For a sample of n = 6 measurements, 95% of the area under the x distribution lies to the right of 1.145476. These
A cement manufacturer claims that concrete prepared from its product has a relatively stable compressive strength and that the strength measured in kilograms per square centimetre (kg/cm) lies within a range of 40 kg/cm. A sample of n = 10 measure- ments produced a mean and variance equal to,
An experimenter is convinced that her measuring instrument had a variability mea- sured by standard deviation = 2. During an experiment, she recorded the measure- ments 4.1, 5.2, and 10.2. Do these data confirm or disprove her assertion? Test the appropriate hypothesis, and construct a 90%
10.50 A random sample of n = 25 observations from a normal population produced a sample variance equal to 21.4. Do these data provide sufficient evidence to indicate that o > 15? Test using = 0.05.
10.51 A random sample of n = 15 observations was selected from a normal population. The sample mean and variance were 3.91 and s = 0.3214. Find a 90% confidence interval for the population variance o.
10.52 A random sample of size n = 7 from a normal population produced these measurements: 1.4, 3.6, 1.7, 2.0, 3.3, 2.8, 2.9.a. Calculate the sample variance, s.b. Construct a 95% confidence interval for the population variance, o.c. Test Hoo = 0.8 versus H, 0.8 using a=0.05. State your
10.53 Instrument Precision A precision instrument is guaranteed to read accurately to within 2 units. A sample of four instrument readings on the same object yielded the measurements 353, 351, 351, and 355. Test the null hypothesis that = 0.7 against the alternative > 0.7. Use = 0.05.
10.54 Instrument Precision, continued Find a 90% confidence interval for the population variance in Exercise 10.53.
10.55 Drug Potency To properly treat patients, drugs prescribed by physicians must have a potency that is accurately defined. Consequently, not only must the distribution of potency values for shipments of a drug have a mean value as specified on the drug's container, but also the variation in
10.56 Drug Potency, continued Refer to Exercise 10.55. Testing of 60 additional randomly selected containers of the drug gave a sample mean and variance equal to 5.04 and 0.0063 (for the total of n = 64 containers). Using a 95% confidence interval, estimate the variance of the manufacturer's
10.57 Hard Hats A manufacturer of hard safety hats for construction workers is concerned about the mean and the variation of the forces helmets transmit to wearers when subjected to a standard external force. The manufacturer desires the mean force transmitted by helmets to be 363 kg (or less),
10.58 Hard Hats, continued Refer to Exercise 10.57. Do the data provide sufficient evidence to indicate that o exceeds 18.1?
10.59 Light Bulbs A manufacturer of industrial light bulbs likes its bulbs to have a mean life that is acceptable to its customers and a variation in life that is relatively small. If some bulbs fail too early in their life, customers become annoyed and shift to competitive products. Large
Check your ability to use Table 6 in Appendix I by verifying the following statements: 1. The value of F with area 0.05 to its right for df = 6 and df = 9 is 3.37. 2. The value of F with area 0.05 to its right for df = 5 and df = 10 is 3.33. 3. The value of F with area 0.01 to its right for df = 6
An experimenter is concerned that the variability of responses using two different ex- perimental procedures may not be the same. Before conducting his research, he con- ducts a prestudy with random samples of 10 and 8 responses and gets s = 7.14 and $23.21, respectively. Do the sample variances
Refer to Example 10.18 and find a 90% confidence interval for /0.
The variability in the amount of impurities present in a batch of chemical used for a particular process depends on the length of time the process is in operation. A manufac- turer using two production lines 1 and 2 has made a slight adjustment to line 2, hoping to reduce the variability as well as
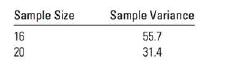
10.60 Independent random samples from two normal populations produced the variances listed here:a. Do the data provide sufficient evidence to indicate that of differs from o? Test using = 0.05.b. Find the approximate p-value for the test and interpret its value. Sample Size Sample Variance 9& 16 20
10.61 Refer to Exercise 10.60 and find a 95% confidence interval for o.
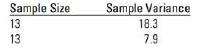
10.62 Independent random samples from two normal populations produced the given variances:a. Do the data provide sufficient evidence to indicate > that o? Test using = 0.05.b. Find the approximate p-value for the test and interpret its value. Sample Size Sample Variance 13 18.3 13 7.9
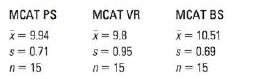
10.63 MCAT Scores The MCAT consists of four sections: Physical Science (PS), Verbal Reasoning (VR), Biological Sciences (BS), and Writing (WS). The student receives a separate score for each section. The PS, VR, and BS sections are scored on a scale of 1 to 15. On the other hand, the WS is scored
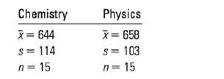
10.64 SAT Scores The SAT subject tests in chemistry and physics for two groups of 15 students each electing to take these tests are given below.To use the two-sampler test with a pooled estimate of o, you must assume that the two population variances are equal. Test this assumption using the F test
10.65 Construct a 90% confidence interval for the variance ratio in Exercise 10.64.
10.66 Tuna III In Exercise 10.26 and dataset EX1026, you conducted a test to detect a difference in the average prices of light tuna in water versus light tuna in oil.""a. What assumption had to be made concerning the population variances so that the test would be valid?b. Do the data present
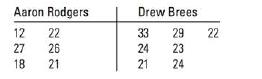
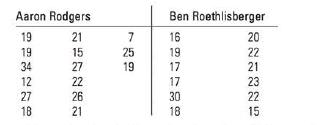
10.67 Roethlisberger and Rodgers Quarterbacks not only need to have a good passing percentage, but they need to be consistent. That is, the variability in the number of passes completed per game should be small. The table below gives the number of passes completed for Ben Roethlisberger and Aaron
10.68 Runners and Cyclists III Refer to Exercise 10.27. Susan Beckham and colleagues conducted an experiment involving 10 healthy runners and 10 healthy cyclists to determine if there are significant differences in pressure measurements within the anterior muscle compartment for runners and
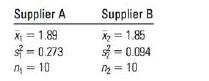
10.69 Impurities A pharmaceutical manufacturer purchases a particular material from two different suppliers. The mean level of impurities in the raw material is approximately the same for both suppliers, but the manufacturer is concerned about the variability of the impurities from shipment to
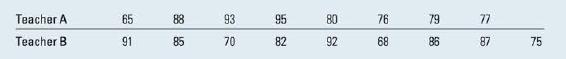
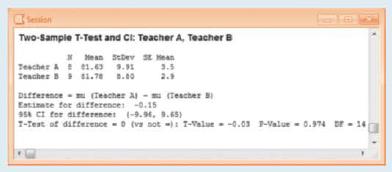
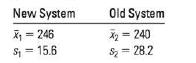
Two-Sample t Test Assuming Equal Variances The test scores on the same algebra test were recorded for nine students randomly selected from a classroom taught by teacher A and eight students randomly selected from a classroom taught by Teach- er B. Is there a difference in the average scores for
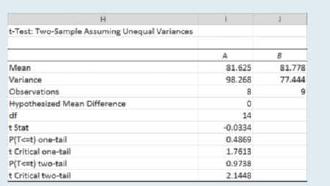
Two-Sample t Test Assuming Unequal Variances 1. Refer to Example 10.21. If the ratio of the two sample variances had been so large that you could not assume equal variances (we use "greater than 3" as a rule of thumb), you should select Data Data Analysis t-Test: Two- Sample Assuming Unequal
Paired t Test Refer to the tire wear data from Table 10.3 (page 424). 1. To perform a paired-difference test for these dependent samples, enter the data into the first two columns of an Excel spreadsheet and select Data Data Analysis t-Test: Paired Two Sample for Means. 2. Follow the directions for
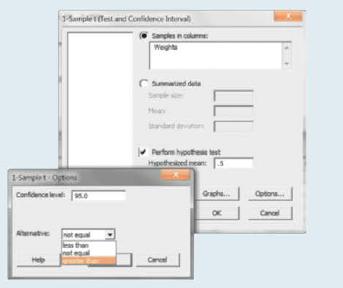
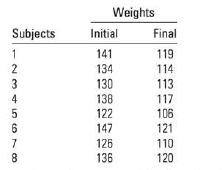
One-Sample t Test Refer to Example 10.3, in which the average weight of diamonds using a new process was compared to an average weight of 0.5 karat. 1. Enter the six recorded weights-0.46, 0.61, 0.52, 0.48, 0.57, 0.54-in column C1 and name them "Weights." Use Stat Basic Statistics 1-Sample t to
Two-Sample t Test The test scores on the same algebra test were recorded for nine students randomly selected from a classroom taught by Teacher A and eight students randomly selected from a classroom taught by Teacher B. Is there a difference in the average scores for students taught by these two
Two-Sample t Test Assuming Unequal Variances 1. Refer to Example 10.25. If the ratio of the two sample variances had been so large that you could not assume equal variances (we use "greater than 3" as a rule of thumb), you should select Stat Basic Statistics 2-Sample t, but DO NOT check the box
Paired-Difference Test Refer to the tire wear data from Table 10.3 on page 424. 1. To perform a paired-difference test for these dependent samples, enter the data into the first two columns of a MINITAB worksheet and select Stat Basic Statistics Paired t. 2. Follow the directions for the
10.70 What assumptions are made when Student's I test is used to test a hypothesis concerning a population mean?
10.71 What assumptions are made about the populations from which random samples are obtained when the distribution is used in making small-sample inferences concerning the difference in population means?
10.72 Why use paired observations to estimate the difference between two population means rather than estimation based on independent random samples selected from the two populations? Is a paired experi- ment always preferable? Explain.
10.73 Use Table 4 in Appendix I to find the following critical values:a. An upper one-tailed rejection region with = 0.05 and 11 dfb. A two-tailed rejection region with a = 0.05 and 7 dfc. A lower one-tailed rejection region with a = 0.01 and 15 df
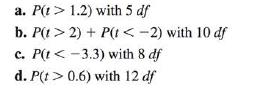
10.74 Use Table 4 in Appendix I to bound the following p-values: a. P(11.2) with 5 df b. P(12) + P(t 0.6) with 12 df
10.75 A random sample of n = 12 observations from a normal population produced x = 47.1 and s = 4.7. Test the hypothesis Ho: 48 against Ho: + 48 at the 5% level of significance.
10.76 Impurities II A manufacturer can tolerate a small amount (0.05 milligrams per litre [mg/L]) of impurities in a raw material needed for manufacturing its product. Because the laboratory test for the impurities is subject to experimental error, the manufacturer tests each batch 10 times. Assume
10.77 Red Pine The main stem growth mea- sured for a sample of 17 four-year-old red pine trees produced a mean and standard deviation equal to 25 and 7 centimetres (cm), respectively. Find a 90% confidence interval for the mean growth of a population of 6-year-old red pine trees subjected to
10.78 Sodium Hydroxide The object of a general chemistry experiment is to determine the amount (in millilitres [mL]) of sodium hydroxide (NaOH) solu- tion needed to neutralize 1 g of a specified acid. This will be an exact amount, but when the experiment is run in the laboratory, variation will
10.79 Sodium Chloride Measurements of water intake, obtained from a sample of 17 rats that had been injected with a sodium chloride solution, produced a mean and standard deviation of 31.0 and 6.2 cubic centimetres (cm), respectively. Given that the average water intake for non-injected rats
10.80 Sea Urchins An experimenter was interested in determining the mean thickness of the cortex of the sea urchin egg. The thickness was measured for n = 10 sea urchin eggs. These measurements were obtained:Estimate the mean thickness of the cortex using a 95% confidence interval. 4.5 6.1 3.2 3.9
10.81 Fabricating Systems A production plant has two extremely complex fabricating sys- tems; one system is twice as old as the other. Both systems are checked, lubricated, and maintained once every 2 weeks. The number of finished products fabricated daily by each of the systems is recorded for 30
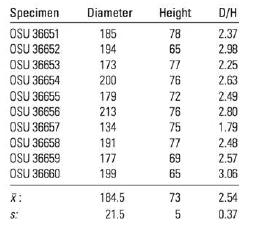
10.82 Fossils The data in the table are the O diameters and heights of 10 fossil specimens of a species of small shellfish, Rotularia (Annelida) fallax, that were unearthed in a mapping expedition near the Antarctic Peninsula.20 The table gives an identification symbol for the fossil specimen, the
10.83 Fossils, continued Refer to Exercise 10.82 and data set EX1082. Suppose you want to estimate the mean diameter of the fossil specimens correct to within 5 mm with probability equal to 0.95. How many fossils do you have to include in your sample?
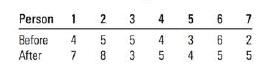
10.84 Alcohol and Reaction Times To test the effect of alcohol in increasing the reaction time to respond to a given stimulus, the reaction times of seven people were measured. After consuming 89 mL of 40% alcohol, the reaction time for each of the seven people was measured again. Do the fol-
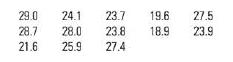
10.85 Cheese, Please Here are the prices per 28 g of n 13 different brands of individually wrapped cheese slices:Construct a 95% confidence interval estimate of the underlying average price per gram of individually wrapped cheese slices. 29.0 24.1 23.7 19.6 27.5 28.7 28.0 23.8 18.9 23.9 21.6 25.9
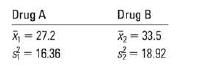
10.86 Drug Absorption An experiment was con- ducted to compare the mean lengths of time required for the bodily absorption of two drugs A and B. Ten people were randomly selected and assigned to receive one of the drugs. The length of time (in minutes) for the drug to reach a specified level in the
10.87 Drug Absorption, continued Refer to Exercise 10.86. Suppose you wish to estimate the difference in mean times to absorption correct to within one minute with probability approximately equal to 0.95.a. Approximately how large a sample is required for each drug (assume that the sample sizes are
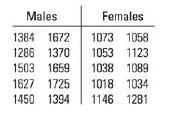
10.88 Ring-Necked Pheasants The weights in grams of 10 males and 10 female juvenile ring-necked pheasants are given below.a. Use a statistical test to determine if the population variance of the weights of the male birds differs from that of the females.b. Test whether the average weight of
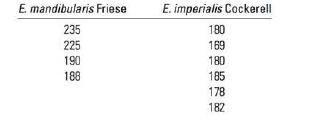
10.89 Bees Insects hovering in flight expend enormous amounts of energy for their size and weight. The data shown here were taken from a much larger body of data collected by T. M. Casey and colleagues.21 They show the wing stroke frequencies (in hertz) for two different species of bees, n = 4
10.90 Calcium The calcium (Ca) content of a powdered mineral substance was analyzed 10 times with the following percent compositions recorded:a. Find a 99% confidence interval for the true calcium content of this substance.b. What does the phrase "99% confident" mean?c. What assumptions must you
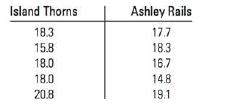
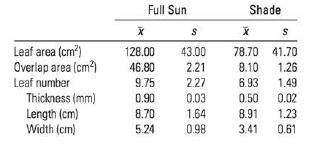
10.91 Sun or Shade? Karl Niklas and T.G. Owens examined the differences in a particular plant, Plantago Major L., when grown in full sunlight versus shade conditions. In this study, shaded plants received direct sunlight for less than two hours each day, whereas full-sun plants were never shaded. A
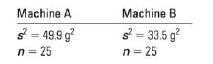
10.92 Orange Juice A comparison of the precisions of two machines developed for extracting juice from oranges is to be made using the following data:a. Is there sufficient evidence to indicate that there is a difference in the precision of the two machines at the 5% level of significance?b. Find a
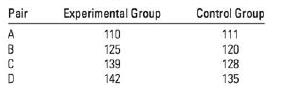
10.93 At Home or at School? Four sets of iden- tical twins (pairs A, B, C, and D) were selected at random from a computer database of identical twins. One child was selected at random from each pair to form an "experimental group." These four children were sent to school. The other four children
10.94 Dieting Eight obese persons were placed on a diet for one month, and their weights, at the beginning and at the end of the month, were recorded:Estimate the mean weight loss for obese persons when placed on the diet for a one-month period. Use a 95% confidence interval and interpret your
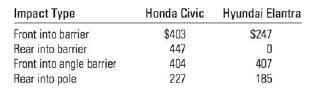
10.95 Repair Costs Car manufacturers try to design the bumpers of their automobiles to prevent costly damage in parking-lot type accidents. To compare two models of automobiles, the cars were purposely subject to a series of four front and rear impacts at 8 kilometres per hour (km/h), and the
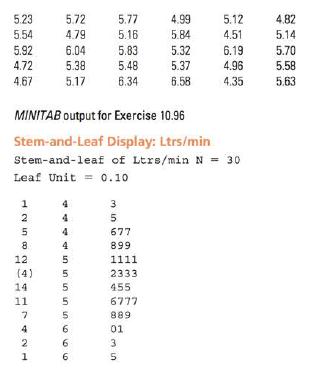
10.96 Breathing Patterns Research psychologists measured the baseline breathing patterns the total ventilation (in litres of air per minute) adjusted for body size-for each of n = 30 patients, so that they could estimate the average total ventilation for patients before any experimentation was
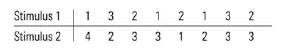
10.97 Reaction Times A comparison of reaction times (in seconds) for two different stimuli in a psychological word-association experiment produced the following results when applied to a random sample of 16 people:Do the data present sufficient evidence to indicate a difference in mean reaction
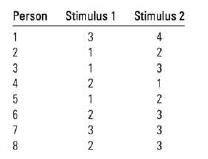
10.98 Reaction Times II Refer to Exercise 10.97. Suppose that the word-association experiment is conducted using eight people as blocks and making a comparison of reaction times within each person; that is, each person is subjected to both stimuli in a random order. The reaction times (in seconds)
10.99 Refer to Exercises 10.97 and 10.98. Calculate a 95% confidence interval for the difference in the two population means for each of these experimental designs. Does it appear that blocking increased the amount of information available in the experiment?
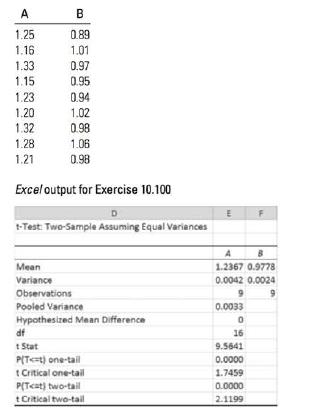
10.100 Impact Strength The following data are readings (in metre-kilograms) of the impact strengths of two kinds of packaging material:a. Use the Excel printout to determine whether there is evidence of a difference in the mean strengths for the two kinds of material.b. Are there practical
10.101 Cake Mixes An experiment was conducted to compare the densities (in grams per cubic centimetre) of cakes prepared from two different cake mixes. Six cake pans were filled with batter A, and six were filled with batter B. Expecting a variation in oven temperature, the experimenter placed a
10.102 Under what assumptions can the F distribution be used in making inferences about the ratio of population variances?
10.103 Got Milk? A dairy is in the market for a new container-filling machine and is considering two models, manufactured by company A and company B. Ruggedness, cost, and convenience are comparable in the two models, so the deciding factor is the variability of fills. The model that produces fills
10.104 Got Milk II Refer to Exercise 10.103. Wishing to demonstrate that the variability of fills is less for her model than for her competitor's, a sales representative for company A acquired a sample of 30 fills from her company's model and a sample of 10 fills from her competitor's model. The
Showing 3900 - 4000
of 7136
First
33
34
35
36
37
38
39
40
41
42
43
44
45
46
47
Last
Step by Step Answers