New Semester
Started
Get
50% OFF
Study Help!
--h --m --s
Claim Now
Question Answers
Textbooks
Find textbooks, questions and answers
Oops, something went wrong!
Change your search query and then try again
S
Books
FREE
Study Help
Expert Questions
Accounting
General Management
Mathematics
Finance
Organizational Behaviour
Law
Physics
Operating System
Management Leadership
Sociology
Programming
Marketing
Database
Computer Network
Economics
Textbooks Solutions
Accounting
Managerial Accounting
Management Leadership
Cost Accounting
Statistics
Business Law
Corporate Finance
Finance
Economics
Auditing
Tutors
Online Tutors
Find a Tutor
Hire a Tutor
Become a Tutor
AI Tutor
AI Study Planner
NEW
Sell Books
Search
Search
Sign In
Register
study help
business
introduction to probability statistics
Introduction To Probability Statistics And Random Processes 1st Edition Hossein Pishro-Nik - Solutions
For the following examples, find the maximum likelihood estimator (MLE) of θ:1. Xi ∼ Binomial(m, θ), and we have observed X1, X2, X3, . . ., Xn. 2. Xi ∼ Exponential(θ) and we have observed X1, X2, X3, . . ., Xn.
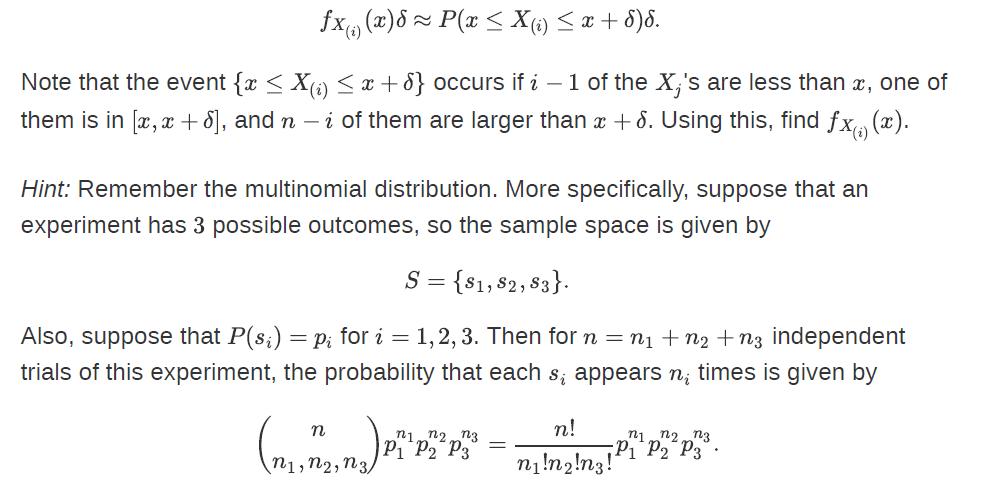
In this problem, we would like to find the PDFs of order statistics. Let X1,…,Xn be a random sample from a continuous distribution with CDF FX(x) and PDF fX(x). Define X(1),…,X(n) as the order statistics. Our goal here is to show thatOne way to do this is to differentiate the CDF (found in
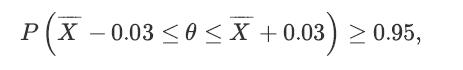
To estimate the portion of voters who plan to vote for Candidate A in an election, a random sample of size n from the voters is chosen. The sampling is done with replacement. Let θ be the portion of voters who plan to vote for Candidate A among all voters.a. How large does n need to be so that we
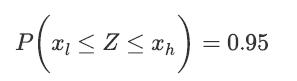
Let Z ∼ N(0, 1), find xl and xh such that P ( ₁₁ ≤ 2 ≤ 2₂ ) = 0 xh = 0.95
Let X1, X2, X3, . . ., X100 be a random sample from a distribution with unknown variance Var(Xi) = σ2
Let X1, X2, X3, . . ., Xn be a random sample from a normal distribution N(θ, 1). Find a 95% confidence interval for θ.
A random sample X1, X2, X3, . . ., X36 is given from a normal distribution with unknown mean μ = EXi and unknown variance Var(Xi) = σ2. For the observed sample, the sample mean is X̅ = 35.8, and the sample variance is S2 = 12.5.a. Find and compare 90%, 95%, and 99% confidence interval for μ.b.
Check that the random variables Q1 = X̅ −θ and Q2 = √n(X̅ − θ) are both valid pivots in Example 8.13.Example 8.13:Let X1, X2, X3, . . ., Xn be a random sample from a normal distribution N(θ, 1). Find a 95% confidence interval for θ.
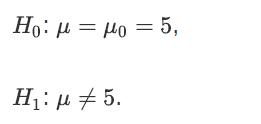
Let X1, X2, X3, X4, X5 be a random sample from a N(μ, 1) distribution, where μ is unknown. Suppose that we have observed the following values 5.45, 4.23, 7.22, 6.94, 5.98We would like to decide betweena. Define a test statistic to test the hypotheses and draw a conclusion assuming α = 0.05.b.
Let X1, X2, X3, . . ., Xn be a random sample from a distribution with known variance Var(Xi) = σ2, and unknown mean EXi = θ. Find a (1 −α) confidence interval for θ. Assume that n is large.
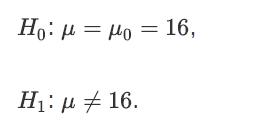
Let X1,…,X9 be a random sample from a N(μ, 1) distribution, where μ is unknown. Suppose that we have observed the following values 16.34, 18.57, 18.22, 16.94, 15.98, 15.23, 17.22, 16.54, 17.54We would like to decide betweena. Find a 90% confidence interval around X̅. Is μ0 included in the
An engineer is measuring a quantity θ. It is assumed that there is a random error in each measurement, so the engineer will take n measurements and report the average of the measurements as the estimated value of θ. Here, n is assumed to be large enough so that the central limit theorem applies.
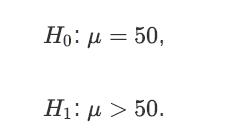
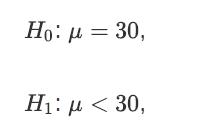
Let X1, X2 ,..., X150 be a random sample from an unknown distribution. After observing this sample, the sample mean and the sample variance are calculated to beDesign a level 0.05 test to choose betweenDo you accept or reject H0? X = 52.28, S² = 30.9
We would like to estimate the portion of people who plan to vote for Candidate A in an upcoming election. It is assumed that the number of voters is large, and θ is the portion of voters who plan to vote for Candidate A. We define the random variable X as follows. A voter is chosen uniformly at
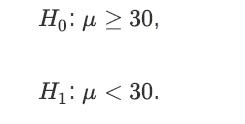
Let X1, X2, X3, X4, X5 be a random sample from a N(μ,σ2) distribution, where μ and σ are both unknown. Suppose that we have observed the following values 27.72, 22.24, 32.86, 19.66, 35.34. We would like to decide betweenAssuming α = 0.05, what do you conclude? Ho: μ ≥ 30, H: μ < 30.
Let X1, X2, X3, . . ., Xn be a random sample from this distribution, which means that the Xi's are i.i.d. and Xi ∼ Bernoulli(θ). In other words, we randomly select n voters (with replacement) and we ask each of them if they plan to vote for Candidate A. Find a (1 −α)100% confidence interval
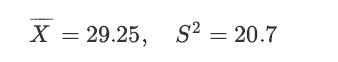
Let X1, X2 ,..., X121 be a random sample from an unknown distribution. After observing this sample, the sample mean and the sample variance are calculated to beDesign a test to decide betweenand calculate the P-value for the observed data. X = 29.25, S² = 20.7
There are two candidates in a presidential election: Candidate A and Candidate B. Let θ be the portion of people who plan to vote for Candidate A. Our goal is to find a confidence interval for θ. Specifically, we choose a random sample (with replacement) of n voters and ask them if they plan to
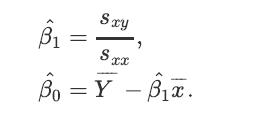
Consider the following observed values of (xi, yi):a. Find the estimated regression linebased on the observed data.b. For each xi, compute the fitted value of yi usingc. Compute the residuals, ei = yi − ^yi.d. Calculate R-squared. (-5,-2), (-3,1), (0,4), (2,6), (1,3).
Suppose we would like to test the hypothesis that at least 10% of students suffer from allergies. We collect a random sample of 225 students and 21 of them suffer from allergies.a. State the null and alternative hypotheses.b. Obtain a test statistic and a P-value.c. State the conclusion at the α =
A farmer weigh s 10 randomly chosen watermelons from his farm and he obtains the following values (in lbs): 7.72 9.58 12.38 7.77 11.27 8.80 11.10 7.80 10.17 6.00Assuming that the weight is normally distributed with mean μ and and variance σ, find a 95% confidence interval for μ.
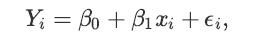
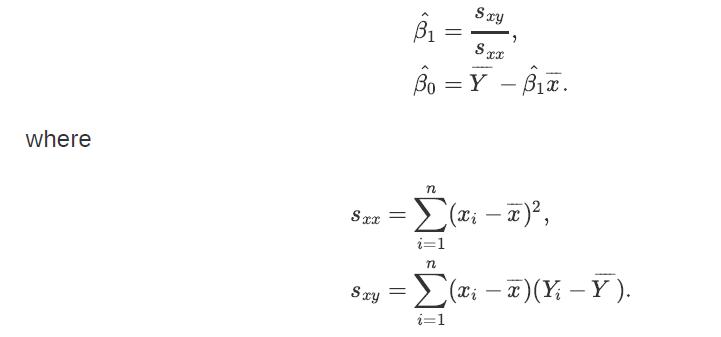
Consider the simple linear regression modelwhere ϵi's are independent N(0,σ2) random variables. Therefore, Yi is a normal random variable with mean β0 +β1xi and variance σ2. Moreover, Yi's are independent. As usual, we have the observed data pairs (x1, y1), (x2, y2), ⋯, (xn, yn) from which
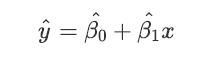
Consider the following observed values of (xi, yi): (1, 3), (3, 7).a. Find the estimated regression linebased on the observed data.b. For each xi, compute the fitted value of yi usingc. Compute the residuals, ei = yi − ^yi.d. Calculate R-squared.e. Explain the above results. In particular, can
For the data given in Example 8.20, find a 95% confidence interval for σ2. Again, assume that the weight is normally distributed with mean μ and and variance σ, where μ and σ are unknown.Example 8.20:A farmer weigh s 10 randomly chosen watermelons from his farm and he obtains the following
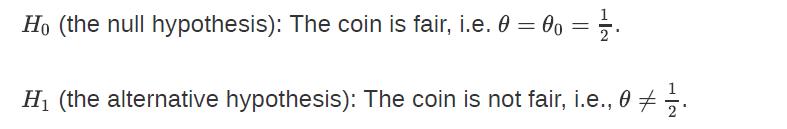
You have a coin and you would like to check whether it is fair or not. More specifically, let θ be the probability of heads, θ = P(H). You have two hypotheses: . 0 = 0o = 1/². Ho (the null hypothesis): The coin is fair, i.e. 0 = H₁ (the alternative hypothesis): The coin is not fair, i.e., 02.
The average adult male height in a certain country is 170 cm. We suspect that the men in a certain city in that country might have a different average height due to some environmental factors. We pick a random sample of size 9 from the adult males in the city and obtain the following values for
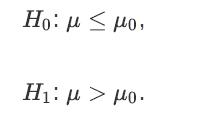
Let X1, X2,...,Xn be a random sample from a N(μ,σ2) distribution, where μ is unknown and σ is known. Design a level α test to choose between Ho: Ηο: μ Σμο, Η: μ > μο.
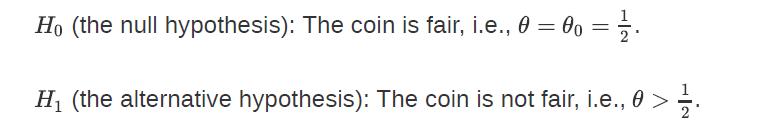
You have a coin and you would like to check whether it is fair or biased. More specifically, let θ be the probability of heads, θ = P(H). Suppose that you need to choose between the following hypotheses:We toss the coin 100 times and observe 60 heads.1. Can we reject H0 at significance level α =
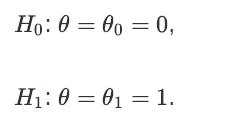
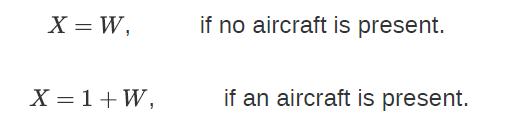
Here, we look again at the radar problem (Example 8.23). More specifically, we observe the random variable X: X = θ + W, where W ∼ N(0,σ2 = 1/9). We need to decide betweenLet X = x. Design a level 0.05 test (α = 0.05) to decide between H0 and H1.Example 8.23Consider a rad ar system that uses
Let X1, X2,...,Xn be a random sample from a N(μ, σ2) distribution, where μ and σ are unknown. Design a level α test to choose betweenH0: μ = μ0,H1: μ ≠ μ0.
For the above example (Example 8.24), find β, the probability of type II error, as a function of μ.Example 8.24 Let X1, X2,...,Xn be a random sample from a N(μ,σ2) distribution, where μ is unknown but σ is known. Design a level α test to choose betweenH0: μ = μ0,H1: μ ≠ μ0.
Let X1,X2,...,Xn be a random sample from a N(μ,σ2) distribution, where μ is unknown but σ is known. Design a level α test to choose betweenH0: μ = μ0,H1: μ ≠ μ0.
Again consider the simple linear regression modelwhere ϵi's are independent N(0,σ2) random variables, and Y = Bo + Britai
Consider a radar system that uses radio waves to detect aircraft. The system receives a signal and, based on the received signal, it needs to decide whether an aircraft is present or not. Let X be the received signal. Suppose that we know where W ∼ N(0,σ2 = 1/9). Thus, we can write X = θ +W,
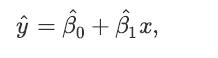
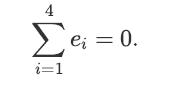
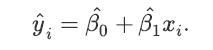
Consider the following observed values of (xi, yi): (1, 3) (2, 4) (3, 8) (4, 9)1. Find the estimated regression linebased on the observed data.2. For each xi, compute the fitted value of yi using3. Compute the residuals, ei = yi − ^yi and note that ŷ = Bo + ₁x,
For the data in Example 8.31, find the coefficient of determination.Example 8.31Consider the fo llowing observed values of (xi, yi):(1, 3) (2, 4) (3, 8) (4, 9)
Showing 7100 - 7200
of 7136
First
58
59
60
61
62
63
64
65
66
67
68
69
70
71
72
Step by Step Answers
![fx(i)(x) = = n! fx(x) [Fx(x)] [1 - Fx(z)]". (i-1)! (ni)! *](https://dsd5zvtm8ll6.cloudfront.net/images/question_images/1698/3/0/7/434653a1d6a789341698307432727.jpg)
![n Fxs) (x) = (7) [Fx(2)] * [1 Fx(x)]*-*. (i) k k=i](https://dsd5zvtm8ll6.cloudfront.net/images/question_images/1698/3/0/7/302653a1ce620bfc1698307300474.jpg)

![a. Show that B is a normal random variable. b. Show that is an unbiased estimator of 3, i.e., E[81] =B. c.](https://dsd5zvtm8ll6.cloudfront.net/images/question_images/1698/3/0/8/314653a20da633eb1698308312683.jpg)


![a. Show that Bo is a normal random variable. b. Show that is an unbiased estimator of Bo, i.e., E[Bo] = Bo.](https://dsd5zvtm8ll6.cloudfront.net/images/question_images/1698/3/0/8/364653a210cef9af1698308361990.jpg)