New Semester
Started
Get
50% OFF
Study Help!
--h --m --s
Claim Now
Question Answers
Textbooks
Find textbooks, questions and answers
Oops, something went wrong!
Change your search query and then try again
S
Books
FREE
Study Help
Expert Questions
Accounting
General Management
Mathematics
Finance
Organizational Behaviour
Law
Physics
Operating System
Management Leadership
Sociology
Programming
Marketing
Database
Computer Network
Economics
Textbooks Solutions
Accounting
Managerial Accounting
Management Leadership
Cost Accounting
Statistics
Business Law
Corporate Finance
Finance
Economics
Auditing
Tutors
Online Tutors
Find a Tutor
Hire a Tutor
Become a Tutor
AI Tutor
AI Study Planner
NEW
Sell Books
Search
Search
Sign In
Register
study help
business
practical management science
Practical Management Science 5th Edition Wayne L. Winston, Christian Albright - Solutions
Continuing the previous problem, use Goal Seek for each value of number mailed (once for 80,000, once for 90,000, and so on). For each, find the response rate that allows the company to break even. Then chart these values, where the number mailed is on the horizontal axis, and the breakeven
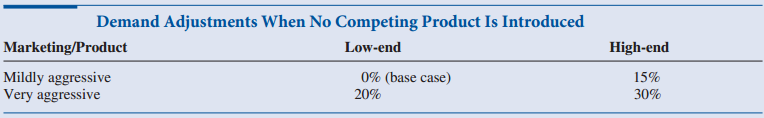
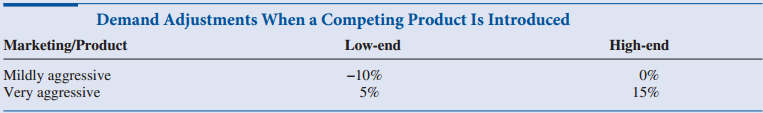
1. In the absence of cannibalization, the sales of existing eTech products are expected to produce year 1 net revenues of $10 million, and the fore-cast of the annual increase in net revenues is 2%.2. The ePlayerx will be developed as either a low-end or a high-end product, with corresponding fixed
In the Quality Sweaters model, the range E9:E11 does not have a range name. Open your completed Excel file and name this range Costs. Then look at the formula in cell E12. It does not automatically use the new range name. Modify the formula so that it does. Then click on cell G4 and paste the new
As the Quality Sweaters problem is now modeled, if all inputs remain fixed except for the number mailed, profit will increase indefinitely as the number mailed increases. This hardly seems realistic–the company could become infinitely rich. Discuss realistic ways to modify the model so that this
In some ordering problems, like the one for Sam’s Bookstore, whenever demand exceeds existing inventory, the excess demand is not lost but is filled by expedited orders–at a premium cost to the company. Change Sam’s model to reflect this behavior. Assume that the unit cost of expediting is
The spreadsheet model for Sam’s Bookstore contains a two-way data table for profit versus order quantity and demand. Experiment with Excel’s chart types to create a chart that shows this information graphically in an intuitive format.
In the Sam’s Bookstore problem, the quantity discount structure is such that all the units ordered have the same unit cost. For example, if the order quantity is 2500, then each unit costs $22.25. Sometimes the quantity discount structure is such that the unit cost for the first so many items is
The current spreadsheet model essentially finds the expected profit in several steps. It first finds the profit in cell B19 for a fixed value of demand. Then it uses a data table to find the profit for each of several demands, and finally it uses SUMPRODUCT to find the expected profit. Modify the
Continuing Problem 5, create a two-way data table for expected profit with order quantity along the side and unit expediting cost along the top. Allow the order quantity to vary from 500 to 4500 in increments of 500, and allow the unit expediting cost to vary from $36 to $45 in increments of $1.
Suppose you have an extra six months of data on demands and prices, in addition to the data in the example. These extra data points are (350, 84), (385, 72), (410, 67), (400, 62), (330, 92), and (480, 53). (The price is shown first and then the demand at that price.) After adding these points to
Consider the power curve y = 10000x–2.35. Calculate y when x = 5; when x = 10; and when x = 20. For each of these values of x, find the percentage change in y when x increases by 1%. That is, find the percentage change in y when x increases from 5 to 5.05; when it increases from 10 to 10.1; and
Consider the exponential curve y = 1000e–0.014x. Calculate y when x = 5; when x = 10; and when x = 20. For each of these values of x, find the percentage change in y when x increases by one unit. That is, find the percentage change in y when x increases from 5 to 6; when it increases from 10 to
In the profit model in this section, we used the power curve to relate demand and price because it has the lowest MAPE (as well as the lowest RMSE and MAE). However, the exponential curve was not far behind. Rework the profit model using the exponential curve to relate demand to price. Write a
Modify Acron’s model so that development lasts for an extra year. Specifically, assume that development costs of $7.2 million and $2.1 million are incurred at the beginnings of years 1 and 2, and then the sales in the current model occur one year later, that is, from year 2 until year 21. Again,
Modify Acron’s model so that sales increase, then stay steady, and finally decrease. Specifically, assume that the gross margin is $1.2 million in year 1, then increases by 10% annually through year 6, then stays constant through year 10, and finally decreases by 5% annually through year 20.
Create a one-way data table in the Acron model to see how the NPV varies with discount rate, which is allowed to vary from 8% to 18% in increments of 0.5%. Explain intuitively why the results go in the direction they go—that is, the NPV decreases as the discount rate increases. Should Acron
The NPV function automatically discounts each of the cash flows and sums the discounted values. Verify that it does this correctly for Acron’s model by calculating the NPV the long way. That is, discount each cash flow and then sum these discounted values. Use Excel formulas to do this, but
In a situation such as Acron’s, where a one-time cost is followed by a sequence of cash flows, the internal rate of return(IRR) is the discount rate that makes the NPV equal to 0. The idea is that if the discount rate is greater than the IRR, the company will not pursue the project, but if the
The XNPV function can calculate NPV for any (possibly irregular) series of cash flows. Look this function up in Excel’s online help. Then use it to develop a spreadsheet model that finds the NPV of the following series: a payment of $25,000 today (assumed to be June 15, 2014), and cash inflows of
Julie James is opening a lemonade stand. She believes the fixed cost per week of running the stand is $50.00. Her best guess is that she can sell 300 cups per week at $0.50 per cup. The variable cost of producing a cup of lemonade is $0.20.a. Given her other assumptions, what level of sales volume
You are thinking of opening a Broadway play, I Love You, You’re Mediocre, Now Get Better! It will cost $5 million to develop the show. There are 8 shows per week, and you project the show will run for 100 weeks. It costs $1000 to open the theater each night. Tickets sell for $50.00, and you earn
You are thinking of opening a small copy shop. It costs $5000 to rent a copier for a year, and it costs $0.03 per copy to operate the copier. Other fixed costs of running the store will amount to $400 per month. You plan to charge an average of $0.10 per copy, and the store will be open 365 days
Georgia McBeal is trying to save for her retirement. She believes she can earn 10% on average each year on her retirement fund. Assume that at the beginning of each of the next 40 years, Georgia will allocate x dollars to her retirement fund. If at the beginning of a year Georgia has y dollars in
A European call option on a stock earns the owner an amount equal to the price at expiration minus the exercise price, if the price of the stock on which the call is written exceeds the exercise price. Otherwise, the call pays nothing. A European put option earns the owner an amount equal to the
Repeat parts a – d of the previous problem for a six-month European put option with exercise price $40. Again, assume a current stock price of $35, a risk-free rate of 5%, and an annual volatility of 40%.Data from Previous Problem:a. Consider a six-month European call option with exercise price
The file P02_26.xlsx lists sales (in millions of dollars) of Dell Computer during the period 1987–1997 (where year 1 corresponds to 1987).a. Fit a power and an exponential trend curve to these data. Which fits the data better?b. Use your part a answer to predict 1999 sales for Dell.c. Use your
Dataware is trying to determine whether to give a $10 rebate, cut the price $6, or have no price change on a software product. Currently, 40,000 units of the product are sold each week for $45 apiece. The variable cost of the product is $5. The most likely case appears to be that a $10 rebate will
The file P02_28.xlsx gives the annual sales for Microsoft (in millions of dollars) for the years 1984 – 1993, where 1984 = year 1.a. Fit an exponential curve to these data.b. Assuming you are back in 1993, by what percent-age do you estimate that Microsoft has grown each year, based on this
Assume that the number of units sold of a product is given by 100 – 0.5 P + 26√A, where P is the price (in dollars) charged for the product and A is the amount spent on advertising (in thousands of dollars). Each unit of the product costs $5 to produce. Use a data table to find the combination
A company manufacturers a product in the United States and sells it in England. The unit cost of manufacturing is $50. The current exchange rate (dollars per pound) is 1.51. The demand function, which indicates how many units the company can sell in England as a function of price (in pounds) is of
The yield of a chemical reaction is defined as the ratio (expressed as a percentage) of usable output to the amount of raw material input. Suppose the yield of a chemical reaction depends on the length of time the process is run and the temperature at which the process is run. The yield can be
A bond is currently selling for $1040. It pays the amounts listed in the file P02_32.xlsx at the ends of the next six years. The yield of the bond is the interest rate that would make the NPV of the bond’s payments equal to the bond’s price. Use Excel’s Goal Seek tool to find the yield of the
Assume the demand for a company’s drug Wozac during the current year is 50,000, and assume demand will grow at 5% a year. If the company builds a plant that can produce x units of Wozac per year, it will cost $16x. Each unit of Wozac is sold for $3. Each unit of Wozac produced incurs a variable
Consider a project with the following cash flows: year 1, – $400; year 2, $200; year 3, $600; year 4, – $900; year 5, $1000; year 6, $250; year 7, $230. Assume a discount rate of 15% per year.a. Find the project’s NPV if cash flows occur at the ends of the respective years.b. Find the
A software company is considering translating its program into French. Each unit of the program sells for $50 and incurs a variable cost of $10 to produce. Currently, the size of the market for the product is 300,000 units per year, and the English version of the software has a 30% share of the
The payback of a project is the number of years it takes before the project’s total cash flow is positive. Payback ignores the time value of money. It is interesting, however, to see how differing assumptions on project growth impact payback. Suppose, for example, that a project requires a $300
You are entering the widget business. It costs $500,000, payable in year 1, to develop a prototype. This cost can be depreciated on a straight-line basis during years 1–5. Each widget sells for $40 and incurs a variable cost of $20. During year 1, the market size is 100,000, and the market is
Suppose you are borrowing $25,000 and making monthly payments with 1% interest. Show that the monthly payments should equal $556.11. The key relationships are that for any month t(Ending month t balance) = (Ending month t – 1 balance) – ((Monthly payment) – (Month t
You are thinking of starting Peaco, which will produce Peak babies, a product that competes with Ty’s Beanie Babies. In year 0 (right now), you will incur costs of $4 million to build a plant. In year 1, you expect to sell 80,000 Peak babies for a unit price of $25. The price of $25 will remain
Suppose the demand (in thousands) for a toaster is given by 100p–2, where p is the price in dollars charged for the toaster.a. If the variable cost of producing a toaster is $10, what price maximizes profit?b. The elasticity of demand is defined as the percentage change in demand created by a 1%
The file P02_41.xlsx contains the cumulative number of bits (in trillions) of DRAM (a type of computer memory) produced and the price per bit (in thousandths of a cent).a. Fit a power curve that can be used to show how price per bit drops with increased production. This relationship is known as the
The IRR is the discount rate r that makes a project have an NPV of $0. You can find IRR in Excel with the built-in IRR function, using the syntax = IRR(range of cash flows). However, it can be tricky. In fact, if the IRR is not near 10%, this function might not find an answer, and you would get an
A project does not necessarily have a unique IRR. (Refer to the previous problem for more information on IRR.) Show that a project with the following cash flows has two IRRs: year 1, – $20; year 2, $82; year 3, – $60; year 4, $2. (It can be shown that if the cash flow of a project changes sign
The file P02_46.xlsx contains data on prices of products for several of a chain store’s locations, a discount schedule offered to customers depending on how much they spend, and commission rates of the sales-people at the various stores. Your job is to develop an invoice form. Specifically, you
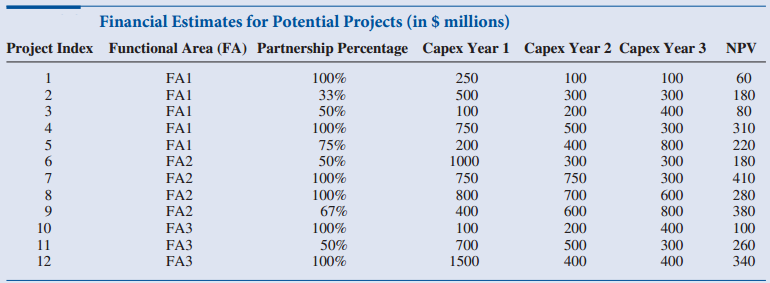
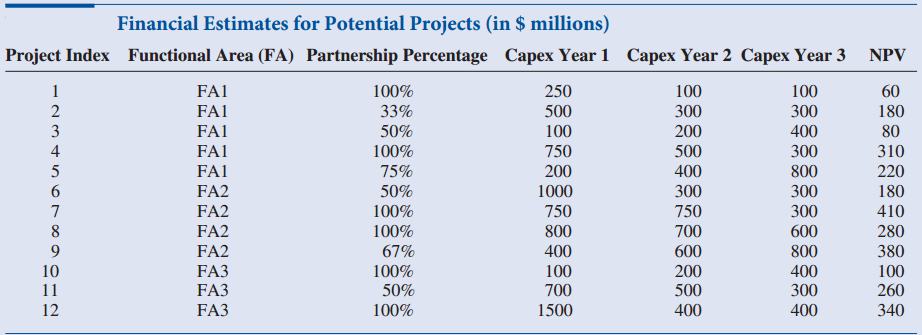
1. The model should list the given financial information for all potential projects.2. The model should associate with each proposed project a cell that is 1 if the project is approved and 0 if it is not approved.3. Several of the projects, if approved, must be undertaken in joint partnership with
Discuss how the aggregate planning model could be extended to handle a company that produces several products on several types of machines. What information would you need to model this type of problem?
Can you ever use the material in this chapter to help you make your own real-life decisions? Consider the following. You are about to take an important and difficult exam in one of your MBA courses, and you see an opportunity to cheat. Obviously, from an ethical point of view, you shouldn’t
The file P08_15.xlsx contains the following information about the top 25 MBA programs (according to the 1997 Business Week Guide): percentage of applicants accepted, percentage of accepted applicants who enroll, mean GMAT score of enrollees, mean under-graduate GPA of enrollees, annual cost of
For the data in the file P08_17.xlsx, develop a classification rule to classify students as admits or non-admits.
For data in the file P08_16.xlsx, develop a rule to predict whether a person is likely to purchase your lasagna product. What variables appear to be the most useful?
Continuing the previous problem, determine the portfolio that minimizes the chance that you will lose money during any month, subject to a lower bound constraint on your expected monthly return. (The lower bound will depend on your data. It must not be above the largest average return of your
Sales of a product over time often follow an S-shaped curve. Two functions that yield S-shaped curves are the Pearl (or logistic) curveand the Gompertz curveY = Le–be–ktHere, Y is annual sales, t is time (in years), L is the upper limit on sales, and a, b, and k are parameters to be
The adoption level of a new product can often be modeled as an S-shaped curve called the Pearl (or logistic) curve. The equation of this curve iswhere Y is the adoption level, L is an (unknown) upper limit on adoptions, t is time (in years), and a and b are parameters to be estimated. The file
The file P08_10.xlsx contains per capita data on annual advertising and annual unit sales in different regions of the country. Determine an S-shaped curve as described by Equation (8.1) that can be used to determine how advertising influences sales.
You are given the following information concerning how a change in sales force effort impacts sales:a. A 50% cut in sales force effort reduces sales to 48% of its current value.b. Sales force effort of 0 reduces sales to 15% of its current value.c. A 50% increase in sales force effort increases
In the lawn mower production problem in Example 8.4, experiment with the penalty cost for unsatisfied pick-ups in week 1. If this cost is sufficiently small, does the company ever produce fewer than seven models in week 1 and allow some week 1 pickups to be unsatisfied?
In the lawn mower production problem in Example 8.4, the model changeover cost dominates in the optimal objective value. Is this because we assumed such a large unit penalty cost, 200, for each model changeover? Explore this question by changing this unit penalty cost to lower values such as 100
In the truck-loading problem in Example 8.3, we assumed that any product could be loaded into any compartment. Suppose the following are not allowed: pro duct 1 in compartment 2, product 2 in compartment 1, and product 3 in compartment 4. Modify the model appropriately, and then use Evolutionary
Based on Schrage (1997). The file P08_05.xlsx lists the size of the four main markets for Excel, Word, and the bundle of Excel and Word. It also shows how much members of each group are willing to pay for each product combination. How can Microsoft maximize the revenue earned from these products?
In Example 8.2, determine the optimal pricing policy if Menthos are sold in only a one-pack or a six-pack.
In Example 8.2, determine the best pricing policy if quantity discounts with a single-price breakpoint are used.
This is an extension of Case 2.1 from Chapter 2, so you should read that case first. It asks you to develop a spreadsheet model, using a 0-1 variable for each potential project, so that Cliff Erland, Manager for Project Development, can easily see the implications of approving any set of projects.
Modify the function in Example 8.1 so that it becomes f(x) = x sin(x) for 0 ≤ x ≤ 30. Plot a lot of points from 0 to 30 to see what the graph of this function looks like. Then use GRG Nonlinear Solver to find its maximum. Try the following starting points: 1, 6, 15, 20, and 27. Report what you
The MBA program at State University has approximately 260 incoming students each fall semester. These students are divided into cohorts of approximately 65 students each, and the students in each cohort sit through exactly the same set of fall courses together. Much of the work in these courses is
Cook County needs to build two hospitals. There are nine cities where the hospitals can be built. The number of hospital visits made annually by the inhabitants of each city and the x and y coordinates of each city are listed in the file P08_29.xlsx. To minimize the total distance that patients
The file P08_30.xlsx contains quarterly revenue for Nike for the years 1991 to 1998. It also contains quarterly “indicator” variables Q1, Q2, and Q3. Here Q1 is 1 for the first quarter of a fiscal year (July–September) and 0 otherwise. Q2 and Q3 are defined similarly for the second and
Music radio WABC has commercials of the following lengths (in seconds): 15, 15, 20, 25, 30, 35, 40, 57. The commercials must be assigned to 60-second breaks. What is the fewest number of breaks that are needed to air all of the commercials?
A Wall Street firm is trying to package nine mortgages for sale. The sizes of the mortgages (in thousands of dollars) are listed in the file P08_32.xlsx. To be sold, each package must consist of at least $1,000,000 in mortgages. What is the largest number of packages that can be created?
During the next 12 months, the amounts of electric power needed (in thousands of kwh) are listed in the file P08_33.xlsx. This power can be supplied using four generators. The generating capacity (in thousands of kwh), the operating cost, the startup cost, and the shutdown cost (all costs in
Ten data sets must be assigned for storage to one of three disk drives. Each disk drive can store 25 GB (about 25,000 MB). The sizes of the data sets (in MB) are listed in the file P08_35.xlsx. When many people access a disk drive, there is a significant reduction in the speed at which the data are
You are the Democratic campaign manager for the state of Indiana. There are 15 fairly large cities in the state of Indiana. The numbers of Democrats and Republican voters in these cities (in thousands) are listed in the file P08_37.xlsx. The Democrats control the state legislature, so they can
A steel manufacturer needs to cool 17 pieces of steel. The weight and due date for each piece are listed in the file P08_38.xlsx. Processing and cooling a batch in the furnace takes five minutes regardless of the weight in the furnace. The furnace can handle up to 1000 pounds at a time. Jobs 6 and
Suppose you are the ad manager for Fox NFL foot-ball. Thirty bids for ads on today’s game between the Packers and the Colts have been submitted. Information on these ads is given in the file P08_39.xlsx. For example, ad 1 is 23 seconds in length and will bring in $53,000 in revenues. During the
Assume that a consumer’s purchase decision on an electric razor is based on four attributes, each of which can be set at one of three levels (1, 2, or 3). Using conjoint analysis (a type of analysis used in marketing research), our analysts have divided the market into five segments (labeled as
An important problem in manufacturing is the assembly line balancing problem. When setting up a manufacturing line, activities must be assigned to workstations. The maximum time spent at a workstation is called the cycle time. Minimizing the cycle time translates to maximizing the number of items
Based on Meneses et al. (2004). A string is a list of characters such as “1differ%”. The length of the string is the number of characters in the string. The distance between two strings is the number of positions in which the two strings differ. For example, the distance between the strings
A company has nine jobs that must be assigned to three ordered workstations. The file P08_44.xlsxlists the times required for each job, which are independent of the workstations they are assigned to. It also lists precedence relationships between the jobs. For example, job 2 is a precedent of job
The discussion at the beginning of section 8.8 mentions Claritas. If you were in the direct-mail business, how would you use the information sold by Claritas to improve your profitability?
How would you use cluster analysis to help test market a consumer goods product?
Your company sells credit card services, and you are concerned with churn. Describe how you could use discriminant analysis to learn what distinguishes the customers who switch to another company from those who stay loyal to your company. How might you use such a model?
Your company provides credit to customers. Some of these customers default on their loans, with very negative implications for you. Describe how you could use discriminant analysis to learn what distinguishes the customers who default on their loans from those who pay back their loans. How might
Two construction companies are bidding against one another for the right to construct a new community center building in Bloomington, Indiana. The first construction company, Fine Line Homes, believes that its competitor, Buffalo Valley Construction, will place a bid for this project according to
When you use a RISKSIMTABLE function for a decision variable, such as the order quantity in the Walton model, explain how this provides a “fair” comparison across the different values tested.
In the quantity discount model in Example 12.2, the minimum total annual cost is region 3 is clearly the best. Evidently, the larger unit purchase costs in the other two regions make these two regions unattractive. When would a switch take place? To answer this question, change the model slightly.
Equation (12.4) shows the optimal order quantity for the no-shortage model. Calculus can also be used to find the optimal order quantity and optimal maximum backlog for the EOQ model with shortages allowed. The optimal order quantity is Q*SQRT((s + ic)/(ic + sp/(s + p))) where Q is the value from
As stated in Example 12.5, the critical fractile analysis is useful for finding the optimal order quantity, but it doesn’t (at least by itself) show the probability distribution of net profit. Use @RISK, as in Chapter 10, to explore this distribution. Actually, do it twice, once with the
Consider each change to the monetary inputs (the unit cost, the unit price, and the unit refund) one at a time in Example 12.5. For each such change, either up or down, describe how the cost of under-stocking and the cost of overstocking change, how the critical fractile changes, and how the
You saw in Example 12.5 that the optimal order quantities with the triangular and normal demand distributions are very similar (171 versus 174). Perhaps this is because these two distributions, with the parameters used in the example, have similar shapes. Explore whether this similarity in optimal
Change the model in the file R,Q Policy 2.xlsx slightly to allow a random lead time with a given mean and standard deviation. If the mean lead time is two weeks, and the standard deviation of lead time is half a week, find the optimal solution if the company desires a fill rate of 98.5%. Explain
In the first (R,Q) model in Example 12.6, the one with a shortage cost, we let both Q and the multiple k be changing cells. However, we stated that the optimal Q depends mainly on the fixed ordering cost, the holding cost, and the expected annual demand. This implies that a good approximation to
In both (R,Q) models, the one with a shortage cost and the one with a service level constraint, we set up Solver so that the multiple k is constrained to be nonnegative. The effect is that the reorder point R will be no less than the mean demand during lead time, and the expected safety stock will
In Example 12.6, we discussed the equivalence between the model with shortage costs and the model with a service level constraint. We also showed how to illustrate this equivalence with SolverTable. Extend the SolverTable in the R,Q Policy 1.xlsx file, with the unit shortage cost as the single
We claimed that the critical fractile formula, Equation (12.8), is appropriate because the optimal Q should satisfy cunder[1 – F(Q)] = cover F(Q), that is, the cost of understocking times the probability of under-stocking should equal the cost of overstocking times the probability of
Turn the previous problem around. Now assume that the store’s service level requirement obligates it to meet customer demand on 99% of all order cycles. In other words, use model 4. What (R,Q) policy should it use? Then find the (approximate) model 3 cost parameter (the cost per cycle with a
The problem in Example 12.8 assumes that the heaviest demand occurs in the second (post-April) phase of selling. It also assumes that capacity is higher in the second production opportunity than in the first. Suppose the situation is reversed, so that the higher capacity and most of the demand
The multiechelon inventory model in Example 12.9 requires about 595 items of on-hand or pipeline inventory, on average, to satisfy the fill rate constraint, even though the mean total demand per week is only 450. See how this changes as the amount of uncertainty decreases. Specifically, make the
A bakery that orders cartons of bread mix has used an EOQ model to determine that an order quantity of 90 cartons per order is economically optimal. The bakery needs 150 cartons per month to meet demand. It takes L days for the bakery’s supplier to deliver an order. When should the bakery place
Consider the basic EOQ model. We want to know the sensitivity of (1) the optimal order quantity, (2) the sum of the annual order cost and the annual holding cost (not including the annual purchase cost cD), and (3) the time between orders to various parameters of the problem.a. How do (1), (2), and
The efficiency of an inventory system is often measured by the turnover ratio.(TR), defined by TR = Cost of goods sold per year / Average value of on hand inventorya. Does a high turnover ratio indicate an efficient inventory system?b. If the EOQ model is being used, determine TR in terms of K, D,
A consulting firm is trying to determine how to minimize the annual costs associated with purchasing high-quality paper for its printers. Each time an order is placed, an ordering cost of $50 is incurred. The price per ream of printer paper depends on Q, the number of reams ordered, as shown in the
Showing 2300 - 2400
of 2541
First
12
13
14
15
16
17
18
19
20
21
22
23
24
25
26
Step by Step Answers