New Semester Started
Get
50% OFF
Study Help!
--h --m --s
Claim Now
Question Answers
Textbooks
Find textbooks, questions and answers
Oops, something went wrong!
Change your search query and then try again
S
Books
FREE
Study Help
Expert Questions
Accounting
General Management
Mathematics
Finance
Organizational Behaviour
Law
Physics
Operating System
Management Leadership
Sociology
Programming
Marketing
Database
Computer Network
Economics
Textbooks Solutions
Accounting
Managerial Accounting
Management Leadership
Cost Accounting
Statistics
Business Law
Corporate Finance
Finance
Economics
Auditing
Tutors
Online Tutors
Find a Tutor
Hire a Tutor
Become a Tutor
AI Tutor
AI Study Planner
NEW
Sell Books
Search
Search
Sign In
Register
study help
business
probability statistics
The Practice Of Statistics For Business And Economics 3rd Edition David S. Moore, George P. McCabe, Layth C. Alwan, Bruce A. Craig, William M. Duckworth - Solutions
Interview potential customers. You have been hired by a company that is planning to build a new apartment complex for students in a college town. They want you to collect information about preferences of potential customers for their complex.Most of the college students who live in apartments live
Identify the populations. For each of the following sampling situations, identify the population as exactly as possible.That is, say what kind of individuals the population consists of and say exactly which individuals fall in the population. If the information given is not complete, complete the
Popularity of news personalities can affect market share. A Gallup Poll conducted telephone interviews with 1001 U.S. adults aged 18. One of the questions asked whether the respondents had a favorable or an unfavorable opinion of 17 news personalities. Diane Sawyer received the highest rating,
Importance of students as customers. A committee on community relations in a college town plans to survey local businesses about the importance of students as customers. From telephone book listings, the committee chooses 150 businesses at random. Of these, 73 return the questionnaire mailed by the
What’s wrong? Explain what is wrong with each of the following random selection procedures and explain how you would do the randomization correctly.(a) To determine the reading level of an introductory statistics text, you evaluate all of the written material in the third chapter.(b) You want to
What’s wrong? Explain what is wrong in each of the following scenarios.(a) The population consists of all individuals selected in a simple random sample.(b) In a poll of an SRS of residents in a local community, respondents are asked to indicate the level of their concern about the dangers of
Make it an experiment! In the following observational studies, describe changes that could be made to the data collection process that would result in an experiment rather than an observational study. Also, offer suggestions about unseen biases or lurking variables that may be present in the
Ring-no-answer. Acommon form of nonresponse in telephone surveys is “ringno-answer.” That is, a call is made to an active number, but no one answers. Some of these numbers probably have caller ID where people can choose not to answer calls from people that they do not know. The Italian National
Random digit dialing. The list of individuals from which a sample is actually selected is called the sampling frame. Ideally, the frame should include every individual in the population, but in practice this is often difficult. A frame that leaves out part of the population is a common source of
Sampling by accountants. Accountants use stratified samples during audits to verify a company’s records of such things as accounts receivable. The stratification is based on the dollar amount of the item and often includes 100% sampling of the largest items. One company reports 5000 accounts
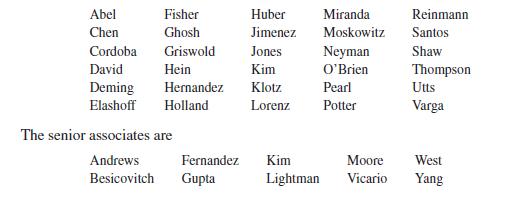
Who goes to the market research workshop? A small advertising firm has 30 junior associates and 10 senior associates. The junior associates areThe firm will send 4 junior associates and 2 senior associates to a workshop on current trends in market research. It decides to choose those who will go by
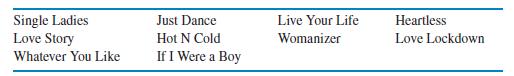
Listen to three songs. The walk to your statistics class takes about 10 minutes, about the amount of time needed to listen to three songs on your iPod. You decide to take a simple random sample of songs from the top 10 songs listed on the Billboard Hot 100.12 Here is the list:Select the three songs
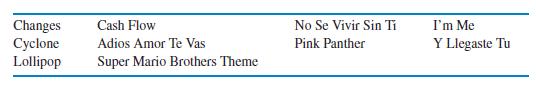
Ringtones for cell phones. You decide to change the ringtones for your cell phone by choosing 2 from a list of the 10 most popular ringtones.11 Here is the list:Select your 2 ringtones using a simple random sample. Changes Cash Flow Cyclone Adios Amor Te Vas Lollipop Super Mario Brothers Theme No
Market segmentation and movie ratings. You wonder if that new “blockbuster”movie is really any good. Some of your friends like the movie, but you decide to check the Internet Movie Database (imdb.com) to see others’ ratings. You find that 2497 people chose to rate this movie, with an average
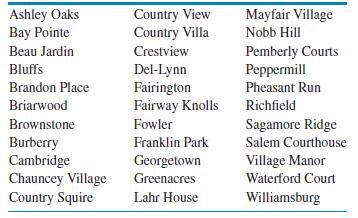
What is the population? For each of the following sampling situations, identify the population as exactly as possible. That is, say what kind of individuals the population consists of and say exactly which individuals fall in the population. If the information given is not sufficient, complete the
Sampling women in the workforce. A sociologist wants to know the opinions of employed adult women about government funding for day care. She obtains a list of the 520 members of a local business and professional women’s club and mails a questionnaire to 100 of these women selected at random. Only
Taxes and forestland usage. A study was designed to assess the impact of taxes on forestland usage in part of the Upper Wabash River Watershed in Indiana.10 A survey was sent to 772 forest owners from this region and 348 were returned. Consider the population, the sample, and the response rate for
Job satisfaction. A research team wanted to examine the relationship between employee participation in decision making and job satisfaction in a company. They are planning to randomly select 300 employees from a list of 2500 employees in the company. The Job Descriptive Index (JDI) will be used to
Does job training work? A state institutes a job-training program for manufacturing workers who lose their jobs. After five years, the state reviews how well the program works. Critics claim that because the state’s unemployment rate for manufacturing workers was 6% when the program began and 10%
Teaching economics. An educational software company wants to compare the effectiveness of its computer animation for teaching about supply, demand, and market clearing with that of a textbook presentation. The company tests the economic knowledge of each of a group of first-year college students,
Gender and consumer choices. Men and women differ in their choices for many product categories. Are there gender differences in preferences for health insurance plans as well? A market researcher interviews a large sample of consumers, both men and women. She asks each consumer which of two health
Violent acts on prime-time TV. A typical hour of prime-time television shows three to five violent acts. Linking family interviews and police records shows a clear association between time spent watching TV as a child and later aggressive behavior.3 Explain why this is an observational study rather
H1N1 vaccines. A report issued by the Centers for Disease Control and Prevention stated that among 120 adults who received an injection of a monovalent H1N1 influenza A vaccine, 116, or 97%, had an effective response by three weeks after the vaccination. They also reported that the rates of adverse
Find a sample survey that relates to business. Use the Internet or some printed material to find an example of a sample survey that relates to business and interests you.Describe the population, how the sample was collected, and some of the conclusions.
Reliability of a product. A friend has driven a Toyota Camry for more than 200,000 miles with only the usual service maintenance expenses. Explain why not all Camry owners can expect this kind of performance.
Preference for a brand. Ashley is a hard-core runner. She and all her friends prefer Powerade Ion4© to Gatorade©. Explain why Ashley’s experience is not good evidence that most young people prefer Powerade to Gatorade.
Describe a business anecdote. Find an example from some recent experience where anecdotal evidence is used to make a business decision that is not justified.Describe the example and explain why the evidence should not be used in this way.
Is this good market research? You and your friends are big fans of “Waverly Place,” a Disney Channel show about a family with three children who are training to be wizards. To what extent do you think you can generalize your preference for this show to all students at your college?
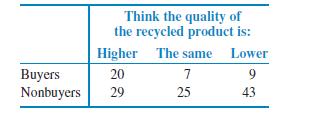
Recycled product quality. Recycling is supposed to save resources. Some people think recycled products are lower in quality than other products, a fact that makes recycling less practical.People who actually use a recycled product may have different opinions from those who don’t use it. Here are
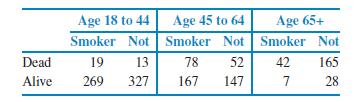
More smokers live at least 20 more years! You can see the headlines “More smokers than nonsmokers live at least 20 more years after being contacted for study!” A medical study contacted randomly chosen people in a district in England. Here are data on the 1314 women contacted who were either
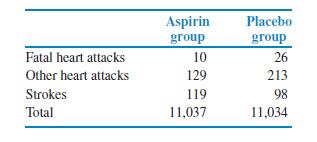
Aspirin and heart attacks. Does taking aspirin regularly help prevent heart attacks? “Nearly five decades of research now link aspirin to the prevention of stroke and heart attacks.” So says the Bayer AspirinWeb site, www.bayeraspirin.com. The most important evidence for this claim comes from
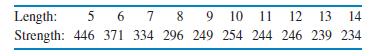
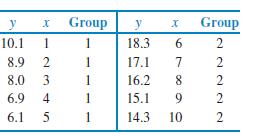
Wood products. A wood product manufacturer is interested in replacing solid-wood building material by less-expensive products made from wood flakes.35 The company collected the following data to examine the relationship between the length(in inches) and the strength (in pounds per square inch) of
A computer game. A multimedia statistics learning system includes a test of skill in using the computer’s mouse.The software displays a circle at a random location on the computer screen. The subject clicks in the circle with the mouse as quickly as possible. A new circle appears as soon as the
What correlation doesn’t say. Investment reports now often include correlations. Following a table of correlations among mutual funds, a report adds: “Two funds can have perfect correlation, yet different levels of risk. For example, Fund A and Fund B may be perfectly correlated, yet Fund A
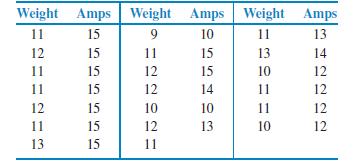
Circular saws. The table in the previous exercise gives the weight (in pounds) and amps for 19 circular saws. The data contain only five different amp ratings among the 19 saws.(a) Calculate the correlation between the weights and the amps of the 19 saws.(b) Calculate the average weight of the saws
Circular saws. The following table gives the weight(in pounds) and amps for 19 circular saws. Saws with higher amp ratings tend to also be heavier than saws with lower amp ratings.We can quantify this fact using regression.(a) We will use amps as the explanatory variable and weight as the response
Simpson’s paradox and regression. Simpson’s paradox occurs when a relationship between variables within groups of observations reverses when all of the data are combined. The phenomenon is usually discussed in terms of categorical variables, but it also occurs in other settings. Here is an
Endangered animals and habitat. Endangered animal species often live in isolated patches of habitat. If the population size in a patch varies a lot (due to weather, for example), the species is more likely to disappear from that patch in a bad year.Here is a general question: Is there less
Look at the data for men. Refer to the previous exercise.Analyze the data for the men’s team from the same college and compare your results with those for the women.
Points scored inwomen’s basketball games. Use the Internet to find the scores for the past season’s women’s basketball team at a college of your choice. Is there a relationship between the points scored by your chosen team and the points scored by their opponents? Summarize the data and write
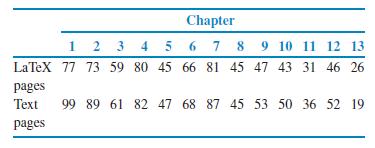
Planning for a new product. The editor of a statistics text would like to plan for the next edition. A key variable is the number of pages that will be in the final version. Text files are prepared by the authors using a word processor called LaTeX, and separate files contain figures and tables.
The education level of your customers. Refer to the previous exercise. The BRFSS data set contains a variable called EdCollege, the proportion of adults who have completed college.(a) Plot the data with Fruits and Vegetables on the x axis and EdCollege on the y axis. Describe the overall pattern of
Know your customers. Fruits and vegetables are marketed with a heavy emphasis on their health benefits. What are the profiles of those who eat the recommended quantities and those who do not? The Centers for Disease Prevention and Control(CDC) Behavior Risk Factor Surveillance System
Marketing your college. Colleges compete for students, and many students do careful research when choosing a college. One source of information is the rankings compiled by U.S. News & World Report. One of the factors used to evaluate undergraduate programs is the proportion of incoming students who
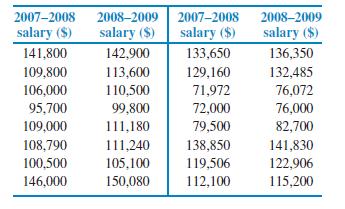
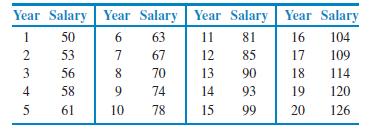
Bigger raises for those earning less. Refer to the previous two exercises. The 2007–2008 salaries do an excellent job of predicting the 2008–2009 salaries. Is there anything more that we can learn from these data? In this department there is a tradition of giving higher-than-average percent
Find the line and examine the residuals. Refer to the previous exercise.(a) Find the least-squares regression line for predicting 2008–2009 salaries from 2007–2008 salaries.(b) Analyze the residuals, paying attention to any outliers or influential observations. Write a summary of your findings.
Faculty salaries. Data on the salaries of a sample of professors in a mathematics department at a large Midwest university are given below. The salaries are for the academic years 2007–2008 and 2008–2009. DATADATA(a) Construct a scatterplot with the 2008–2009 salaries on the vertical axis and
Predict some salaries. The individual whose salary we have been studying in Exercises 2.134 to 2.136 wants to do some financial planning. Specifically, she would like to predict her salary 5 years into the future, that is, for Year 25. She is willing to assume that her employment situation will be
Try logs. Refer to the previous two exercises. Figure 2.31 is a scatterplot with the least-squares regression line for log salary versus year. For this model, r 2 = 0.9995. DATADATA(a) Compare this plot with Figure 2.29. Write a short summary of the similarities and the differences.(b) Figure 2.32
Look at the residuals. Refer to the previous exercise.Figure 2.30 is a plot of the residuals versus year. DATADATA RAISES(a) Interpret the residual plot.(b) Explain howthis plot highlights the deviations from the leastsquares regression line that you can see in Figure 2.29.
Salaries and raises. For this exercise we consider a hypothetical employee who starts working in Year 1 at a salary of $50,000. Each year her salary increases by approximately 5%. By Year 20, she is earning $126,000. The table below gives her salary for each year (in thousands of dollars):(a)
Sales and production. Refer to the previous two exercises.(a) Make a scatterplot with sales as the response variable and production as the explanatory variable. Describe the relationship.Are there any outliers or influential observations?(b) Find the least-squares regression line and add it to your
Dwelling permits and production. Refer to the previous exercise.(a) Make a scatterplot with production as the response variable and permits issued for new dwellings as the explanatory variable.Describe the relationship. Are there any outliers or influential observations?(b) Find the least-squares
Dwelling permits and sales for 21 European countries.The Organization for Economic Co-operation and Development(OECD) collects data on Main Economic Indicators (MEIs) for many countries. Each variable is recorded as an index with the year 2000 serving as a base year. This means that the variable
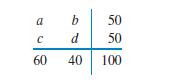
Find the table. Here are the row and column totals for a two-way table with two rows and two columns:Find two different sets of countsa, b,c, and d for the body of the table that give these same totals. This shows that the relationship between two variables cannot be obtained from the two
Obesity and health. Recent studies have shown that earlier reports underestimated the health risks associated with being overweight. The error was due to overlooking lurking variables.In particular, smoking tends both to reduce weight and to lead to earlier death. Illustrate Simpson’s paradox by
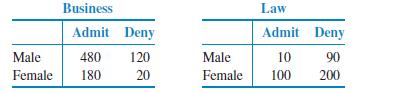
Discrimination? Wabash Tech has two professional schools, business and law. Here are two-way tables of applicants to both schools, categorized by gender and admission decision.(Although these data are made up, similar situations occur in reality.)(a) Make a two-way table of gender by admission
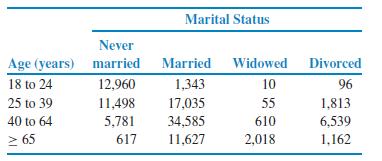
Demographics and new products—men. Refer to Exercise 2.125. Here are the corresponding counts for men:Answer the questions from Exercise 2.125 for these counts. Never Marital Status Age (years) married Married Widowed Divorced 18 to 24 12,960 1,343 10 96 25 to 39 11,498 17,035 55 1,813 40 to 64
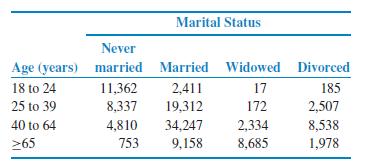
Demographics, continued.(a) Using the data in the previous exercise, compare the conditional distributions of marital status for women aged 18 to 24 and women aged 40 to 64. Briefly describe the most important differences between the two groups of women, and back up your description with
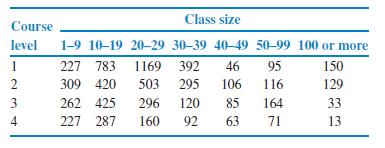
Demographics and new products. Companies planning to introduce a new product to the market must define the “target”for the product. Who do we hope to attract with our new product?Age and gender are two of the most important demographic variables.The following two-way table describes the age and
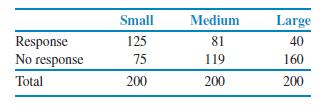
Nonresponse in a survey of companies. A business school conducted a survey of companies in its state. They mailed a questionnaire to 200 small companies, 200 medium-sized companies, and 200 large companies. The rate of nonresponse is important in deciding how reliable survey results are. Here are
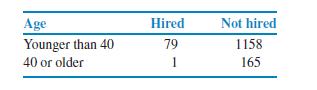
Hiring practices. A company has been accused of age discrimination in hiring for operator positions. Lawyers for both sides look at data on applicants for the past 3 years. They compare hiring rates for applicants younger than 40 years and those 40 years or older.(a) Find the two conditional
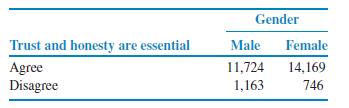
Trust and honesty in the workplace. The students surveyed in the study described in the previous exercise were also asked whether they thought trust and honesty were essential in business and the workplace. Here are the counts classified by gender:Answer the questions given in the previous exercise
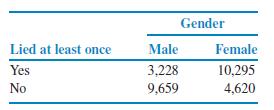
Lying to a teacher. One of the questions in a survey of high school students asked about lying to teachers.27 The table below gives the numbers of students who said that they lied to a teacher at least once during the past year, classified by gender.(a) Add the marginal totals to the table.(b)
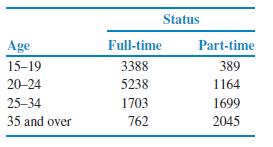
Condition on age. Refer to the previous exercise.(a) For each age group compute the percent of students who are full-time and the percent of students who are part-time.(b) Make a graphical display of the results that you found in part (a).(c) In a short paragraph, describe the relationship between
Full-time and part-time college students. The Census Bureau provides estimates of numbers of people in the United States classified in various ways.26 Let’s look at college students.The following table gives us data to examine the relation between age and full-time or part-time status. The
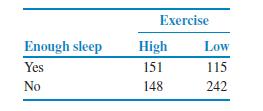
Adequate sleep and exercise. Refer to the previous exercise.(a) Find the distribution of exercise for those who get adequate sleep.(b) Do the same for those who do not get adequate sleep.(c) Write a short summary of the relationship between adequate sleep and exercise using the results of parts (a)
Exercise and adequate sleep. A survey of 656 boys and girls who were 13 to 18 years old asked about adequate sleep and other health-related behaviors. The recommended amount of sleep is six to eight hours per night.25 In the survey 54% of the respondents reported that they got less than this amount
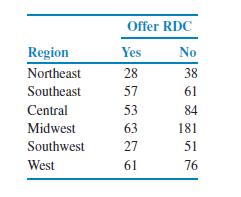
HowdoesRDCvary across the country? The survey described in the previous exercise also classified community banks by region. Here is the 6 × 2 table of counts.Summarize the results of this survey question numerically and graphically. Write a short paragraph explaining the relationship between the
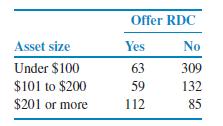
Remote deposit capture. The Federal Reserve has called remote deposit capture (RDC) “the most important development the (U.S) banking industry has seen in years.” This service allows users to scan checks and to transmit the scanned images to a bank for posting.22 In its annual survey of
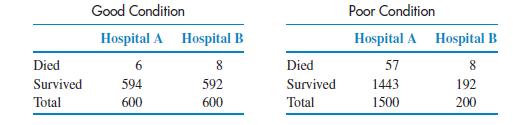
Patients in “poor” or “good” condition. Not all surgery cases are equally serious, however. Patients are classified as being in either “poor” or “good” condition before surgery. Here are the data broken down by patient condition. Check that the entries in the original two-way table
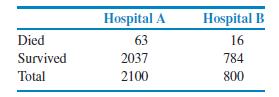
Which hospital is safer? Insurance companies and consumers are interested in the performance of hospitals. The government releases data about patient outcomes in hospitals that can be useful in making informed health care decisions. Here is a two-way table of data on the survival of patients after
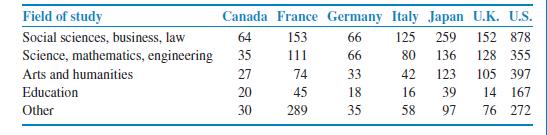
Compare the two analytical approaches. In the previous two exercises you examined the relationship between country and field of study in two different ways.(a) Compare these two approaches.(b) Which do you prefer? Give a reason for your answer.(c) What kinds of questions are most easily answered by
Countries by fields of study for college students. Refer to the previous exercise.Answer the same questions for the conditional distribution of country for each field of study.
Fields of study by country for college students. In Exercise 2.105 you examined data on fields of study for graduating college students from seven countries.(a) Find the seven conditional distributions giving the distribution of graduates in the different fields of study for each country.(b)
Compare the conditional distributions. In Example 2.28 we found the distribution of sales by wine type when no music was playing. In Exercise 2.106 you found the distribution when French music was playing, and in Exercise 2.107 you found the distribution when Italian musicwas playing. Examine these
Conditional distribution when Italian music was playing.(a) Write down the column of counts that you need to compute the conditional distribution of the type of wine sold when Italian music was playing.(b) Compute this conditional distribution.(c) Display this distribution graphically.(d) Compare
Conditional distribution when French music was playing.(a) Write down the column of counts that you need to compute the conditional distribution of the type of wine sold when French music was playing.(b) Compute this conditional distribution.(c) Display this distribution graphically.(d) Compare
Fields of study for college students. The following table gives the number of students (in thousands) graduating from college with degrees in several fields of study for seven countries(a) Calculate the marginal totals and add them to the table.(b) Find the marginal distribution of country and give
Construct a two-way table. Construct a 2 × 3 table. Add the marginal totals and find the two marginal distributions.
Marginal distribution for type of music. Find the marginal distribution for the type of music. Display the distribution using a graph.
Do power lines cause cancer? It has been suggested that electromagnetic fields of the kind present near power lines can cause leukemia in children. Experiments with children and power lines are not ethical. Careful studies have found no association between exposure to electromagnetic fields and
Education and income. There is a strong positive correlation between years of schooling completed x and lifetime earnings y for American men. One possible reason for this association is causation: more education leads to higher-paying jobs.But lurking variables may explain some of the correlation.
Does your product help nursing-home residents? A group of college students believes that herbal tea has remarkable powers. To test this belief, they make weekly visits to a local nursing home, where they visit with the residents and serve them herbal tea. The nursing-home staff reports that after
Does your product have an undesirable side effect? People who use artificial sweeteners in place of sugar tend to be heavier than people who use sugar. Does this mean that artificial sweeteners cause weight gain? Give a more plausible explanation for this association.
Prices paid to producers and additional land for production. Continue your work on coffee prices and deforestation in Exercise 2.42 (page 98) and Exercise 2.76(page 114).(a) If the world coffee price settled at 60 cents per pound, what percent of the national park forest do you predictwould be
Marital status and income. Data show that married, divorced, and widowed men earn quite a bit more than men the same age who have never been married. This does not mean that a man can raise his income by getting married, because men who have never been married are different from married men in many
Older workers and income. The effect of a lurking variable can be surprising when individuals are divided into groups.Explain how, as a nation’s population grows older, mean income can go down for workers in each age group but still go up for all workers.
Use of the Internet and a long life. Exercise 2.22(page 90) asks the question “Will you live longer if you use the Internet?” Figure 2.13 (page 92) is a scatterplot of life expectancy in years versus Internet use for 181 countries. The scatterplot shows a positive association between these two
What’s wrong? Each of the following statements contains an error. Describe each error and explain why the statement is wrong.(a) High correlation implies causation.(b) An outlier will always have a small residual.(c) If we have data at values of x equal to 1, 2, 3, 4, and 5, and we try to predict
What’s wrong? Each of the following statements contains an error. Describe each error and explain why the statement is wrong.(a) If the residuals are all positive, this implies that there is a positive relationship between the response variable and the explanatory variable.(b) A negative
Do firefighters make fires worse? Someone says, “There is a strong positive correlation between the number of firefighters at a fire and the amount of damage the fire does. So sending lots of firefighters just causes more damage.” Explain why this reasoning is wrong.
Are big hospitals bad for you? Astudy shows that there is a positive correlation between the size of a hospital (measured by its number of beds x) and the median number of days y that patients remain in the hospital. Does this mean that you can shorten a hospital stay by choosing a small hospital?
How’s your self-esteem? People who do well tend to feel good about themselves.Perhaps helping people feel good about themselves will help them do better in their jobs and in life. For a time, raising self-esteem became a goal in many schools and companies. Can you think of explanations for the
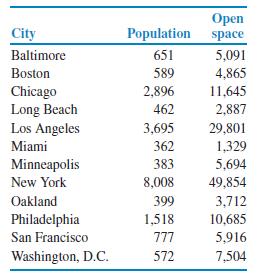
A different report card. Refer to Exercise 2.85. Prepare a report card based on the analysis of open space per person that you performed in Exercise 2.87. Write a short paragraph comparing this report card with the one that you prepared in Exercise 2.85.Which do you prefer? Give reasons for your
Open space per person. Refer to Exercises 2.84, 2.85, and 2.86. Open space in acres per person is an alternative way to report open space. Divide open space by population to compute the value of this variable for each city. Using this new variable as the response variable and population as the
Is New York an outlier? Refer to Exercises 2.84 and 2.85. Write a short paragraph about the data point corresponding to New York City. Is this point an outlier? Is it influential?Compare the analysis results with and without this observation.
Prepare the report card. Refer to the previous exercise.One way to compare cities with respect to the amount of open space that they have is to use the residuals from the regression analysis that you performed in the previous exercise.Cities with positive residuals are doing better than predicted,
Move your business here. City officials use a variety of tactics to encourage businesses to open offices in their city. One characteristic of a city that is viewed as desirable is open public space within the city limits. The New York City Open Accessible Space Information System Cooperative
Delete data for countries with low unemployment rates.Refer to the previous exercise. Delete the countries with log unemployment rates lower than 1.6. This corresponds to an unemployment rate of about 5%. Answer the questions given for the previous exercise and explain the effect of deleting the
Showing 1100 - 1200
of 8686
First
5
6
7
8
9
10
11
12
13
14
15
16
17
18
19
Last
Step by Step Answers