New Semester Started
Get
50% OFF
Study Help!
--h --m --s
Claim Now
Question Answers
Textbooks
Find textbooks, questions and answers
Oops, something went wrong!
Change your search query and then try again
S
Books
FREE
Study Help
Expert Questions
Accounting
General Management
Mathematics
Finance
Organizational Behaviour
Law
Physics
Operating System
Management Leadership
Sociology
Programming
Marketing
Database
Computer Network
Economics
Textbooks Solutions
Accounting
Managerial Accounting
Management Leadership
Cost Accounting
Statistics
Business Law
Corporate Finance
Finance
Economics
Auditing
Tutors
Online Tutors
Find a Tutor
Hire a Tutor
Become a Tutor
AI Tutor
AI Study Planner
NEW
Sell Books
Search
Search
Sign In
Register
study help
business
probability statistics
Essential Statistics For The Behavioral Sciences 2nd Edition Gregory J Privitera - Solutions
State which correlation coefficient (Pearson, Spearman, point-biserial, or phi) should be used to study each of the following factors:1. Activity (active, inactive) and depression (depressed, not depressed)2. Time spent at school and time spent studying in hours per week 3. Veteran (yes, no) and
State which correlation coefficient (Pearson, Spearman, point-biserial, or phi) should be used given the following information.1. Both factors are interval or ratio scale.2. Both factors are dichotomous.3. One factor is dichotomous, and the other factor is continuous.4. Both factors are ranked.
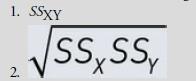
Describe what each of the following statistical terms measures: 1. SSXY 2. SSSS
What two values are added to the regression equation when a new predictor variable is added to the regression equation?
What statistical method includes two or more predictor variables in the equation of a regression line to predict changes in a criterion variable?
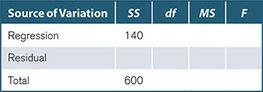
A college administrator measures the SAT scores and high school GPAs of 12 college applicants and computes an analysis of regression. Complete the F table for this analysis and state whether the decision is to retain or reject the null hypothesis. Source of Variation SS df MS F Regression 140
When we sum the value of SSregression and SSresidual, what value do we obtain?
Name the statistical procedure used to determine whether the equation of a straight line can be used to make predictions in a population.
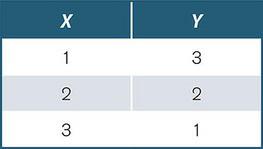
Assuming these data points have a linear pattern, make the following calculations to find the best-fitting line:1. Compute the slope.2. Compute the y-intercept.3. Write the equation of the regression line. X Y 1 3 23 2 1
The y-intercept is the value of Y when X equals __________________________.
The values of one factor increase as the values of a second factor decrease. Does this sentence describe a line with a positive slope or a negative slope?
The regression line, or best-fitting straight line to a set of data points, is the line associated with the smallest possible value of __________________.
The __________________ is a measure of the direction and strength of the linear relationship of two dichotomous factors on a nominal scale of measurement.
Name the correlation coefficient used to determine the direction and strength of the linear relationship between one factor that is continuous (on an interval or ratio scale of measurement) and another factor that is dichotomous (on a nominal scale of measurement).
Name the correlation coefficient used to determine the relationship between two ranked or ordinal factors.
The range of data for one or both factors in a sample is limited, compared to the range of data in the population from which the sample was selected. What is this problem called?
How can an outlier alter the relationship between two factors?
A researcher reports a significant positive correlation and concludes that spending more time writing a research paper will cause a better grade on the paper. Is this conclusion appropriate? Explain.
State three assumptions of tests for linear correlations.
State whether each of the following is significant for a study with a sample of 12 participants. Use a .05 level of significance and conduct a two-tailed test.1. r = −.55 2. r = +.78 3. r = −.60 4. r = +.48
State the coefficient of determination for (a) and (b) in Question 2.
Compute the Pearson correlation coefficient given the following data.1. SSXY = −53, SSX = 58, SSY = 255.20 2. SSXY = 3.8, SSX = 5.2, SSY = 5.2
Name the correlation coefficient used to measure the strength and direction of the linear relationship of two factors on an interval or ratio scale of measurement.
What happens to the value of r the closer that data points fall to the regression line?
Which of the following indicates the strongest correlation?1. r = −.57 2. r = +.78 3. r = −.90 4. r = +.88
An instructor reports that as the number of student interruptions during class decreases, student scores on in-class quizzes increase. Is this an example of a positive correlation or a negative correlation?
A researcher reports that the farther college students are from their parents, the more often they communicate with their parents (either by phone or by e-mail). Is this an example of a positive correlation or a negative correlation?
Distinguish between a predictor variable and a criterion variable.
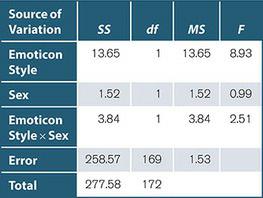
Emoticons (facial feedback) with e-learning. Tung and Deng (2007) studied how emoticons(computerized facial expressions) and sex influenced intrinsic motivation to complete a computer task. Emoticons were used as feedback for responses during the task. These faces were either static(presented still
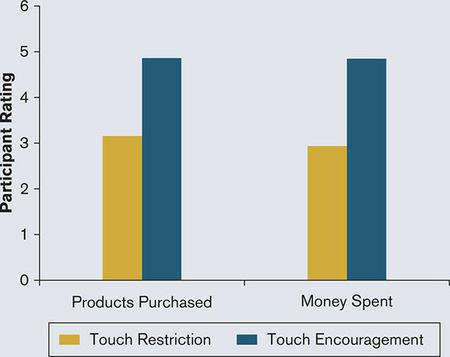
Touching while you shop. Otterbring (2016) tested individuals’ intuitions regarding how restricting versus encouraging touching a product during an in-store product demonstration should influence the number of products purchased and the amount of money spent. A summary for one finding reported in
Rodent species and sociality. Freitas, El-Hani, and da Rocha (2008) tested the hypothesis that rodent species (four different species) and sex (male, female) influence the level of affiliation acquired through social behavior. They measured the number of social behaviors exhibited by each rodent
The null hypothesis and test statistic for an ANOVA. The null hypothesis for an ANOVA states that the group means are not different. In terms of the population means, van Rossum, van de Schoot, and Hoijtink (2013) stated the following null hypothesis for an ANOVA with four group means: H0: μ1 =
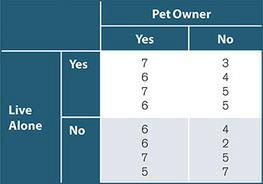
Among other benefits, pets are thought to be great companions that increase satisfaction among pet owners, especially those who would otherwise live alone. A psychologist decides to test this notion. Participants who live with others or alone (Factor A: living status) and own pets or do not(Factor
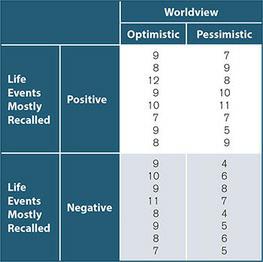
Evidence suggests that those with an optimistic worldview tend to be happier than those with a pessimistic worldview. One potential explanation for this is that optimists tend to ignore negative events and outcomes more so than pessimists. To test this explanation, participants were assessed and
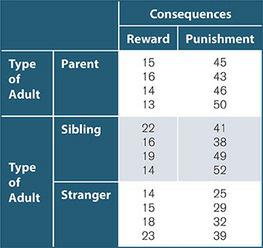
A developmental psychologist placed children in a social situation in which they were either rewarded or punished (Factor A: consequence) by a parent, sibling, or stranger (Factor B: type of adult). Following this social situation, children were placed back in the same social situation, and the
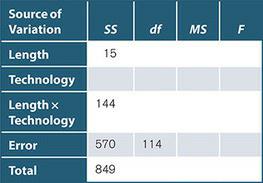
In an effort to promote a new product, a marketing firm asks participants to rate the effectiveness of ads that varied by length (short, long) and by type of technology (static, interactive).Higher ratings indicated greater effectiveness.1. Complete the F table and make a decision to retain or
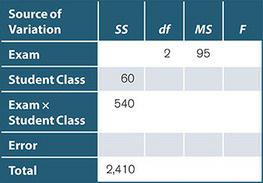
Students (freshmen, sophomores, juniors, and seniors) at a local college who were in the same statistics class were given one of three tests (recall, recognition, or a mix of both). Test grades for each participant (n = 10) were recorded. Complete the F table for this study. Source of Variation SS
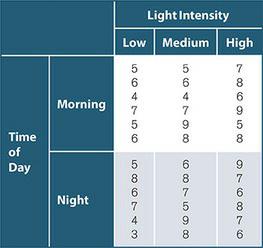
Seasonal affective disorder (SAD) is a type of depression during seasons with less daylight (e.g., winter months). One therapy for SAD is phototherapy, which is increased exposure to light used to improve mood. A researcher tests this therapy by exposing a sample of patients with SAD to different
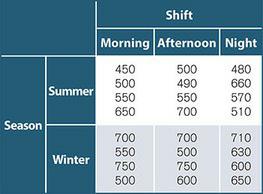
To better understand eating patterns that might contribute to obesity, a researcher measures the average number of calories (per meal) consumed by shift workers (morning, afternoon, night)during two seasons (summer and winter). The hypothetical results are given in the following table.1. Complete
For each of the following, state whether F = 0 for a main effect, the A × B interaction, or both.1. Cell means are equal.2. Row totals are equal.3. Column totals are equal.
A researcher reports a significant two-way between-subjects ANOVA, F(3, 40) = 2.96. State the decision to retain or reject the null hypothesis for this test.19. If the value of the mean square for Factor A increases, will the value of the test statistic for Factor A increase or decrease?
State the decision to retain or reject the null hypothesis for each of the following ANOVA tests at a .05 level of significance.1. F(3, 24) = 3.29 2. F(2, 40) = 3.00 3. F(1, 120) = 4.00 4. F(2, 60) = 3.10
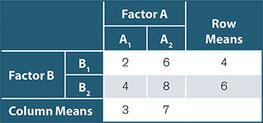
The following table summarizes the cell, column, and row means for a 2 × 2 ANOVA.1. Which means reflect a main effect for Factor A?2. Which means reflect a main effect for Factor B?3. Which means reflect the interaction between Factors A and B? Factor A Row A A Means B 2 6 Factor B B 4 8 6 Column
A social scientist asks a sample of male and female students to read a vignette describing an immoral act for reasons of preservation, protection, or self-gain. She measures moral reasoning among those sampled. Identify each factor and the levels of each factor in this example.
State the total number of groups for each of the following examples of a two-way betweensubjects ANOVA test.1. An industrial organizational psychologist records the initial evaluation reports for new employees from 2-year and 4-year colleges (Factor A: type of college) with low, medium, or high
When looking at a graph of an A × B interaction, describe the pattern that indicates that an interaction is possible.
A researcher conducts a 3 × 3 between-subjects ANOVA with 15 participants assigned to each cell or group.1. What is the total sample size in this study?2. How many cells or groups are in this study?
Suppose you construct a table with cells, rows, and columns to summarize each factor in a two-way ANOVA.1. Where are the main effects located in the table?2. Where is the interaction located in the table?
Define the following key terms: (a) cell, (b) main effect, and (c) interaction.
A 3 × 2 ANOVA includes how many factors?
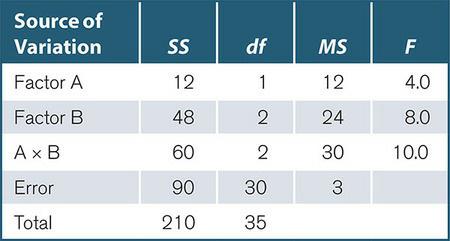
Which measure for proportion of variance is more conservative (eta-squared or omega-squared)? Source of Variation SS df MS F Factor A 12 1 12 4.0 Factor B 48 2 24 8.0 AxB 60 2 30 10.0 Error 90 30 3 Total 210 35
Using the data given in the following F table:1. Compute eta-squared for each hypothesis test.2. Compute omega-squared for each hypothesis test.
What is the next step for analyzing a significant main effect?
Which of the following is the next step to analyze a significant A × B interaction in a two-way betweensubjects ANOVA?1. Compute simple main effect tests 2. Compute pairwise comparisons 3. Compute a two-way ANOVA
Simple main effect tests compare mean differences or simple main effects of one factor at ________ of a second factor.
State the steps for analyzing an interaction.
Make a decision for each hypothesis test in Question 2.
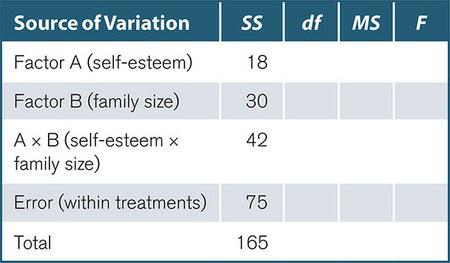
A researcher conducts a study to determine whether parents with different levels of self-esteem (low, high)and family size (1, 2, 3, 4, or 5 children) display different parenting styles. Six parents (n = 6 per cell)were observed using a between-subjects design. Based on the information given here
State four assumptions of the two-way between-subjects ANOVA. Source of Variation SS df MS F Factor A (self-esteem) 18 Factor B (family size) 30 Ax B (self-esteem x 42 family size) Error (within treatments) 75 Total 165
A researcher computes the two-way between-subjects ANOVA, and the results show a significant main effect and a significant interaction. Which significant result should the researcher analyze first?
What is the pattern in a graph that indicates that a significant interaction is possible?
What is the denominator for each hypothesis test in the two-way between-subjects ANOVA?
What are three sources of between-groups variation in the two-way between-subjects ANOVA?
A researcher measures stress in a group of participants who travel different distances to work (none, short commute, long commute) from different demographic areas (urban, rural). In this example:1. State the number of factors.2. State the number of levels of each factor.
State two reasons that we observe two factors in a single study.
Define and explain the following terms: cell, main effect, and interaction.
Describe how the complexity of the two-way ANOVA differs from that of the t tests and one-way ANOVAs.
Social comparisons and prosocial behavior. To check that a manipulation of social comparison made in the study was effective, Yip and Kelly (2013) computed a one-way betweensubjects ANOVA and reported the following result for one such check: F(2, 120) = 6.42. Based on the information given, answer
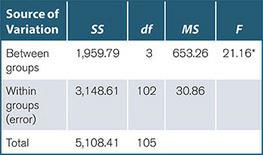
Computer anxiety and usage frequency. Using a rating scale, Tekinarslan (2008) measured computer anxiety among university students who use the computer very often, often, sometimes, and seldom. Below are the results of the one-way between-subjects ANOVA.1. What is the total sample size (N) and
Estimating effect size. Peng and Chen (2014) evaluated effect size estimates for various tests. In their paper, they stated that “The [two] popular effect size indices were found to be . . . Cohen’s d, and η2” (p. 43). Which effect size measure is reported with an ANOVA?
Power and the within-subjects design. In an article applying models that use repeated measures, Thomas and Zumbo (2012) identified that the within-subjects ANOVA “can have . . .high power” (p. 42). As also identified in this chapter for the one-way within-subjects ANOVA, state the three rules
The assumptions of an ANOVA test. In an article that explored alternatives for the one-way between-subjects ANOVA, Cribbie, Fiksenbaum, Keselman, and Wilcox (2012) explained that “the ANOVA can be a valid and powerful test for identifying treatment effects; but, when the assumptions underlying
The “ways” that participants are observed. Rouder, Morey, Verhagen, Swagman, and Wagenmakers (2016) evaluated the nature of various ANOVA designs. In their analysis, they stated, If a factor is manipulated in a [A] manner, then each participant observes one level of the factor. Conversely, if a
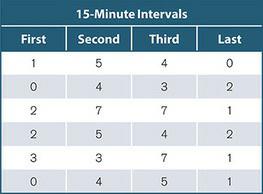
In a study on attention and performance of memory tasks, six participants attended a 1-hour lecture on a topic chosen at random. Following this lecture, they received a survey testing their knowledge of the topics covered. After each 15-minute interval of the lecture, participants were asked 10
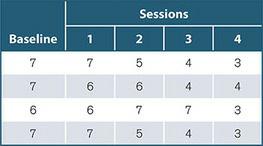
A child psychologist treated four children who were afraid of snakes with a behavioral modification procedure called systematic desensitization. In this procedure, children were slowly introduced to a snake over four treatment sessions. Children rated how fearful they were of the snake before the
A researcher is interested in how perceptions of climate change influence consumer spending.He selects a sample of 10 environmentalists with strong perceptions of climate change and has them report how much they spend on a variety of “typical” items. These items were categorized as detrimental,
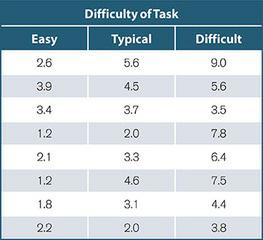
To test whether arousal or stress levels increase as the difficulty of a task increases, eight participants were asked to complete an easy, typical, or difficult task. Their galvanic skin response(GSR) was recorded. A GSR measures the electrical signals of the skin in units called
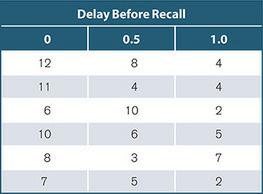
Iconic memory is a type of memory that holds visual information for about half a second (0.5 second). To demonstrate this type of memory, participants were shown three rows of four letters for 50 milliseconds. They were then asked to recall as many letters as possible, with a 0-, 0.5-, or
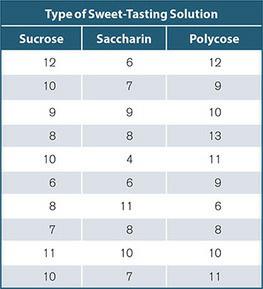
To test whether animal subjects consume the same amounts of sweet-tasting solutions, a researcher has 10 subjects consume one of three sweet-tasting solutions: sucrose, saccharin, or Polycose. The amount consumed (in milliliters) of each solution is given in the table for this between-subjects
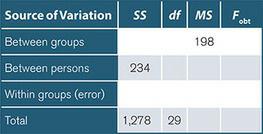
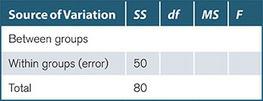
The following is an incomplete F table summarizing the results of a study of the variance of reaction times during a training exercise in a sample of 14 (n = 14) highly experienced, moderately experienced, and inexperienced athletes.1. Complete the F table for this between-subjects design.2.
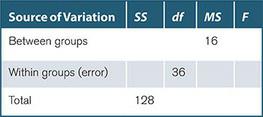
The following is an incomplete F table summarizing the results of a study of the variance of life satisfaction scores among unemployed, retired, part-time, and full-time employees.1. Complete the F table and make a decision to retain or reject the null hypothesis.2. Compute omega-squared (ω2).3.
State whether a post hoc test is necessary for each of the following results. Explain your answer for each result.1. F(1, 18) = 6.29, p < .05 2. F(4, 55) = 3.98, p < .05 3. F(2, 33) = 2.03, p > .05
What is the decision at a .05 level of significance for each of the following tests? Hint: Find the critical value for each test; then make a decision.1. F(3, 26) = 3.00 2. F(5, 20) = 2.54 3. F(4, 30) = 2.72 4. F(2, 12) = 3.81
State whether the following situations describe a between-subjects design or a within-subjects design.1. A biopsychologist tests the time course for the release of a neurohormone before, during, and following a task thought to cause its release.2. A sport psychologist compares mental functioning in
State the degrees of freedom error in each of the following between-subjects tests.1. A researcher tests how nervous public speakers get in front of a small, medium, or large audience. Ten participants are randomly assigned to each group.2. A high school counselor has 12 students in each of four
Which effect size measure, eta-squared or omega-squared, is a more conservative estimate of effect size?
What type of effect size measure is used for (a) a one-way between-subjects ANOVA and (b) a oneway within-subjects ANOVA?
Define the following terms:1. Sum of squares between groups 2. Sum of squares error 3. Mean square between groups 4. Mean square error
State in words the null hypothesis for a one-way ANOVA.
A researcher conducts a one-way ANOVA in which one independent variable has four levels.1. How many different groups are in this study?2. How many different factors are in this study?4. Name two sources of variation in the one-way between-subjects ANOVA.
A researcher conducts two studies. Study 1 uses a one-way between-subjects ANOVA, and Study 2 uses a within-subjects ANOVA. If the number of groups and participants per group are the same in each study, then in which study was the total number of participants larger? Explain.
Explain the meaning of the following terms for an ANOVA: (a) one-way, (b) between-subjects, (c)within-subjects.
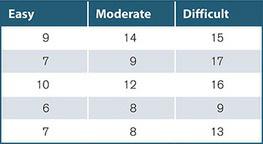
The following table lists data from a hypothetical study measuring the time (in seconds) it takes participants to complete each of three tasks (easy, moderate, difficult). Easy Moderate Difficult 9 14 15 7 17 10 167 12 16 8 9 8 13
Which estimate (partial eta-squared or partial omega-squared) gives a larger estimate of proportion of variance?
Make a decision given the following test statistic values for a one-way within-subjects ANOVA with 4 and 30 degrees of freedom.1. Fobt = 2.50 2. Fobt = 2.80 3. Fobt = 4.00
Given the following values, compute the F statistic: SSBG = 10, SSE = 25, dfBG = 2, dfE = 25.
State the four assumptions for the one-way within-subjects ANOVA.
Which source of error is removed from the denominator of the test statistic in the one-way withinsubjects ANOVA?
State the three sources of variation in the one-way within-subjects ANOVA.
How are participants observed using the within-subjects design?
Showing 1500 - 1600
of 8686
First
9
10
11
12
13
14
15
16
17
18
19
20
21
22
23
Last
Step by Step Answers