New Semester
Started
Get
50% OFF
Study Help!
--h --m --s
Claim Now
Question Answers
Textbooks
Find textbooks, questions and answers
Oops, something went wrong!
Change your search query and then try again
S
Books
FREE
Study Help
Expert Questions
Accounting
General Management
Mathematics
Finance
Organizational Behaviour
Law
Physics
Operating System
Management Leadership
Sociology
Programming
Marketing
Database
Computer Network
Economics
Textbooks Solutions
Accounting
Managerial Accounting
Management Leadership
Cost Accounting
Statistics
Business Law
Corporate Finance
Finance
Economics
Auditing
Tutors
Online Tutors
Find a Tutor
Hire a Tutor
Become a Tutor
AI Tutor
AI Study Planner
NEW
Sell Books
Search
Search
Sign In
Register
study help
business
statistical sampling to auditing
Principles Of Statistics For Engineers And Scientists 2nd International Edition William Navidi - Solutions
The article “Nutrient Deprivation Improves Field Performance of Woody Seedlings in a Degraded Semi-arid Shrubland” (R. Trubata, J. Cortina, and A. Vilagrosaa, Ecological Engineering, 2011:1164–1173) presents a study that investigated the effect of varying the type of fertilizer on the height
A study is made of the effect of curing temperature on the compressive strength of a certain type of concrete. Five concrete specimens are cured at each of four temperatures, and the compressive strength of each specimen is measured(in MPa). The results are as follows:Temperature (◦C) Strengths 0
The article referred to in Exercise 25 presents values for the dependent and independent variables for 10 additional construction jobs. These values are presented in Tables SE26A and SE26B.a. Using the equation constructed in part (a) of Exercise 25, predict the concrete quantity (y) for each of
The article “Estimating Resource Requirements at Conceptual Design Stage Using Neural Networks” (A. Elazouni, I.Nosair, et al., Journal of Computing in Civil Engineering, 1997:217–223) suggests that certain resource requirements in the construction of concrete silos can be predicted from a
The article “Seismic Hazard in Greece Based on Different Strong Ground Motion Parameters” (S. Koutrakis, G.Karakaisis, et al., Journal of Earthquake Engineering, 2002:75–109) presents a study of seismic events in Greece during the period 1978–1997. Of interest is the duration of “strong
The article “Lead Dissolution from Lead Smelter Slags Using Magnesium Chloride Solutions” (A. Xenidis, T. Lillis, and I. Hallikia, The Aus IMM Proceedings, 1999:37–44) discusses an investigation of leaching rates of lead in solutions of magnesium chloride. The data in the following table
The article “Low-Temperature Heat Capacity and Thermodynamic Properties of 1,1,1-trifluoro-2, 2-dichloroethane”(R. Varushchenko and A. Druzhinina, Fluid Phase Equilibria, 2002:109–119) presents measurements of the molar heat capacity (y) of 1,1,1-trifluoro-2,2-dichloroethane (in J⋅ K−1
The article “Groundwater Electromagnetic Imaging in Complex Geological and Topographical Regions: A Case Study of a Tectonic Boundary in the French Alps” (S. Houtot, P. Tarits, et al., Geophysics, 2002:1048–1060) presents measurements of concentrations of several chemicals (in mmol/L) and
The article “Electrical Impedance Variation with Water Saturation in Rock” (Q. Su, Q. Feng, and Z. Shang, Geophysics, 2000:68–75) reports measurements of permeabilities (in 10−3????m2), porosities (in %), and surface area per unit volume of pore space (in 104 cm−1) for several rock
The data presented in the following table give the tensile strength in psi (y) of paper as a function of the percentage of hardwood content (x).Hardwood Tensile Hardwood Tensile Content Strength Content Strength 1.0 26.8 7.0 52.1 1.5 29.5 8.0 56.1 2.0 36.6 9.0 63.1 3.0 37.8 10.0 62.0 4.0 38.2 11.0
The voltage output (y) of a battery was measured over a range of temperatures (x) from 0◦C to 50◦C. The following figure is a scatterplot of voltage versus temperature, with three fitted curves superimposed. The curves are the linear model y = ????0+????1x+????, the quadratic model y =
In a simulation of 30 mobile computer networks, the average speed, pause time, and number of neighbors were measured. A “neighbor” is a computer within the transmission range of another. The data are presented in the following table.Neighbors Speed Pause Neighbors Speed Pause Neighbors Speed
An engineer tries three different methods for selecting a linear model. First she uses an informal method based on the F statistic, as described in Section 8.4. Then she runs the best subsets routine, and finds the model with the best adjusted R2 and the one with the best Mallows Cp. It turns out
Refer to Exercise 13.a. Find a 95% confidence interval for the coefficient of Oxygen.b. Find a 99% confidence interval for the coefficient of Nitrogen.c. Find a 98% confidence interval for the coefficient of the interaction term Oxygen ⋅ Nitrogen.d. Can you conclude that ????1 < −75? Find the
The article “Advances in Oxygen Equivalence Equations for Predicting the Properties of Titanium Welds”(D. Harwig, W. Ittiwattana, and H. Castner, The Welding Journal, 2001:126s–136s) reports an experiment to predict various properties of titanium welds. Among other properties, the elongation
The article “Two Different Approaches for RDC Modelling When Simulating a Solvent Deasphalting Plant”(J. Aparicio, M. Heronimo, et al., Computers and Chemical Engineering, 2002:1369–1377) reports flow rate (in dm3/h) and specific gravity measurements for a sample of paraffinic hydrocarbons.
The article “Low-Temperature Heat Capacity and Thermodynamic Properties of 1,1,1-trifluoro-2,2-dichloroethane”(R. Varushchenko and A. Druzhinina, Fluid Phase Equilibria, 2002:109–119) describes an experiment in which samples of Freon R-123 were melted in a calorimeter. Various quantities of
During the production of boiler plate, test pieces are subjected to a load, and their elongations are measured. In one particular experiment, five tests will be made, at loads (in MPa) of 11, 37, 54, 70, and 93. The least-squares line will be computed to predict elongation from load. Confidence
Refer to Exercise 8. Someone wants to compute a 95% confidence interval for the mean runoff when the rainfall is 3 in. Can this be computed from the information in the MINITAB output shown in Exercise 8? Or is more information needed? Choose the best answer.i. Yes, it can be computed from the
The article “Approach to Confidence Interval Estimation for Curve Numbers” (R. McCuen, Journal of Hydrologic Engineering, 2002:43–48) discusses the relationship between rainfall depth and runoff depth at several locations.At one particular location, rainfall depth and runoff depth were
A chemist is calibrating a spectrophotometer that will be used to measure the concentration of carbon monoxide(CO) in atmospheric samples. To check the calibration, samples of known concentration are measured. The true concentrations (x) and the measured concentrations (y) are given in the
Refer to Exercise 5.a. Plot the residuals versus the fitted values. Does the plot indicate any serious violations of the standard assumptions?b. Plot the residuals versus the order of the data. Does the plot indicate any serious violations of the standard assumptions?
Eruptions of the Old Faithful geyser in Yellowstone National Park typically last from 1.5 to 5 minutes. Between eruptions are dormant periods, which typically last from 50 to 100 minutes. A dormant period can also be thought of as the waiting time between eruptions. The durations in minutes for 60
A materials scientist is experimenting with a new material with which to make beverage cans. She fills cans with liquid at room temperature, and then refrigerates them to see how fast they cool. According to Newton’s law of cooling, if t is the time refrigerated and y is the temperature drop at
The article “Copper Oxide Mounted on Activated Carbon as Catalyst for Wet Air Oxidation of Aqueous Phenol. 1.Kinetic and Mechanistic Approaches” (P. Alvarez, D. McLurgh, and P. Plucinski, Industrial Engineering and Chemistry Research, 2002: 2147–2152) reports the results of experiments to
The article “Optimization of Medium Composition for Lipase Production by Candida rugosa NCIM 3462 Using Response Surface Methodology” (A. Ragendran and V. Thangavelu, Canadian Journal of Microbiology, 2007:643–655) describes a series of experiments in which lipase was produced from a
The article “A Robust Optimization Approach for the Capacitated Vehicle Routing Problem with Demand Uncertainty” (I. Sungur, F. Ordo´nez, and M. Dessouky, ˜ IIE Transactions, 2008:509–523) discusses methods to reduce transportation costs while satisfying demands. In one study, the percent
The article “Models for Assessing Hoisting Times of Tower Cranes” (A. Leung and C. Tam, Journal of Construction Engineering and Management, 1999:385–391) presents a model constructed by a stepwise regression procedure to predict the time needed for a tower crane hoisting operation. Twenty
The article “Modeling Resilient Modulus and Temperature Correction for Saudi Roads” (H. Wahhab, I. Asi, and R. Ramadhan, Journal of Materials in Civil Engineering, 2001:298–305) describes a study designed to predict the resilient modulus of pavement from physical properties. The following
The following table presents measurements of mean noise levels in dBA (y), roadway width in m (x1), and mean speed in km/h (x2), for 10 locations in Bangkok, Thailand, as reported in the article “Modeling of Urban Area Stop-and-Go Traffic Noise” (P. Pamanikabud and C. Tharasawatipipat, Journal
The article “Vehicle-Arrival Characteristics at Urban Uncontrolled Intersections” (V. Rengaraju and V. Rao, Journal of Transportation Engineering, 1995:317–323) presents data on traffic characteristics at 10 intersections in Madras, India. The following table provides data on road width in m
In rock blasting, the peak particle velocity (PPV) depends both on the distance from the blast and on the amount of charge. The article “Prediction of Particle Velocity Caused by Blasting for an Infrastructure Excavation Covering Granite Bedrock” (A. Kahriman, Mineral Resources Engineering,
(Continues Exercise 7 in Section 8.3.) To try to improve the prediction of FEV1, additional independent variables are included in the model. These new variables are Weight (in kg), the product (interaction) of Height and Weight, and the ambient temperature (in ◦C). The following MINITAB output
In a study to determine the effect of vehicle weight in tons (x1) and engine displacement in in3 (x2) on fuel economy in miles per gallon (y), these quantities were measured for ten automobiles. The full quadratic model y = ????0+ ????1x1 +????2x2 + ????3x2 1 + ????4x2 2 + ????5x1x2 + ???? was fit
The following is supposed to be the result of a best subsets regression involving five independent variables X1,…, X5.The two models of each size with the highest values of R2 are listed. Something is wrong. What is it?Best Subsets Regression Response is Y Adj. X X X X X Vars R-Sq R-Sq C-p s 1 2
The following MINITAB output is for a best subsets regression involving five dependent variables X1,…, X5. The two models of each size with the highest values of R2 are listed.Best Subsets Regression: Y versus X1, X2, X3, X4, X5 Response is Y Mallows X X X X X Vars R-Sq R-Sq(adj) C-p S 1 2 3 4 5
The article “Simultaneous Optimization of Mechanical Properties of Steel by Maximizing Exponential Desirability Functions” (K. J. Kim and D. K. J. Lin, Journal of the Royal Statistical Society Series C, Applied Statistics, 2000:311–325) presents measurements on 72 steel plates. The following
The article “Experimental Design Approach for the Optimization of the Separation of Enantiomers in Preparative Liquid Chromatography” (S. Lai and Z. Lin, Separation Science and Technology, 2002: 847–875) describes an experiment involving a chemical process designed to separate enantiomers. A
In an experiment to estimate the acceleration of an object down an inclined plane, the object is released and its distance in meters (y) from the top of the plane is measured every 0.1 second from time t = 0.1 to t = 1.0. The data are presented in the following table.The data follow the quadratic
The article “Multiple Linear Regression for Lake Ice and Lake Temperature Characteristics” (S. Gao and H. Stefan, Journal of Cold Regions Engineering, 1999:59–77) presents data on maximum ice thickness in mm (y), average number of days per year of ice cover (x1), average number of days the
The November 24, 2001, issue of The Economist published economic data for 15 industrialized nations. Included were the percent changes in gross domestic product (GDP), industrial production (IP), consumer prices (CP), and producer prices (PP) from fall 2000 to fall 2001, and the unemployment rate
The following data were collected in an experiment to study the relationship between the speed of a cutting tool in m/s (x) and the lifetime of the tool in hours (y).x 1 1.5 2 2.5 3 y 99 96 88 76 66 The least-squares quadratic model is y = 101.4000 + 3.371429x − 5.142857x2.a. Using this equation,
The following data were collected in an experiment to study the relationship between extrusion pressure (in KPa) and wear (in mg).x 150 175 200 225 250 275 y 10.4 12.4 14.9 15.0 13.9 11.9 The least-squares quadratic model is y= − 32.445714 + 0.43154286x − 0.000982857x2.a. Using this equation,
In the article “Low-Temperature Heat Capacity and Thermodynamic Properties of 1,1,1-trifluoro-2, 2-dichloroethane”(R. Varushchenko and A. Druzhinina, Fluid Phase Equilibria, 2002:109–119), the relationship between vapor pressure (p) and heat capacity (t) is given as p = t????3
The article “Evaluating Vent Manifold Inerting Requirements: Flash Point Modeling for Organic Acid-Water Mixtures” (R. Garland and M. Malcolm, Process Safety Progress, 2002:254–260) presents a model to predict the flash point (in ◦F) of a mixture of water, acetic acid, propionic acid, and
The following MINITAB output is for a multiple regression. Some of the numbers got smudged and are illegible. Fill in the missing numbers.Predictor Coef StDev T P Constant (a) 1.4553 5.91 0.000 X1 1.2127 (b) 1.71 0.118 X2 7.8369 3.2109 (c) 0.035 X3 (d) 0.8943 -3.56 0.005 S = 0.82936 R-Sq = 78.0%
The following MINITAB output is for a multiple regression. Something went wrong with the printer, so some of the numbers are missing. Fill them in.Predictor Coef StDev T P Constant -0.58762 0.2873 (a) 0.086 X1 1.5102 (b) 4.30 0.005 X2 (c) 0.3944 -0.62 0.560 X3 1.8233 0.3867 (d) 0.003 S = 0.869 R-Sq
A scientist has measured quantities y, x1, and x2. She believes that y is related to x1 and x2 through the equation y = ????e????1x1+????2x2 ????, where ???? is a random error that is always positive. Find a transformation of the data that will enable her to use a linear model to estimate ????1 and
The article “Drying of Pulps in Sprouted Bed: Effect of Composition on Dryer Performance” (M. Medeiros, S. Rocha, et al., Drying Technology, 2002:865–881) presents measurements of pH, viscosity (in kg/m⋅s), density (in g/cm3), and BRIX (in %). The following MINITAB output presents the
Refer to Exercise 7.a. Find a 95% confidence interval for the coefficient of Last FEV.b. Find a 98% confidence interval for the coefficient of Height.c. Can you conclude that ????2 < −0.08? Perform the appropriate hypothesis test.d. Can you conclude that ????3 > 0.5? Perform the appropriate
In a study of the lung function of children, the volume of air exhaled under force in one second is called FEV1.(FEV1 stands for forced expiratory volume in one second.) Measurements were made on a group of children each year for two years. A linear model was fit to predict this year’s FEV1 as a
The article “Earthmoving Productivity Estimation Using Linear Regression Techniques” (S. Smith, Journal of Construction Engineering and Management, 1999:133–141) presents the following linear model to predict earthmoving productivity (in m3 moved per hour):Productivity = −297.877 + 84.787x1
In the article “Application of Statistical Design in the Leaching Study of Low-Grade Manganese Ore Using Aqueous Sulfur Dioxide” (P. Naik, L. Sukla, and S. Das, Separation Science and Technology, 2002:1375–1389), a fitted model for predicting the extraction of manganese in % (y) from particle
The article “Application of Analysis of Variance to Wet Clutch Engagement” (M. Mansouri, M. Khonsari, et al., Proceedings of the Institution of Mechanical Engineers, 2002:117–125) presents the following fitted model for predicting clutch engagement time in seconds (y) from engagement starting
Refer to Exercise 1.a. Find a 95% confidence interval for the coefficient of Manganese.b. Find a 99% confidence interval for the coefficient of Thickness.c. Can you conclude that ????1 > 3? Perform the appropriate hypothesis test.d. Can you conclude that ????2 < −0.1? Perform the appropriate
In an experiment to determine the factors affecting tensile strength in steel plates, the tensile strength (in kg/mm2), the manganese content (in parts per thousand), and the thickness (in mm) were measured for a sample of 20 plates.The following MINITAB output presents the results of fitting the
An engineer wants to determine the spring constant for a particular spring. She hangs various weights on one end of the spring and measures the length of the spring each time. A scatterplot of length (y) versus load (x) is depicted in the following figure.
The article “Characteristics and Trends of River Discharge into Hudson, James, and Ungava Bays, 1964–2000” (S.Dery, M. Stieglitz, et al., ´ Journal of Climate, 2005:2540–2557) presents measurements of discharge rate x (in km3/yr)and peak flow y (in m3/s) for 42 rivers that drain into the
To determine the effect of temperature on the yield of a certain chemical process, the process is run 24 times at various temperatures. The temperature (in ◦C) and the yield (expressed as a percentage of a theoretical maximum) for each run are given in the following table. The results are
Two radon detectors were placed in different locations in the basement of a home. Each provided an hourly measurement of the radon concentration, in units of pCi/L. The data are presented in the following table.a. Compute the least-squares line for predicting the radon concentration at location 2
The article “Application of Genetic Algorithms to Optimum Design of Elasto-damping Elements of a Half-Car Model Under Random Road Excitations” (M. Mirzael and R. Hassannejad, Proceedings of the Institution of Mechanical Engineers, 2007:515–526) presents values of a coefficient (y), a unitless
The processing of raw coal involves “washing,” in which coal ash (nonorganic, incombustible material) is removed.The article “Quantifying Sampling Precision for Coal Ash Using Gy’s Discrete Model of the Fundamental Error”(Journal of Coal Quality, 1989:33–39) provides data relating the
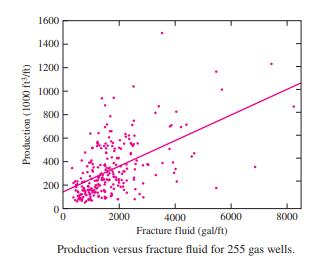
The following MINITAB output is for the least-squares fit of the model ln y = ????0 + ????1 ln x + ????, where y represents the monthly production of a gas well and x represents the volume of fracture fluid pumped in. (A scatterplot of these data is presented in Figure 8.4.)Regression Analysis: LN
The article “ ‘Little Ice Age’ Proxy Glacier Mall Balance Records Reconstructed from Tree Rings in the Mt. Waddington Area, British Columbia Coast Mountains, Canada” (S. Larocque and D. Smith, The Holocene, 2005:748–757)evaluates the use of tree ring widths to estimate changes in the
In a sample of 300 steel rods, the correlation coefficient between diameter and length was r = 0.15.a. Find the P-value for testing H0 : ???? ≤ 0 versus H1 : ???? > 0. Can you conclude that ???? > 0?b. Does the result in part (a) allow you to conclude that there is a strong correlation between
In order to increase the production of gas wells, a procedure known as “fracture treatment” is often used. Fracture fluid, which consists of fluid mixed with sand, is pumped into the well. The following figure presents a scatterplot of the monthly production versus the volume of fracture fluid
The article “Polyhedral Distortions in Tourmaline” (A. Ertl, J. Hughes, et al., The Canadian Mineralogist, 2002:153–162) presents a model for calculating bond-length distortion in vanadium-bearing tourmaline. To check the accuracy of the model, several calculated values (x) were compared with
The Beer–Lambert law relates the absorbance A of a solution to the concentration C of a species in solution by A = MLC, where L is the path length and M is the molar absorption coefficient. Assume that L = 1 cm. Measurements of A are made at various concentrations. The data are presented in the
In the following MINITAB output, some of the numbers have been accidentally erased. Recompute them, using the numbers still available. There are n = 20 points in the data set.Predictor Coef SE Coef T P Constant (a) 0.43309 0.688 (b)X 0.18917 0.065729 (c) (d)S = 0.67580 R-Sq = 31.0%
In the following MINITAB output, some of the numbers have been accidentally erased. Recompute them, using the numbers still available. There are n = 25 points in the data set.The regression equation is Y = 1.71 + 4.27 X Predictor Coef SE Coef T P Constant 1.71348 6.69327 (a) (b)X 4.27473 (c) 3.768
In Example 8.10, imagine that 95% confidence intervals are computed for the mean permeability at resistances of 15, 20, and 25 kΩ . Which of the confidence intervals would be the shortest? Which would be the longest?
Three engineers are independently estimating the spring constant of a spring, using the linear model specified by Hooke’s law. Engineer A measures the length of the spring under loads of 0, 1, 3, 4, and 6 lb, for a total of five measurements. Engineer B uses the same loads but repeats the
In a study to determine the relationship between ambient outdoor temperature and the rate of evaporation of water from soil, measurements of average daytime temperature in ◦C and evaporation in mm/day were taken for 40 days.The results are shown in the following table.a. Compute the least-squares
The article “Application of Radial Basis Function Neural Networks in Optimization of Hard Turning of AISI D2 ColdWorked Tool Steel with a Ceramic Tool” (S. Basak, U. Dixit, and J. Davim, Journal of Engineering Manufacture, 2007:987–998) presents the results of an experiment in which the
The article “Evaluation of the Expansion Attained to Date by Concrete Affected by Alkali-Silica Reaction. Part III:Application to Existing Structures” (M. Berub ´e, N. Smaoui, et al, ´ Canadian Journal of Civil Engineering, 2005:463–479) reports measurements of expansion for several
In a study of reaction times, the time to respond to a visual stimulus (x) and the time to respond to an auditory stimulus (y) were recorded for each of 10 subjects. Times were measured in milliseconds. The results are presented in the following table.x 161 203 235 176 201 188 228 211 191 178 y 159
Refer to Exercises 3 and 4. An atmospheric scientist notices that the slope of the least-squares line in the study described in Exercise 4 differs from the one in the study described in Exercise 3. He wishes to test the hypothesis that the effect of humidity on ozone level differs between the two
In a study similar to the one in Exercise 3, the relative humidity and ozone levels were measured for 120 days in another city. The MINITAB output follows. Assume that assumptions 1 through 4 on page 329 hold.The regression equation is Ozone = 29.7 - 0.135 Humidity Predictor Coef SE Coef T P
Ozone (O3) is a major component of air pollution in many cities. Atmospheric ozone levels are influenced by many factors, including weather. In one study, the mean percent relative humidity (x) and the mean ozone levels (y) were measured for 120 days in a western city. Mean ozone levels were
Structural engineers use wireless sensor networks to monitor the condition of dams and bridges. The article “Statistical Analysis of Vibration Modes of a Suspension Bridge Using Spatially Dense Wireless Sensor Network” (S. Pakzad and G. Fenves, Journal of Structural Engineering, 2009:863–872)
A chemical reaction is run 12 times, and the temperature xi (in ◦C) and the yield yi (in percentage of a theoretical maximum) is recorded each time. The following summary statistics are recorded:x = 65.0 y = 29.05 ∑12 i=1(xi − x)2 = 6032.0∑12 i=1(yi − y)2 = 835.42 ∑12 i=1(xi − x)(yi
Two different chemical formulations of rocket fuel are considered for the peak thrust they deliver in a particular design for a rocket engine. The thrust/weight ratios (in kilograms force per gram) for each of the two fuels are measured several times. The results are as follows:Fuel A: 54.3 52.9
Two microprocessors are compared on a sample of six benchmark codes to determine whether there is a difference in speed. The times (in seconds) used by each processor on each code are given in the following table.Code 123456 Processor A 27.2 18.1 27.2 19.7 24.5 22.1 Processor B 24.1 19.3 26.8 20.1
Two formulations of a certain coating, designed to inhibit corrosion, are being tested. For each of eight pipes, half the pipe is coated with formulation A, and the other half is coated with formulation B. Each pipe is exposed to a salt environment for 500 hours. Afterward, the corrosion loss (in
In a test to compare yield strengths of two grades of carbon steel bolts, strengths of eight grade 2 bolts and six grade 5 bolts were measured. The results, in MPa, were Grade 2: 408 401 406 396 407 394 399 394 Grade 5: 637 659 655 644 663 635 Find a 98% confidence interval for the difference
The article “Tibiofemoral Cartilage Thickness Distribution and its Correlation with Anthropometric Variables” (A. Connolly, D. FitzPatrick, et al., Journal of Engineering in Medicine, 2008:29–39) reports that in a sample of 11 men, the average volume of femoral cartilage (located in the knee)
In the article “Groundwater Electromagnetic Imaging in Complex Geological and Topographical Regions: A Case Study of a Tectonic Boundary in the French Alps” (S. Houtot, P. Tarits, et al., Geophysics, 2002:1048–1060), the pH was measured for several water samples in various locations near
Refer to Exercise 13. Another molecular biologist repeats the study with a different design. She makes up 12 DNA samples, and then chooses 6 at random to be treated with the enzyme and 6 to remain untreated.The results are as follows:Enzyme present: 12 15 14 22 22 20 Enzyme absent: 23 39 37 18 26
A molecular biologist is studying the effectiveness of a particular enzyme to digest a certain sequence of DNA nucleotides. He divides six DNA samples into two parts, treats one part with the enzyme, and leaves the other part untreated. He then uses a polymerase chain reaction assay to count the
A new production process is being contemplated for the manufacture of stainless steel bearings. Measurements of the diameters of random samples of bearings from the old and the new processes produced the following data:Old: 16.3 15.9 15.8 16.2 16.1 16.0 15.7 15.8 15.9 16.1 16.3 16.1 15.8 15.7 15.8
In a survey of 100 randomly chosen holders of a certain credit card, 57 said that they were aware that use of the credit card could earn them frequent flier miles on a certain airline. After an advertising campaign to build awareness of this benefit, an independent survey of 200 credit card holders
A quality manager suspects that the quality of items that are manufactured on a Monday is less good than that of items manufactured on a Wednesday. In a sample of 300 items manufactured on Monday, 260 were rated as acceptable or better, and in a sample of 400 items manufactured on a Wednesday, 370
Two processes for manufacturing a certain microchip are being compared. A sample of 400 chips was selected from a less expensive process, and 62 chips were found to be defective. A sample of 100 chips was selected from a more expensive process, and 12 were found to be defective.a. Find a 95%
To determine the effect of fuel grade on fuel efficiency, 80 new cars of the same make, with identical engines, were each driven for 1000 miles. Forty of the cars ran on regular fuel and the other 40 received premium grade fuel. The cars with the regular fuel averaged 27.2 mpg, with a standard
An engineer claims that a new type of power supply for home computers lasts longer than the old type.Independent random samples of 75 of each of the two types are chosen, and the sample means and standard deviations of their lifetimes (in hours) are computed:New: X1 = 4387 s1 = 252 Old: X2 = 4260
A computer system administrator notices that computers running a particular operating system seem to freeze up more often as the installation of the operating system ages. She measures the time (in minutes) before freeze-up for seven computers one month after installation, and for nine computers
Measurements of the sodium content in samples of two brands of chocolate bar yield the following results(in grams):Brand A 34.36 31.26 37.36 28.52 33.14 32.74 34.34 34.33 30.95 Brand B 41.08 38.22 39.59 38.82 36.24 37.73 35.03 39.22 34.13 34.33 34.98 29.64 40.60 Can you conclude that the variance
A broth used to manufacture a pharmaceutical product has its sugar content, in mg/mL, measured several times on each of three successive days.Day 1: 5.0 4.8 5.1 5.1 4.8 5.1 4.8 4.8 5.0 5.2 4.9 4.9 5.0 Day 2: 5.8 4.7 4.7 4.9 5.1 4.9 5.4 5.3 5.3 4.8 5.7 5.1 5.7 Day 3: 6.3 4.7 5.1 5.9 5.1 5.9 4.7 6.0
A sample of 25 one-year-old girls had a mean weight of 24.1 lb with a standard deviation of 4.3 lb.Assume that the population of weights is normally distributed. A pediatrician claims that the standard deviation of the weights of one-year-old girls is less than 5 lb. Do the data provide convincing
A machine that fills beverage cans is supposed to put 12 ounces of beverage in each can. The variance of the amount in each can is 0.01. The machine is moved to a new location. To determine whether the variance has changed, 10 cans are filled. Following are the amounts in the 10 cans. Assume them
Showing 1100 - 1200
of 4976
First
5
6
7
8
9
10
11
12
13
14
15
16
17
18
19
Last
Step by Step Answers