New Semester
Started
Get
50% OFF
Study Help!
--h --m --s
Claim Now
Question Answers
Textbooks
Find textbooks, questions and answers
Oops, something went wrong!
Change your search query and then try again
S
Books
FREE
Study Help
Expert Questions
Accounting
General Management
Mathematics
Finance
Organizational Behaviour
Law
Physics
Operating System
Management Leadership
Sociology
Programming
Marketing
Database
Computer Network
Economics
Textbooks Solutions
Accounting
Managerial Accounting
Management Leadership
Cost Accounting
Statistics
Business Law
Corporate Finance
Finance
Economics
Auditing
Tutors
Online Tutors
Find a Tutor
Hire a Tutor
Become a Tutor
AI Tutor
AI Study Planner
NEW
Sell Books
Search
Search
Sign In
Register
study help
business
statistics alive
Understandable Statistics Concepts And Methods 13th Edition Charles Henry Brase, Corrinne Pellillo Brase - Solutions
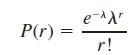
Bacteria Colonies: Poisson Distribution A pathologist has been studying the frequency of bacterial colonies within the field of a microscope using samples of throat cultures from healthy adults.Long-term history indicates that there is an average of 2.80 bacteria colonies per field. Let r be a
Highway Accidents: Poisson Distribution A civil engineer has been studying the frequency of vehicle accidents on a certain stretch of interstate highway. Long-term history indicates that there has been an average of 1.72 accidents per day on this section of the interstate. Let r be a random
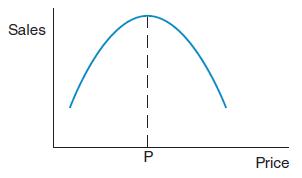
Sales: Insurance Dorothy Kelly sells life insurance for the Prudence Insurance Company. She sells insurance by making visits to her clients’ homes.Dorothy believes that the number of sales should depend, to some degree, on the number of visits made. For the past several years, she has kept
Medical: Fat Babies Modern medical practice tells us not to encourage babies to become too fat. Is there a positive correlation between the weight x of a 1-year-old baby and the weight y of the mature adult(30 years old)? A random sample of medical files produced the following information for 14
Sociology: Job Changes A sociologist is interested in the relation between x 5number of job changes and y 5annual salary (in thousands of dollars) for people living in the Nashville area. A random sample of 10 people employed in Nashville provided the following information:x (Number of job
Desert Ecology: Wildlife Bighorn sheep are beautiful wild animals found throughout the western United States. Data for this problem are based on information taken from The Desert Bighorn, edited by Monson and Sumner (University of Arizona Press). Let x be the age of a bighorn sheep (in years), and
Statistical Literacy Suppose that for x 5 3, the predicted value is yˆ 5 6. The data pair (3, 8) is part of the sample data. What is the value of the residual for x 5 3?AppendixLO1
Statistical Literacy When using the least-squares line for prediction, are results usually more reliable for extrapolation or interpolation?AppendixLO1
Statistical Literacy What does it mean to say that the sample correlation coefficient r is significant?AppendixLO1
Statistical Literacy Suppose the scatter diagram of a random sample of data pairs (x, y) shows no linear relationship between x and y. Do you expect the value of the sample correlation coefficient r to be close to 1, 21, or 0?AppendixLO1
Curvilinear Polynomial Regression In this section we studied multiple linear regression. Our basic linear model has been y 5b0 1b1x1 1b2x2 1 1bk xk .Since all the variables x1, x2 , …, xk are of first degree, this is an example of linear regression.However, the same basic methods of linear
Franchise Business: Market Analysis All Greens is a franchise store that sells house plants and lawn and garden supplies. Although All Greens is a franchise, each store is owned and managed by private individuals. Some friends have asked you to go into business with them to open a new All Greens
Entertainment: Movies A motion picture industry analyst is studying movies based on epic novels. The following data were obtained for 10 Hollywood movies made in the past 5 years. Each movie was based on an epic novel. For these data, x1 5first-year box office receipts of the movie, x2 5total
Education: Exam Scores Professor Gill has taught general psychology for many years. During the semester, she gives three multiple-choice exams, each worth 100 points. At the end of the course, Dr. Gill gives a comprehensive final worth 200 points.Let x1, x2, and x3 represent a student’s scores on
Medical: Blood Pressure The systolic blood pressure of individuals is thought to be related to both age and weight. For a random sample of 11 men, the following data were obtained:Systolic Blood Pressure x1 Age(years)x2 Weight(pounds)x3 Systolic Blood Pressure x1 Age(years)x2 Weight(pounds)x3 132
Statistical Literacy Given the linear regression equation x3 5216.5 1 4.0x1 1 9.2x4 21.1x7(a) Which variable is the response variable? Which variables are the explanatory variables?(b) Which number is the constant term? List the coefficients with their corresponding explanatory variables.(c) If x1
Statistical Literacy Given the linear regression equation x1 51.6 1 3.5x2 2 7.9x3 1 2.0x4(a) Which variable is the response variable? Which variables are the explanatory variables?(b) Which number is the constant term? List the coefficients with their corresponding explanatory variables.(c) If x2 5
Compute confidence intervals for predictions.AppendixLO1
Test coefficients in the model for statistical significance.AppendixLO1
Interpret the coefficient of multiple determination in a multiple regression model.AppendixLO1
Construct a multiple regression model using a statistical software package(such as Minitab or Excel).AppendixLO1
Time Series and Serial Correlation A company that produces and markets video games wants to estimate the predictability of per capita consumer spending on video games in the United States. For the most recent 7 years, the amount of annual spending per person per year is shown here (Reference:
Time Series and Serial Correlation An Internet advertising agency is studying the number of “hits” on a certain web site during an advertising campaign. It is hoped that as the campaign progresses, the number of hits on the web site will also increase in a predictable way from one day to the
Time Series and Serial Correlation Serial correlation, also known as autocorrelation, describes the extent to which the result in one period of a time series is related to the result in the next period. A time series with high serial correlation is said to be very predictable from one period to the
Student’s t Value for Sample r and for Sample b It is not obvious from the formulas, but the values of the sample test statistic t for the correlation coefficient and for the slope of the least-squares line are equal for the same data set. This fact is based on the relation b r ss yx 5where sy
Sample Size and Significance of r(a) Suppose n 5 6 and the sample correlation coefficient is r 5 0.90. Is r significant at the 1%level of significance (based on a two-tailed test)?(b) Suppose n 510 and the sample correlation coefficient is r 5 0.90. Is r significant at the 1%level of significance
Ecology: Wolves Wolf packs tend to be large extended family groups that have a well-defined hunting territory. Wolves not in the pack are driven out of the territory or killed. In ecologically similar regions, is the size of an extended wolf pack related to size of hunting region? Using radio
Oceanography: Drift Rates Ocean currents are important in studies of climate change, as well as ecology studies of dispersal of plankton. Drift bottles are used to study ocean currents in the Pacific near Hawaii, the Solomon Islands, New Guinea, and other islands. Let x represent the number of days
Physiology: Oxygen Aviation and high-altitude physiology is a specialty in the study of medicine.Let x 5partial pressure of oxygen in the alveoli (air cells in the lungs) when breathing naturally available air. Let y 5partial pressure when breathing pure oxygen. The (x, y) data pairs correspond to
Scuba Diving: Depth What is the optimal amount of time for a scuba diver to be on the bottom of the ocean? That depends on the depth of the dive. The U.S. Navy has done a lot of research on this topic.The Navy defines the “optimal time” to be the time at each depth for the best balance between
Baseball: Batting Average and Strikeouts Let x be a random variable that represents the batting average of a professional baseball player. Let y be a random variable that represents the percentage of strikeouts of a professional baseball player. A random sample of n 5 6 professional baseball
Basketball: Free Throws and Field Goals Let x be a random variable that represents the percentage of successful free throws a professional basketball player makes in a season. Let y be a random variable that represents the percentage of successful field goals a professional basketball player makes
Critical Thinking: Using Information from a Computer Display to Find a Confidence Interval Refer to the Minitab printout regarding prehistoric pottery.(a) The standard error Se of the linear regression model is given in the printout as “S.” What is the value of Se?(b) The standard error of the
Critical Thinking: Using Information from a Computer Display to Test for Significance Refer to the Minitab printout regarding prehistoric pottery.(a) Minitab calls the explanatory variable the predictor variable. Which is the predictor variable, the diameter of the pot or the height?(b) For the
Statistical Literacy How does the t value for the sample correlation coefficient r compare to the t value for the corresponding slope b of the sample least-squares line?AppendixLO1
Statistical Literacy For a fixed confidence level, how does the length of the confidence interval for predicted values of y change as the corresponding x values become further away from x ?AppendixLO1
Statistical Literacy What is the symbol used for the slope of the population least-squares line?AppendixLO1
Statistical Literacy What is the symbol used for the population correlation coefficient?AppendixLO1
Find a confidence interval for the slope b of the least-squares line and interpret its meaning.AppendixLO1
Test the slope b of the least-squares line.AppendixLO1
Find a confidence interval for the value of y predicted for a specified value of x.AppendixLO1
Compute the standard error of estimate Se from sample data.AppendixLO1
Test the correlation coefficient r.AppendixLO1
Critical Thinking: Exchange x and y in Least-Squares Equation(a) Suppose you are given the following (x, y) data pairs:x 1 3 4 y 2 1 6 Show that the least-squares equation for these data is y 5 0.143 11.071x (rounded to three digits after the decimal).(b) Now suppose you are given these (x, y) data
Residual Plot: Miles per Gallon Consider the data of Problem 15.(a) Make a residual plot for the least-squares model.(b) Use the residual plot to comment about the appropriateness of the least-squares model for these data. See Problem 25.AppendixLO1
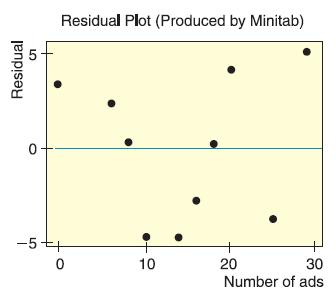
Residual Plot Recall that residual plots are one way to assess how well a least-squares line fits a set of data. The residual is y 2yˆ, the difference between the actual y value and the y value predicted by the least-squares line. In a residual plot, we plot the x coordinates on the horizontal
Cricket Chirps: Temperature Anyone who has been outdoors on a summer evening has probably heard crickets. Did you know that it is possible to use the cricket as a thermometer? Crickets tend to chirp more frequently as temperatures increase. This phenomenon was studied in detail by George W. Pierce,
Muons are subatomic particles that are formed when cosmic rays hit the upper atmosphere. These particles then decay as they interact with the atmosphere so that only a small fraction of muons reach the surface of the earth. At sea level about 1 muon passes through each square centimeter area every
Research: Patents The following data are based on information from the Harvard Business Review (Vol.72, No. 1). Let x be the number of different research programs, and let y be the mean number of patents per program. As in any business, a company can spread itself too thin. For example, too many
Education: Violent Crime The following data are based on information from the book Life in America’s Small Cities (by G. S. Thomas, Prometheus Books).Let x be the percentage of 16- to 19-year-olds not in school and not high school graduates. Let y be the reported violent crimes per 1000
Violent Crimes: Prisons Does prison really deter violent crime? Let x represent percent change in the rate of violent crime and y represent percent change in the rate of imprisonment in the general U.S.population. For 7 recent years, the following data have been obtained (Source: The Crime Drop in
Income: Medical Care Let x be per capita income in thousands of dollars. Let y be the number of medical doctors per 10,000 residents. Six small cities in Oregon gave the following information about x and y (based on information from Life in America’s Small Cities by G.S. Thomas, Prometheus
Auto Accidents: Age Let x be the age of a licensed driver in years. Let y be the percentage of all fatal accidents (for a given age) due to failure to yield the right-of-way. For example, the first data pair states that 5% of all fatal accidents of 37-year-olds are due to failure to yield the
Auto Accidents: Age Data for this problem are based on information taken from The Wall Street Journal. Let x be the age in years of a licensed automobile driver.Let y be the percentage of all fatal accidents (for a given age) due to speeding. For example, the first data pair indicates that 36% of
Basketball: Fouls Data for this problem are based on information from STATS Basketball Scoreboard. It is thought that basketball teams that make too many fouls in a game tend to lose the game even if they otherwise play well. Let x be the number of fouls that were more than (i.e., over and above)
Weight of Car: Miles per Gallon Do heavier cars really use more gasoline? Suppose a car is chosen at random. Let x be the weight of the car (in hundreds of pounds), and let y be the miles per gallon (mpg).The following information is based on data taken from Consumer Reports (Vol. 62, No. 4).x 27
Ranching: Cattle You are the foreman of the Bar-S cattle ranch in Colorado. A neighboring ranch has calves for sale, and you are going to buy some to add to the Bar-S herd. How much should a healthy calf weigh?Let x be the age of the calf (in weeks), and let y be the weight of the calf (in
Economics: Entry-Level Jobs An economist is studying the job market in Denver-area neighborhoods.Let x represent the total number of jobs in a given neighborhood, and let y represent the number of entrylevel jobs in the same neighborhood. A sample of six Denver neighborhoods gave the following
Critical Thinking: Interpreting Computer Printouts Refer to the description of a computer display for regression described in Problem 11. The following Minitab display gives information regarding the relationship between the body weight of a child (in kilograms) and the metabolic rate of the child
Critical Thinking: Interpreting Computer Printouts We use the form yˆ 5a 1bx for the least-squares line.In some computer printouts, the least-squares equation is not given directly. Instead, the value of the constant a is given, and the coefficient b of the explanatory or predictor variable is
Critical Thinking If two variables have a negative linear correlation, is the slope of the least-squares line positive or negative?AppendixLO1
Critical Thinking When we use a least-squares line to predict y values for x values beyond the range of x values found in the data, are we extrapolating or interpolating? What concerns would you have about such predictions?AppendixLO1
Critical Thinking Julian decided to construct a regression line for a data set using the amount of time a person played an online game x, to predict their win rate at the game y. Julian found the equation yˆ 5 0.2 1 0.5x.Suppose someone told Julian that their win rate was 2.3.Can Julian determine
Rowan found the equation yˆ 5 31.5 11.9x. Why would extrapolation using this regression line be problematic? Explain.AppendixLO1
Critical Thinking Rowan has constructed a regression line for a data set in order to predict a person's height in inches y, using the person’s age in years x. The data set included people between the ages of 16 and AppendixLO1
Statistical Literacy What does it mean for a data point to have a residual with value 0?AppendixLO1
Statistical Literacy What is the difference between explained and unexplained variation? What are each of them measuring?AppendixLO1
Statistical Literacy Suppose that a regression line has a negative slope and a coefficient of determination of 0.80. What is the correlation coefficient?AppendixLO1
Statistical Literacy Suppose that the correlation coefficient for a data set is 0.92. What is the coefficient of determination?AppendixLO1
Statistical Literacy In the least squares line yˆ 5 5 1 3x, what is the marginal change in yˆ for each unit change in x?AppendixLO1
Statistical Literacy In the least-squares line yˆ 5 5 2 2x, what is the value of the slope? When x changes by 1 unit, by how much does yˆ change?AppendixLO1
Determine the explained and unexplained variation of the response variable y using the r 2 value.AppendixLO1
Explain why extrapolation beyond the sample data range might give results that are misleading or meaningless.AppendixLO1
Explain the difference between interpolation and extrapolation.AppendixLO1
Predict a value of the response variable y for a specified value of the explanatory variable x using the least-squares line.AppendixLO1
Graph the least-squares line.AppendixLO1
Find the equation of the least-squares line for a set of sample data points.AppendixLO1
State the least-squares criterion.AppendixLO1
Correlation of Averages Fuming because you are stuck in traffic? Roadway congestion is a costly item, in both time wasted and fuel wasted. Let x represent the average annual hours per person spent in traffic delays and let y represent the average annual gallons of fuel wasted per person in traffic
Effect on r of Exchanging x and y Values Examine the computation formula for r, the sample correlation coefficient [formulas (1) and (2) of this section].(a) In the formula for r, if we exchange the symbols x and y, do we get a different result or do we get the same (equivalent) result? Explain.(b)
Effect of Scale on a Scatter Diagram The initial visual impact of a scatter diagram depends on the scales used on the x and y axes. Consider the following data:x 1 2 3 4 5 6 y 1 4 6 3 6 7(a) Make a scatter diagram using the same scale on both the x and y axes (i.e., make sure the unit lengths on
University Crime: FBI Report Do larger universities tend to have more property crime? University crime statistics are affected by a variety of factors. The surrounding community, accessibility given to outside visitors, and many other factors influence crime rates.Let x be a variable that
Baseball: Batting Averages and Home Runs In baseball, is there a linear correlation between batting average and home run percentage? Let x represent the batting average of a professional baseball player, and let y represent the player’s home run percentage(number of home runs per 100 times at
Geology: Earthquakes Is the magnitude of an earthquake related to the depth below the surface at which the quake occurs? Let x be the magnitude of an earthquake (on the Richter scale), and let y be the depth (in kilometers) of the quake below the surface at the epicenter. The following is based on
Meteorology: Cyclones Can a low barometer reading be used to predict maximum wind speed of an approaching tropical cyclone? Data for this problem are based on information taken from Weatherwise(Vol. 46, No. 1), a publication of the American Meteorological Society. For a random sample of tropical
Health Insurance: Administrative Cost The following data are based on information from Domestic Affairs. Let x be the average number of employees in a group health insurance plan, and let y be the average administrative cost as a percentage of claims.x 3 7 15 35 75 y 40 35 30 25 18(a) Make a
Veterinary Science: Shetland Ponies How much should a healthy Shetland pony weigh? Let x be the age of the pony (in months), and let y be the average weight of the pony (in kilograms). The following information is based on data taken from The Merck Veterinary Manual (a reference used in most
Interpretation Do people who spend more time on social networking sites spend more time using Twitter? Megan conducted a study and found that the correlation between the times spent on the two activities was 0.8. What does this result say about the relationship between times spent on the two
Interpretation Trevor conducted a study and found that the correlation between the price of a gallon of gasoline and gasoline consumption has a linear correlation coefficient of 20.7. What does this result say about the relationship between price of gasoline and consumption? The study included
Critical Thinking: Lurking Variables Over the past 30 years in the United States, there has been a strong negative correlation between the number of infant deaths at birth and the number of people over age 65.(a) Is the fact that people are living longer causing a decrease in infant mortalities at
Critical Thinking: Lurking Variables Over the past 50 years, there has been a strong negative correlation between average annual income and the record time to run 1 mile. In other words, average annual incomes have been rising while the record time to run 1 mile has been decreasing.(a) Do you think
Critical Thinking: Lurking Variables Over the past decade, there has been a strong positive correlation between teacher salaries and prescription drug costs.(a) Do you think paying teachers more causes prescription drugs to cost more? Explain.(b) What lurking variables might be causing the increase
Critical Thinking: Lurking Variables Over the past few years, there has been a strong positive correlation between the annual consumption of diet soda drinks and the number of traffic accidents.(a) Do you think increasing consumption of diet soda drinks causes traffic accidents? Explain.(b) What
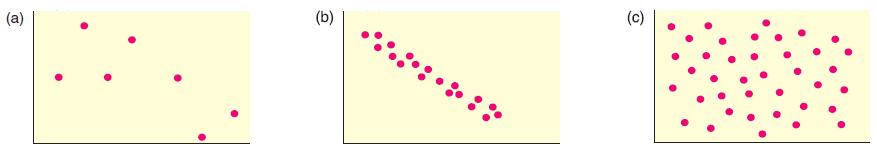
Critical Thinking: Linear Correlation Look at the following diagrams. Which show high linear correlation, moderate or low linear correlation, or no linear correlation?AppendixLO1 (a) (b)
Critical Thinking: Linear Correlation Look at the following diagrams. Which show high linear correlation, moderate or low linear correlation, or no linear correlation?AppendixLO1 (a) (b) (c)
Statistical Literacy Suppose that a data set included x, the amount of time a student spent studying for a test, and y, the student’s test score. When predicting the test score y from the amount of time spent studying, the correlation coefficient was found to be r 5 0.93. If we instead tried to
Statistical Literacy Suppose that a data set of measurements in miles gives a correlation coefficient of r 5 0.9. If the units are all converted to kilometers, what would the new correlation coefficient be?AppendixLO1
Statistical Literacy Describe the relationship between two variables when the correlation coefficient r is(a) near 21.(b) near 0.(c) near 1.AppendixLO1
Statistical Literacy Suppose two variables are negatively correlated. Does the response variable increase or decrease as the explanatory variable increases?AppendixLO1
Statistical Literacy Suppose two variables are positively correlated. Does the response variable increase or decrease as the explanatory variable increases?AppendixLO1
Showing 4700 - 4800
of 6613
First
41
42
43
44
45
46
47
48
49
50
51
52
53
54
55
Last
Step by Step Answers