New Semester
Started
Get
50% OFF
Study Help!
--h --m --s
Claim Now
Question Answers
Textbooks
Find textbooks, questions and answers
Oops, something went wrong!
Change your search query and then try again
S
Books
FREE
Study Help
Expert Questions
Accounting
General Management
Mathematics
Finance
Organizational Behaviour
Law
Physics
Operating System
Management Leadership
Sociology
Programming
Marketing
Database
Computer Network
Economics
Textbooks Solutions
Accounting
Managerial Accounting
Management Leadership
Cost Accounting
Statistics
Business Law
Corporate Finance
Finance
Economics
Auditing
Tutors
Online Tutors
Find a Tutor
Hire a Tutor
Become a Tutor
AI Tutor
AI Study Planner
NEW
Sell Books
Search
Search
Sign In
Register
study help
business
statistics alive
Statistics The Art And Science Of Learning From Data 4th Global Edition Alan Agresti, Christine A. Franklin, Bernhard Klingenberg - Solutions
2.20 Histogram for sugar For the breakfast cereal data, the figure below shows a histogram for the sugar values in grams.a. Identify the intervals of sugar values used for the plot.b. Describe the shape of the distribution. What do you think might account for this unusual shape? (Hint:How else are
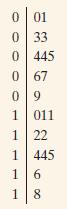
2.19 Split Stems The figure below shows the stem-and-leaf plot for the cereal sugar values from Example 5, using split stems.Stem and Leaf Plot for Cereal Sugar Values with Leaf Unit = 1000a. What was the smallest and largest amount of sugar found in the 20 cereals?b. What sugar values are
2.18 Fertility rates The fertility rate for a nation is the average number of children per adult woman. The table below part c shows results for western European nations, the United States, Canada, and Mexico, as reported by the United Nations in 2005.a. Construct a stem-and-leaf plot using stems 1
2.17 Student scores A student wants to examine the distribution of his scores as shown on his academic transcript. To this end, he constructs the stem-and-leaf plot of his records:a. Identify the number of courses validated by the student, his minimum and maximum scores.b. Sketch a dot plot for
2.16 Spring break hotel prices For a trip to Miami, Florida, over spring break in 2014, the data below (obtained from travelocity.com) show the price per night (in U.S. dollars)for various hotel rooms.a. Construct a stem-and-leaf plot. Truncate the data to the first two digits for purposes of
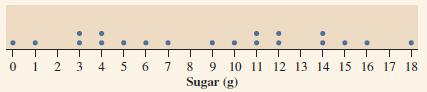
2.15 Sugar dot plot For the breakfast cereal data given in Table 2.3, a dot plot for the sugar values (in grams) is shown:a. Identify the minimum and maximum sugar values.b. Which sugar outcomes occur most frequently? What are these values called? 16 75 T4 0 1 2 3 4 5 6 7 8 9 10 11 12 13 14 15 16
2.13 France is most popular holiday spot Which countries are most frequently visited by tourists from other countries?The table shows results according to Travel and Leisure magazine (2005).a. Is country visited a categorical or a quantitative variable?b. In creating a bar graph of these data,
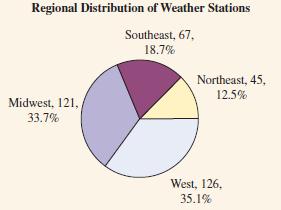
2.12 Weather stations The pie chart (constructed using EXCEL) shown portrays the regional distribution of weather stations in the United States.a. Do the slices of the pie portray (i) variables or(ii) categories of a variable?b. Identify what the two numbers mean that are shown for each slice of
2.11 What do alligators eat? The bar chart is from a study2 investigating the factors that influence alligators’ choice of food. For 219 alligators captured in four Florida lakes, researchers classified the primary food choice (in volume) found in the alligator’s stomach in one of the
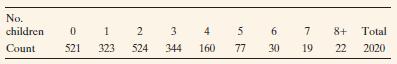
2.8 Number of children In the 2008 General Social Survey(GSS), 2020 respondents answered the question, “How many children have you ever had?” The results werea. Is the variable, number of children, categorical or quantitative?b. Is the variable, number of children, discrete or continuous?c. Add
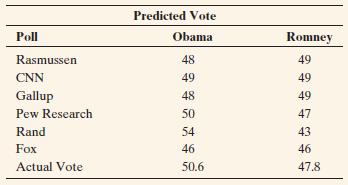
1.17 Comparing polls The following table shows the result of the 2012 presidential election along with the vote predicted by several organizations in the days before the election. The sample sizes were typically about 1000 to 2000 people. The percentages for each poll do not sum to 100 because of
1.13 Age pyramids as descriptive statistics The figure shown is a graph published by Statistics Sweden. It compares Swedish society in 1750 and in 2010 on the numbers of men and women of various ages, using age pyramids.Explain how this indicates thata. In 1750, few Swedish people were old.b. In
2.149 GSS Access the General Social Survey at sda.berkeley.edu/GSS.a. Find the frequency table and histogram for Example 6 on TV watching. (Hint: Enter TVHOURS as the row variable, YEAR(2012) as the selection filter, choose bar chart for Type of Chart, and click Run the Table.)b. Your instructor
2.148 Create own data For the Mean Versus Median web app, using the option “Supply own sample” from the drop down menu, your instructor will give you a data set to illustrate the effect of extreme observations on the mean and median. Write a short summary of your observations.
2.147 The average student Refer to the data file you created in Activity 3 in Chapter 1. For variables chosen by your instructor, describe the “average student” in your class.Prepare a one-page summary report. In class, students will compare their analyses of what makes up an average student.
2.146 Rescale the data The mean and standard deviation of a sample may change if data are rescaled (for instance, temperature changed from Fahrenheit to Celsius). For a sample with mean xQ, adding a constant c to each observation changes the mean to xQ +c, and the standard deviation s is unchanged.
2.145 Using MAD to measure variability The standard deviation is the most popular measure of variability from the mean. It uses squared deviations because the ordinary deviations sum to zero. An alternative measure is the mean absolute deviation, Σ• x - xQ • >n.a. Explain why greater
2.144 Range the least resistant We’ve seen that measures such as the mean, the range, and the standard deviation can be highly influenced by outliers. Explain why the range is worst in this sense. (Hint: As the sample size increases, explain how a single extreme outlier has less effect on the
2.143 Range and standard deviation approximation Use the empirical rule to explain why the standard deviation of a bell-shaped distribution for a large data set is often roughly related to the range by evaluating Range ≈ 6s. (For small data sets, one may not get any extremely large or small
2.142 Worldwide airline fatalities Statistics published on www.allcountries.org based on figures supplied by the U.S.Census Bureau show that 24 fatal accidents or less were observed in 23.1% of years from 1987 to 1999, 25 or less in 38.5% of years, 26 or less in 46.2% of years, 27 or less in 61.5%
2.141 Mean for grouped data Refer to the calculation of the mean in Exercises 2.43 or 2.133. Explain why the mean for grouped data can be expressed as a sum, taking each possible outcome times the proportion of times it occurred.
2.140 True or false: Soccer According to a story on www.tsmplug.com, in the United Kingdom, the mean wage bill (in millions) for a Premier League club in 2012–2013 was £90.3. True or false: If the wage bill distribution was skewed to the right, then the median wage bill was even larger than
2.139 Bad statistic A teacher summarizes grades on an exam by Min = 26, Q1 = 67, Q2 = 80, Q3 = 87, Max = 100, Mean = 76, Mode = 100, Standard deviation = 76, IQR = 20.She incorrectly recorded one of these. Which one do you think it was? Why?
2.138 True or false:a. The mean, median, and mode can never all be the same.b. The mean is always one of the data points.c. When n is odd, the median is one of the data points.d. The median is the same as the second quartile and the 50th percentile.
2.137 Multiple choice: Relative GPA The mean GPA for all students at a community college in the fall semester was 2.77. A student with a GPA of 2.0 wants to know her relative standing in relation to the mean GPA. A numerical summary that would be useful for this purpose is thea. standard
2.136 Multiple choice: Fact about s Which statement about the standard deviation s is false?a. s can never be negative.b. s can never be zero.c. For bell-shaped distributions, about 95% of the data fall within xQ { 2s.d. s is a nonresistant (sensitive to outliers) measure of variability, as is the
2.135 Multiple choice: GRE scores In a study of graduate students who took the Graduate Record Exam (GRE), the Educational Testing Service reported that for the quantitative exam, U.S. citizens had a mean of 529 and standard deviation of 127, whereas the non-U.S. citizens had a mean of 649 and
2.134 Mode but not median and mean The previous exercise showed how to find the mean and median when a categorical variable has ordered categories. A categorical scale that does not have ordered categories (such as choice of religious affiliation or choice of major in college) is called a nominal
2.132 You give examples Give an example of a variable that you’d expect to have a distribution that isa. Approximately symmetricb. Skewed to the rightc. Skewed to the leftd. Bimodale. Skewed to the right, with a mode and median of 0 but a positive mean.
2.130 Google trend Go to www.google.com/trends and click Explore in Depth. Look up a subject of interest to you and try to create a time plot that shows interest in the subject over time. Interpret the plot and suggest ways the graph could be improved.
2.128 How much spent on haircuts? Is there a difference in how much males and females spend on haircuts? Access the Georgia Student Survey data file on the book’s website or use your class data to explore this question, using appropriate graphical and numerical methods. Write a brief report
2.127 Baseball’s great home run hitters The Baseball’s HR Hitters file on the book’s website contains data on the number of home runs hit each season by some of baseball’s great home run hitters. Analyze these data by using techniques introduced in this chapter to help judge statistically
2.125 Price of diamonds According to www.elitetraveler.com, the average sale price of the nine most expensive diamonds in the world was $114.36 million with a standard deviation of $150.28 million. Find the z-score for a diamond sold at $25 million. Interpret.
2.124 Blood pressure A World Health Organization study (the MONICA project) of health in various countries reported that in Canada, systolic blood pressure readings have a mean of 121 and a standard deviation of 16. A reading above 140 is considered to be high blood pressure.a. What is the z-score
2.122 High school graduation rates The distribution of high school graduation rates in the United States in 2009 had a minimum value of 79.9 (Texas), first quartile of 84.0, median of 87.4, third quartile of 89.8, and maximum value of 91.8 (Wyoming) (Statistical Abstract of the United States, data
2.121 What box plot do you expect? For each of the following variables, sketch a box plot that would be plausible.a. Exam score 1min = 0, max = 100, mean = 87, standard deviation = 102b. IQ (mean = 100 and standard deviation = 16)c. Weekly religious contribution (median = $10 and mean = $172
2.120 Health insurance In 2014, the five-number summary statistics for the distribution of statewide number of people (in thousands) without health insurance had a minimum of 31 (Vermont), Q1 = 156, median = 418, Q3 = 837, and maximum of 5047 (Texas) (Source: 2015 Current Population Survey Annual
2.119 Teachers’ salaries According to Statistical Abstract of the United States, 2012, average salary (in dollars) of primary and secondary school classroom teachers in 2009 in the United States varied among states with a fivenumber summary of: minimum = 35,070, Q1 = 45,840, median = 48,630, Q3 =
2.118 Temperatures in Central Park Access the Central Park temps data file on the book’s website.a. Using software, construct a histogram of average March temperatures and interpret, noting shape, center, and variability.b. Find and interpret the mean and standard deviation of March
2.115 Cigarette tax How do cigarette taxes per pack vary from one state to the next? The data set of 2003 cigarette taxes for all 50 states and Washington, D.C., is in the Cigarette Tax data file on the book’s website.a. Use software to construct a histogram. Write a short description of the
2.114 Income statistics According to the U.S. Census Bureau, Current Population Survey, 2015 Annual Social and Economic Supplement, the mean income for males is$47,836.10 with a standard deviation of $58,353.55 and the mean income for females is $28,466 with a standard deviation of $36,961.10.a. Is
2.113 More hurricane damage Refer to the previous exercise about hurricane damage and the histogram shown there.a. For this data, 93% of damages (i.e., all but the two most expensive) fall within one standard deviation of the mean. Why is this so different from the 68% the empirical rule
2.111 Energy and water consumption In parts a andb, what shape do you expect for the distributions of electricity use and water use in a recent month in Gainesville, Florida?Why? (Data supplied by N. T. Kamhoot, Gainesville Regional Utilities.)a. Residential electricity used had mean = 780 and
2.110 Female heights According to a recent report from the U.S. National Center for Health Statistics, females between 25 and 34 years of age have a bell-shaped distribution for height, with mean of 65 inches and standard deviation of 3.5 inches.a. Give an interval within which about 95% of the
2.109 What does s equal?a. For an exam given to a class, the students’ scores ranged from 35 to 98, with a mean of 74. Which of the following is the most realistic value for the standard deviation: -10, 1, 12, 60? Clearly explain what is unrealistic about the other values.b. The sample mean for a
2.107 Lengths of hikes Refer to the previous exercise.a. Give an example of five hike lengths such that the mean and median are equal.b. Give an example of five hike lengths such that the mode is 2, the median is 3, and the mean is larger than the median.
2.106 Hiking In a guidebook about interesting hikes to take in national parks, each hike is classified as easy, medium, or hard and by the length of the hike (in miles). Which classification is quantitative and which is categorical?
2.105 Golfers’ gains During the 2010 Professional Golfers Association (PGA) season, 90 golfers earned at least$1 million in tournament prize money. Of those, 5 earned at least $4 million, 11 earned between $3 million and$4 million, 21 earned between $2 million and $3 million, and 53 earned
2.104 Household net worth A study reported that in 2007 the mean and median net worth of American families were$556,300 and $120,300, respectively.a. Is the distribution of net worth for these families likely to be symmetric, skewed to the right, or skewed to the left? Explain.b. During the Great
2.103 Median versus mean sales price of new homes The U.S. Bureau of the Census reported a median sales price of new houses sold in March 2014 of $290,000. Would you expect the mean sales price to have been higher or lower? Explain.
2.102 Sketch plots For each of the following, sketch roughly what you expect a histogram to look like and explain whether the mean or the median would be greater.a. The selling price of new homes 2015.b. The number of children ever born per woman age 40 or overc. The score on an easy exam 1mean =
2.101 What shape do you expect? For the following variables, indicate whether you would expect its histogram to be bell shaped, skewed to the right, or skewed to the left.Explain why.a. Number of times arrested in past yearb. Time needed to complete difficult exam (maximum time is 1 hour)c.
2.100 Sandwiches and cost Refer to the previous exercise.Repeat parts a–c for the cost of the sandwiches. Summarize your findings.
2.96 Longevity The Animals data set on the book’s website has data on the average longevity (measured in years) for 21 animals.a. Construct a stem-and-leaf plot of longevityb. Construct a histogram of longevity.c. Summarize what you see in the histogram or stemand-leaf plot. (Most animals live to
2.93 Cool in China A recent survey7 asked 1200 university students in China to pick the personality trait that most defines a person as “cool.” The possible responses allowed, and the percentage making each, were individualistic and innovative (47%), stylish (13.5%), dynamic and capable(9.5%),
2.91 Continuous or discrete? Which of the following variables are continuous, when the measurements are as precise as possible?a. Age of motherb. Number of children in a familyc. Cooking time for preparing dinnerd. Latitude and longitude of a citye. Population size of a city
2.90 Categorical or quantitative? Identify each of the following variables as categorical or quantitative.a. Number of children in familyb. Amount of time in football game before first points scoredc. College major (English, history, chemistry, . . .)d. Type of music (rock, jazz, classical, folk,
2.89 Bad graph Search some publications and find an example of a graph that violates at least one of the principles for constructing good graphs. Summarize what’s wrong with the graph and explain how it could be improved.
2.83 Cell phone bill The cell phone bills of seven members of a family for the previous month were $89, $92, $92, $93,$95, $81, and $196.a. For the seven cell phone bills, report the mean and median.b. Why is it misleading for a family member to boast to his or her friends that the average cell
2.81 Females or males watch more TV? Refer to the previous exercise. Suppose you wanted to compare TV watching by males and females. Construct a side-by-side box plot to do this. Interpret.
2.80 Florida students again Refer to the FL Student Survey data set on the book’s website and the data on weekly hours of TV watching.a. Use software to construct a box plot. Interpret the information on the plot and use it to describe the shape of the distribution.b. Using a criterion for
2.79 Marathon results The results for the first 20 finishers of the Women’s Marathon in the World Athletics Championships in Beijing in 2015 appears to have a roughly bell-shaped distribution with a mean of 9073 seconds and a standard deviation of 161.4 seconds. Among the first 20 runners to
2.78 Height of buildings For the 50 tallest buildings in Washington D.C., the mean was 195.57 ft and the standard deviation was 106.32 ft. The tallest building in this sample had a height of 761 ft (www.skyscrapercenter.com).a. Find the z-score for the height of 761 ft.b. What does the positive
2.77 Air pollution Example 17 discussed EU carbon dioxide emissions, which had a mean of 7.9 and standard deviation of 3.6.a. Finland’s observation was 11.5. Find its z-score and interpret.b. Sweden’s observation was 5.6. Find its z-score, and interpret.c. The UK’s observation was 7.9. Find
2.76 European Union youth unemployment rates The 2013 unemployment rates of countries in the European Union shown in Exercise 2.63 ranged from 4.9 to 27.3, with Q1 = 7.15, median = 10.15, Q3 = 13.05, a mean of 11.1, and a standard deviation of 5.6.a. In a box plot, what would be the values at the
2.74 Public transportation Exercise 2.37 described a survey about how many miles per day employees of a company use public transportation. The sample values were:0 0 4 0 0 0 10 0 6 0a. Identify the five-number summary and sketch a box plot.b. Explain why Q1 and the median share the same line in the
2.73 Box plot for exam The scores on an exam have mean = 88, standard deviation = 10, minimum = 65, Q1 = 77, median = 85, Q3 = 91, maximum = 100.Sketch a box plot, labeling which of these values are used in the plot.
2.71 Computer use During a recent semester at the University of Florida, students having accounts on a mainframe computer had storage space use(in kilobytes) described by the five-number summary, minimum = 4, Q1 = 256, median = 530, Q3 = 1105, and maximum = 320,000.a. Would you expect this
2.70 Infant mortality Europe For Western Europe, the infant mortality rates reported by the Human Development Report 2006 were:Sweden 3, Finland 3, Spain 3, Belgium 4, Denmark 4, France 4, Germany 4, Greece 4, Italy 4, Norway 4, Portugal 4, Netherlands 5, Switzerland 5, UK 5.Show that Q1 = Q2 = Q3
2.69 Infant mortality Africa The Human Development Report 2006, published by the United Nations, showed infant mortality rates (number of infant deaths per 1000 live births)by country. For Africa, some of the values reported were:South Africa 54, Sudan 63, Ghana 68, Madagascar 76, Senegal 78,
2.68 Traffic violations A company decides to examine the number of points its employees have accumulated in the last two years on their driving record point system. A sample of twelve employees yields the following observations:0 5 3 4 8 0 4 0 2 3 0 1a. The standard deviation is 2.505. Find and
2.67 Variability of net worth of billionaires Here is the five-number summary for the distribution of the net worth(in billions) of the Top 659 World’s Billionaires according to Forbes magazine.Minimum = 2.9, Q1 = 3.6, Median = 4.8, Q3 = 8.2, Maximum = 79.2a. About what proportion of billionaires
2.66 Ways to measure variability The standard deviation, the range, and the interquartile range (IQR) summarize the variability of the data.a. Why is the standard deviation s usually preferred over the range?b. Why is the IQR sometimes preferred to s?c. What is an advantage of s over the IQR?
2.65 Students’ shoe size Data collected over several years from college students enrolled in a business statistics class regarding their shoe size is numerically summarized by xQ = 9.91, Q1 = 8, median = 10, Q3 = 11.a. Interpret the quartiles.b. Would you guess that the distribution is skewed or
2.64 On-time performance of airlines In 2015, data collected on the monthly on-time arrival rate of major domestic and regional airlines operating between Australian airports is numerically summarized by xQ = 85.93, Q1 = 83.75, median = 85.65, Q3 = 87.75, number of observations = 72.a. Interpret
2.62 Vacation days National Geographic Traveler magazine recently presented data on the annual number of vacation days averaged by residents of eight countries. They reported 42 days for Italy, 37 for France, 35 for Germany, 34 for Brazil, 28 for Britain, 26 for Canada, 25 for Japan, and 13 for the
2.61 Create data with a given standard deviation Use the Mean versus Median web app on the book’s website to investigate how the standard deviation changes as the data change. When you start the app, you have a blank graph.Under “Options”, you can request to show the standard deviation of the
2.60 Youth unemployment in the EU The Youth Unemployment data file on the book’s website contains 2013 unemployment rates in the 28 EU countries for people between 15 and 24 years of age. (The data are also shown in Exercise 2.63). Using software,a. Construct a graph to visualize the distribution
2.59 Judging skew using xQ and s If the largest observation is less than 1 standard deviation above the mean, then the distribution tends to be skewed to the left. If the smallest observation is less than 1 standard deviation below the mean, then the distribution tends to be skewed to the right. A
2.58 Facebook friends A student asked her coworkers, parents, and friends, “How many friends do you have on Facebook?” She summarized her data and reported that the average number of Facebook friends in her sample is 170 with a standard deviation of 90. The distribution had a median of 120 and
2.57 Time spent using electronic devices A student conducted a survey about the amount of free time spent using electronic devices in a week. Of 350 collected responses, the mode was 9, the median was 14, the mean was 17, and the standard deviation was 11.5. Based on these statistics, what would
2.54 Students’ shoe size Data collected over several years from college students enrolled in a business statistics class regarding their shoe size shows a roughly bell-shaped distribution, with xQ = 9.91 and s = 2.07.a. Give an interval within which about 95% of the shoe sizes fall.b. Identify
2.53 On-time performance of airlines In 2015, data collected on the monthly on-time arrival rate of major domestic and regional airlines operating between Australian airports shows a roughly bell-shaped distribution for 72 observations with xQ = 85.93 and s = 3. Use the empirical rule to describe
2.51 Heights For the sample heights of Georgia college students in Example 14, the males had xQ = 71 and s = 3, and the females had xQ = 65 and s = 3.a. Use the empirical rule to describe the distribution of heights for males.b. The standard deviation for the overall distribution (combining females
2.50 Exam standard deviation For an exam given to a class, the students’ scores ranged from 35 to 98, with a mean of 74. Which of the following is the most realistic value for the standard deviation: -10, 0, 3, 12, 63? Clearly explain what’s unrealistic about each of the other values.
2.49 Shape of home prices? According to the National Association of Home Builders, the median selling price of new homes in the United States in February 2014 was $261,400. Which of the following is the most plausible value for the standard deviation:- $15,000, $1000, $60,000, or $1,000,000? Why?
2.48 Life expectancy including Russia For Russia, the United Nations reported a life expectancy of 70. Suppose we add this observation to the data set for Western Europe in the previous exercise. Would you expect the standard deviation to be larger, or smaller, than the value for the Western
2.47 Life expectancy The Human Development Report 2013, published by the United Nations, showed life expectancies by country. For Western Europe, some values reported were Austria 81, Belgium 80, Denmark 80, Finland 81, France 83, Germany 81, Greece 81, Ireland 81, Italy 83, Netherlands 81, Norway
2.46 Traffic violations A company decides to examine the number of points its employees have accumulated in the last two years on a driving point record system. A sample of twelve employees yields the following observations:0 5 3 4 8 0 4 0 2 3 0 1a. Find and interpret the range.b. Find and
2.45 Airplane crashes One variable in a study measures how many airplane crashes a commercial airline company has had in the past year.a. Calculate the expected value of the mode for this variable.b. Explain why the mean would likely be more useful than the median for summarizing the responses of
2.42 Dining out A recent survey asked students, “On average, how many times in a week do you go to a restaurant for dinner?” Of the 570 respondents, 84 said they do not go out for dinner, 290 said once, 100 said twice, 46 said thrice, 30 said 4 times, 13 said 5 times, 5 said 6 times, and 2 said
2.40 More baseball salaries Go to espn.go.com/mlb/teams and select a (or your favorite) team. Click Roster and then Salary. Copy the salary figures for the players into a software program and create a histogram. Describe the shape of the distribution for salary and comment on its center by quoting
2.39 Sale price of houses According to the U.S. Census Bureau, houses in 2014 had a median sales price of$282,800 and a mean sales price of $345,800 (www.census.gov/construction/nrs/pdf/uspriceann.pdf). What do you think causes these two values to be so different?
2.38 Public transportation—outlier Refer to the previous exercise.a. Use the Mean Versus Median app (see Activity 1) to investigate what effect adding the outlier of 90 to the data set has on the mean and median. (In the app, select “Supply own sample” and type the data plus the value 90 into
2.37 Public transportation—center The owner of a company in downtown Atlanta is concerned about the large use of gasoline by her employees due to urban sprawl, traffic congestion, and the use of energy-inefficient vehicles such as SUVs. She’d like to promote the use of public transportation.She
2.34 Labor dispute The workers and the management of a company are having a labor dispute. Explain why the workers might use the median income of all the employees to justify a raise but management might use the mean income to argue that a raise is not needed.
2.33 Weekly earnings and gender In New Zealand, the mean and median weekly earnings for males in 2009 was $993 and $870, respectively and for females, the mean and median weekly earnings were $683 and $625, respectively(www.nzdotstat.stats.govt.nz). Does this suggest that the distribution of weekly
2.32 Resistance to an outlier Consider the following three sets of observations:Set 1: 8, 9, 10, 11, 12 Set 2: 8, 9, 10, 11, 100 Set 3: 8, 9, 10, 11, 1000a. Find the median for each data set.b. Find the mean for each data set.c. What do these data sets illustrate about the resistance of the median
2.31 More on CO2 emissions The Energy Information Agency reported the CO2 emissions (measured in gigatons, Gt)from fossil fuel combustion for the top 10 emitting countries in 2011. These are China (8 Gt), the United States(5.3 Gt), India (1.8 Gt), Russia (1.7 Gt), Japan (1.2 Gt), Germany (0.8 Gt),
2.30 More median versus mean For each of the following variables, would you use the median or mean for describing the center of the distribution? Why? (Think about the likely shape of the distribution.)a. Amount of liquid in bottles of capacity one literb. The salary of all the employees in a
Showing 4100 - 4200
of 6613
First
35
36
37
38
39
40
41
42
43
44
45
46
47
48
49
Last
Step by Step Answers