New Semester
Started
Get
50% OFF
Study Help!
--h --m --s
Claim Now
Question Answers
Textbooks
Find textbooks, questions and answers
Oops, something went wrong!
Change your search query and then try again
S
Books
FREE
Study Help
Expert Questions
Accounting
General Management
Mathematics
Finance
Organizational Behaviour
Law
Physics
Operating System
Management Leadership
Sociology
Programming
Marketing
Database
Computer Network
Economics
Textbooks Solutions
Accounting
Managerial Accounting
Management Leadership
Cost Accounting
Statistics
Business Law
Corporate Finance
Finance
Economics
Auditing
Tutors
Online Tutors
Find a Tutor
Hire a Tutor
Become a Tutor
AI Tutor
AI Study Planner
NEW
Sell Books
Search
Search
Sign In
Register
study help
business
statistics econometrics
Statistics For The Behavioral And Social Sciences 5th Edition Arthur Aron Elliot Coups, Elaine N. Aron - Solutions
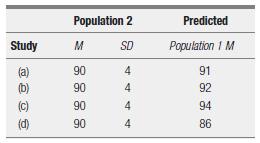
Here is information about several possible versions of a planned study, each involving a single sample. Figure the predicted effect size for each study: Population 2 Predicted Study M SD Population 1 M (a) 90 4 91 (b) 90 4 92 (c) 90 4 94 (d) 90 4 86
In a planned study, there is a known population with a normal distribution, Population and Population What is the predicted effect size if the researchers predict that those given an experimental treatment have a mean of (a) 50, (b) 52, (c) 54, (d) 56, and (e) 47? For each part, also indicate
In a completed study, there is a known population with a normal distribution, Population and Population What is the estimated effect size if a sample given an experimental procedure has a mean of (a) 19, (b) 22, (c) 25,(d) 30, and (e) 35? For each part, also indicate whether the effect is
Explain the relationship between effect size and power.
Explain the idea of power as the probability of getting significant results if the research hypothesis is true. Be sure to mention that the usual minimum acceptable level of power for a research study is 80%. Explain the role played by power when you are interpreting the results of a study (both
Explain the idea of effect size as the degree of overlap between distributions.Note that this overlap is a function of mean difference and population standard deviation (and describe precisely how it is figured and why it is figured that way). If required by the question, discuss the effect size
When a result is not significant, what can you conclude about the truth of the research hypothesis if the study had (a) a very large sample size or (b) a very small sample size?
When a result is significant, what can you conclude about effect size if the study had (a) a very large sample size or (b) a very small sample size?
You are comparing two studies in which one is significant at and the other is significant at (a) What can you conclude about the two studies? (b) What can you not conclude about the two studies?
Why is statistical significance not the same as practical importance?
What are the disadvantages of increasing the power of a planned study by using (a) a more lenient significance level or (b) a one-tailed test rather than a two-tailed test?
What is usually the easiest way to increase the power of a planned study?
(a) What are the two basic ways of increasing the effect size of a planned study?For each, (b) and (c), how can it be done, and what are the disadvantages?
(a) How and (b) why does using a one-tailed versus a two-tailed test affect power?
(a) How and (b) why does the significance level used affect power?
(a) How and (b) why does sample size affect power?
(a) What are the two factors that determine effect size? For each factor, (b) and(c), explain how and why it affects power.
(a) Name three approaches that researchers typically use to determine power.(b) Why do researchers use these approaches, as opposed to figuring power by hand themselves?
What is the probability of getting a significant result if the research hypothesis is false?
Give two reasons why statistical power is important.
(a) What is statistical power? (b) How is it different from just the probability of getting a significant result?
(a) What is meta-analysis? (b) What is the role of effect size in a meta-analysis?
What are the effect size conventions?
On a standard test, the population is known to have a mean of 500 and a standard deviation of 100. Those receiving an experimental treatment have a mean of 540. What is the effect size?
Write the formula for effect size in the situation we have been considering.
Why do researchers usually use a standardized effect size?
What does effect size add to just knowing whether a result is significant?
Cut up 90 small slips of paper, and write each number from 1 to 9 on 10 slips each.Put the slips in a large bowl and mix them up. (a) Take out a slip, write down the number on it, and put it back. Do this 20 times. Make a histogram, and figure the mean and the variance of the result. You should get
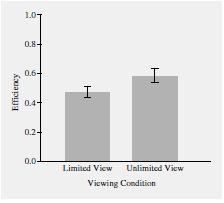
ADVANCED TOPIC: Stankiewicz, Legge, Mansfield, and Schlicht (2006) examined how limitations in human perception and memory (and other factors) affect people’s ability to find their way in indoor spaces. In one of their experiments, eightstudents used a computer keyboard to move through a virtual
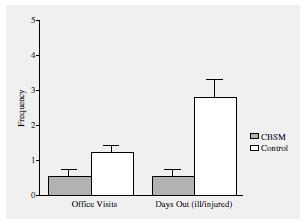
Perna, Antoni, Baum, Gordon, and Schneiderman (2003) tested whether a stress management intervention could reduce injury and illness among college athletes.In their study, 34 college athletes were randomly assigned to be in one of two groups:(1) a stress management intervention group: This group
A government-sponsored telephone counseling service for adolescents tested whether the length of calls would be affected by a special telephone system that had a better sound quality. Over the past several years, the lengths of telephone calls (in minutes)were normally distributed with Population
A researcher is interested in the conditions that affect the number of dreams per month that people report in which they are alone. We will assume that based on extensive previous research, it is known that in the general population the number of such dreams per month follows a normal curve, with
A researcher is interested in whether people are able to identify emotions correctly in other people when they are extremely tired. It is known that, using a particular method of measurement, the accuracy ratings of people in the general population(who are not extremely tired) are normally
ADVANCED TOPIC: Figure the 99% confidence interval (that is, the lower and upper confidence limits) for each part of problem 14. Assume that in each case the researcher’s sample has a mean of 50 and that the population of individuals is known to follow a normal curve.
ADVANCED TOPIC: Figure the 95% confidence interval (that is, the lower and upper confidence limits) for each part of problem 13. Assume that in each case the researcher’s sample has a mean of 80 and the population of individuals is known to follow a normal curve.
For each of the following studies, the samples were given an experimental treatment and the researchers compared their results to the general population.(Assume all populations are normally distributed.) For each, carry out a Z test using the five steps of hypothesis testing for a two-tailed test
For each of the studies shown below, the samples were given an experimental treatment and the researchers compared their results to the general population.(Assume all populations are normally distributed.) For each, carry out a Z test using the five steps of hypothesis testing for a two-tailed
Figure the standard deviation of the distribution of means for a population with a standard deviation of 20 and sample sizes of (a) 10, (b) 11, (c) 100, and (d) 101.
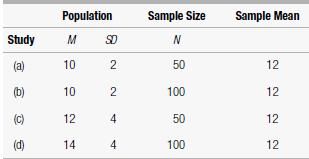
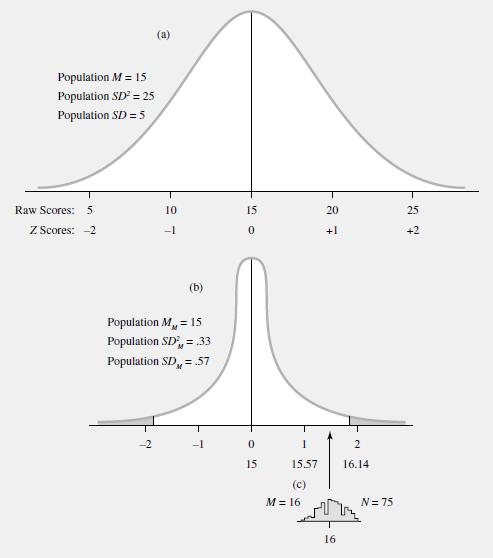
Indicate the mean and the standard deviation of the distribution of means for each of the situations shown to the right.
Under what conditions is it reasonable to assume that a distribution of means will follow a normal curve?
ADVANCED TOPIC: Anderson, Carey, and Taveras (2000) studied the rate of HIV testing among adults in the United States and reported one of their findings as follows: “Responses from the NHIS [National Health Interview Survey] indicate that by 1995, 39.7% of adults (95% CI = 38.8%, 40.5%) had been
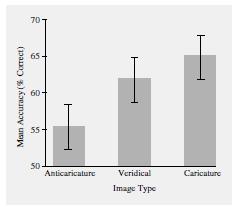
Lee, Byatt, and Rhodes (2000) tested a theory of the role of distinctiveness in face perception. In their study, participants indicated whether they recognized each of 48 faces of male celebrities when they were shown rapidly on a computer screen. A third of the faces were shown in caricature form,
A large number of people were shown a particular film of an automobile collision between a moving car and a stopped car. Each person then filled out a questionnaire about how likely it was that the driver of the moving car was at fault, on a scale from to at fault. The distribution of ratings under
Twenty-five women between the ages of 70 and 80 were randomly selected from the general population of women their age to take part in a special program to decrease reaction time (speed). After the course, the women had an average reaction time of 1.5 seconds. Assume that the mean reaction time for
For each of the following samples that were given an experimental treatment, test whether they represent populations that score significantly higher than the general population: (a) a sample of 100 with a mean of 82 and (b) a sample of 10 with a mean of 84. The general population of individuals has
For each of the following samples that were given an experimental treatment, test whether these samples represent populations that are different from the general population:(a) a sample of 10 with a mean of 44, (b) a sample of 1 with a mean of 48. The general population of individuals has a mean of
ADVANCED TOPIC: Figure the 99% confidence interval (that is, the lower and upper confidence limits) for each part of problem 3. Assume that in each case the researcher’s sample has a mean of 10 and that the population of individuals is known to follow a normal curve.
ADVANCED TOPIC: Figure the 95% confidence interval (that is, the lower and upper confidence limits) for each part of problem 2. Assume that in each case the researcher’s sample has a mean of 100 and that the population of individuals is known to follow a normal curve.
For a population that has a standard deviation of 20, figure the standard deviation of the distribution of means for samples of size (a) 2, (b) 3, (c) 4, and (d) 9.
For a population that has a standard deviation of 10, figure the standard deviation of the distribution of means for samples of size (a) 2, (b) 3, (c) 4, and (d) 9.
Why is the standard deviation of the distribution of means generally smaller than the standard deviation of the distribution of the population of individuals?
Explain how and why the scores from Steps ❸ and ❹ of the hypothesis-testing process are compared. Explain the meaning of the result of this comparison with regard to the specific research and null hypotheses being tested.
Describe why and how you figure the Z score of the sample mean on the comparison distribution.
Describe the logic and process for determining (using the normal curve) the cutoff sample score(s) on the comparison distribution at which the null hypothesis should be rejected. (a) Population M = 15 Population SD = 25 Population SD = 5 Raw Scores: 5 10 15 20 25 Z Scores: -2 -1 0 +1 +2 (b)
Explain the concept of the comparison distribution. Be sure to mention that with a sample of more than one, the comparison distribution is a distribution of means because the information from the study is a mean of a sample. Mention that the distribution of means has the same mean as the population
Describe the core logic of hypothesis testing in this situation. Be sure to explain the meaning of the research hypothesis and the null hypothesis in this situation where we focus on the mean of a sample and compare it to a known population mean. Explain the concept of support being provided for
A researcher predicts that showing a certain film will change people’s attitudes toward alcohol. The researcher then randomly selects 36 people, shows them the film, and gives them an attitude questionnaire. The mean score on the attitude test for these 36 people is 70. The score on this test for
What is a 95% confidence interval?
(a) What number is used to indicate the accuracy of an estimate of the population mean? (b) Why?
(a) What is the best estimate of a population mean? (b) Why?
A researcher predicts that showing a certain film will change people’s attitudes toward alcohol. The researcher then randomly selects 36 people, shows them the film, and gives them an attitude questionnaire. The mean score on the attitude test for these 36 people is 70. The score for people in
How do you find the Z score for the sample’s mean on the distribution of means?
How is hypothesis testing with a sample of more than one person different from hypothesis testing with a sample of a single person?
A population of individuals has a normal distribution, a mean of 60, and a standard deviation of 10. What are the characteristics of a distribution of means from this population for samples of four each?
(a) What is the standard error (SE)? (b) Why does it have this name?
Write the formula for the variance of the distribution of means, and define each of the symbols.
(a) Why is the mean of the distribution of means the same as the mean of the population of individuals? (b) Why is the variance of a distribution of means smaller than the variance of the distribution of the population of individuals?
Explain how you could create a distribution of means by taking a large number of samples of four individuals each.
What is a distribution of means?
For each of the following studies, make a chart of the four possible correct and incorrect decisions, and explain what each would mean. Each chart should be laid out like Table 3, but put into the boxes the possible results, using the names of the variables involved in the study.(a) A study of
In an article about anti-tobacco campaigns, Siegel and Biener (1997) discuss the results of a survey of tobacco usage and attitudes conducted in Massachusetts in 1993 and 1995; Table 4 shows the results of this survey. Focusing on just the first line (the percentage smoking cigarettes daily),
Earlier in the chapter, we described the results of a study conducted by Gentile(2009), in which American youth completed a survey about their use of video games.In his results section, Gentile reported, “[T]here was a sizable difference between boys’ average playing time [of video games] (M =
A researcher predicts that listening to classical music while solving math problems will make a particular brain area more active. To test this, a research participant has her brain scanned while listening to classical music and solving math problems, and the brain area of interest has a percent
A researcher developed an elaborate training program to reduce the stress of childless men who marry women with adolescent children. It is known from previous research that such men, one month after moving in with their new wife and her children, have a stress level of 85 with a standard deviation
A researcher wants to test whether a certain sound will make rats do worse on learning tasks. It is known that an ordinary rat can learn to run a particular maze correctly in 18 trials, with a standard deviation of 6. (The number of trials to learn this maze is normally distributed. More trials
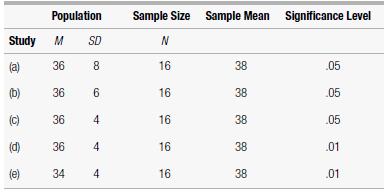
Based on the information given for each of the following studies, decide whether to reject the null hypothesis. For each, give (a) the Z-score cutoff (or cutoffs)on the comparison distribution at which the null hypothesis should be rejected,(b) the Z score on the comparison distribution for the
Based on the information given for each of the following studies, decide whether to reject the null hypothesis. For each, give (a) the Z-score cutoff (or cutoffs)on the comparison distribution at which the null hypothesis should be rejected,(b) the Z score on the comparison distribution for the
For each of the following, (a) state which two populations are being compared,(b) state the research hypothesis, (c) state the null hypothesis, and (d) say whether you should use a one-tailed or two-tailed test and why.i. In an experiment, people are told to solve a problem by focusing on the
When a result is significant, explain why it is wrong to say the result “proves” the research hypothesis.
List the five steps of hypothesis testing and explain the procedure and logic of each.
You conduct a research study. How can you know (a) if you have made a Type I error? and (b) if you have made a Type II error?
For each of the following studies, make a chart of the four possible correct and incorrect decisions, and explain what each would mean. Each chart should be laid out like Table 3, but you should put into the boxes the possible results, using the names of the variables involved in the study.(a) A
Reber and Kotovsky (1997), in a study of problem solving, described one of their results comparing a specific group of participants within their overall control condition as follows: “This group took an average of 179 moves to solve the puzzle, whereas the rest of the control participants took an
Robins and John (1997) carried out a study on narcissism (extreme self-love), comparing people who scored high versus low on a narcissism questionnaire.(An example item was “If I ruled the world, it would be a better place.”) They also had other questionnaires, including one that had an item
A nursing researcher is working with people who have had a particular type of major surgery. This researcher proposes that people will recover from the operation more quickly if friends and family are in the room with them for the first 48 hours after the operation. It is known that time to recover
A researcher studying the senses of taste and smell has carried out many studies in which students are given each of 20 different foods (apricot, chocolate, cherry, coffee, garlic, etc.). She administers each food by dropping a liquid on the tongue. Based on her past research, she knows that for
Based on the information given for each of the following studies, decide whether to reject the null hypothesis. For each, give (a) the Z-score cutoff (or cutoffs)on the comparison distribution at which the null hypothesis should be rejected,(b) the Z score on the comparison distribution for the
Based on the information given for each of the following studies, decide whether to reject the null hypothesis. For each, give (a) the Z-score cutoff (or cutoffs) on the comparison distribution at which the null hypothesis should be rejected, (b)the Z score on the comparison distribution for the
For each of the following, (a) say which two populations are being compared,(b) state the research hypothesis, (c) state the null hypothesis, and (d) say whether you should use a one-tailed or two-tailed test and why.i. Do Canadian children whose parents are librarians score higher than Canadian
When a result is not extreme enough to reject the null hypothesis, explain why it is wrong to conclude that your result supports the null hypothesis.
Define the following terms in your own words: (a) hypothesis-testing procedure,(b) .05 significance level, and (c) two-tailed test.
Explain how and why the scores from Steps ❸ and ❹ of the hypothesistesting process are compared. Explain the meaning of the result of this comparison with regard to the specific research and null hypotheses being tested.
Describe how to figure the sample’s score on the comparison distribution.
Describe the logic and process for determining (using the normal curve) the cutoff sample scores on the comparison distribution at which you should reject the null hypothesis.
Explain the concept of the comparison distribution. Be sure to mention that it is the distribution that represents the population situation if the null hypothesis is true. Note that the key characteristics of the comparison distribution are its mean, standard deviation, and shape.
Describe the core logic of hypothesis testing. Be sure to explain terminology such as research hypothesis and null hypothesis, and explain the concept of providing support for the research hypothesis when the study results are strong enough to reject the null hypothesis.
If you set an extreme significance level (say, .001), what is the effect on the probability of (a) Type I error and (b) Type II error?
If you set a lenient significance level (say, .25), what is the effect on the probability of (a) Type I error and (b) Type II error?
(a) What is a Type II error? (b) Why is it possible?
(a) What is a Type I error? (b) Why is it possible? (c) What is its probability?
Showing 2400 - 2500
of 7357
First
18
19
20
21
22
23
24
25
26
27
28
29
30
31
32
Last
Step by Step Answers