

The table shows quarterly data for motor vehicle taxes collected by the federal government in Australia for
Question:
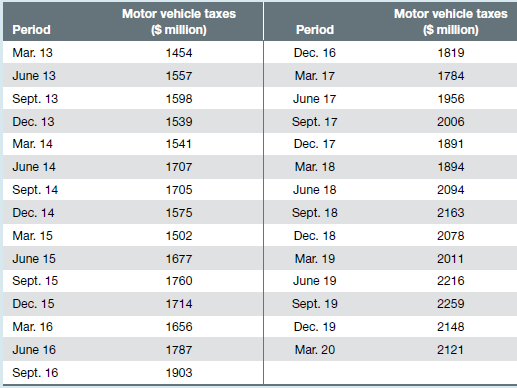
The table shows quarterly data for motor vehicle taxes collected by the federal government in Australia for the period March 2013 to March 2020.
(a) Develop 2-lag and 4-lag models.
(b) Determine the forecast for the June 2020 quarter.
(c) Compute a Durbin?Watson statistic to determine whether significant autocorrelation is present in the models. Use an alpha of 0.05.
(d) Comment on the appropriateness of the models based on your results in (a) and the goodness of- fit measures.
Fantastic news! We've Found the answer you've been seeking!
Step by Step Answer:
a Period Y t 1lag 2lag 3lag 4lag Mar13 1454 Jun13 1557 1454 Sep13 1598 1557 1454 Dec13 1539 1598 1557 1454 Mar14 1541 1539 1598 1557 1454 Jun14 1707 1541 1539 1598 1557 Sep14 1705 1707 1541 1539 1598 ...View the full answer

Answered By
JAPHETH KOGEI
Hi there. I'm here to assist you to score the highest marks on your assignments and homework. My areas of specialisation are:
Auditing, Financial Accounting, Macroeconomics, Monetary-economics, Business-administration, Advanced-accounting, Corporate Finance, Professional-accounting-ethics, Corporate governance, Financial-risk-analysis, Financial-budgeting, Corporate-social-responsibility, Statistics, Business management, logic, Critical thinking,
So, I look forward to helping you solve your academic problem.
I enjoy teaching and tutoring university and high school students. During my free time, I also read books on motivation, leadership, comedy, emotional intelligence, critical thinking, nature, human nature, innovation, persuasion, performance, negotiations, goals, power, time management, wealth, debates, sales, and finance. Additionally, I am a panellist on an FM radio program on Sunday mornings where we discuss current affairs.
I travel three times a year either to the USA, Europe and around Africa.
As a university student in the USA, I enjoyed interacting with people from different cultures and ethnic groups. Together with friends, we travelled widely in the USA and in Europe (UK, France, Denmark, Germany, Turkey, etc).
So, I look forward to tutoring you. I believe that it will be exciting to meet them.
2+ Reviews
10+ Question Solved
Related Book For 
Business Analytics And Statistics
ISBN: 9780730363330
1st Edition
Authors: Ken Black, John Asafu Adjaye, Paul Burke, Nelson Perera, Carl Sherwood, Saleh A. Wasimi
Question Posted:
