New Semester
Started
Get
50% OFF
Study Help!
--h --m --s
Claim Now
Question Answers
Textbooks
Find textbooks, questions and answers
Oops, something went wrong!
Change your search query and then try again
S
Books
FREE
Study Help
Expert Questions
Accounting
General Management
Mathematics
Finance
Organizational Behaviour
Law
Physics
Operating System
Management Leadership
Sociology
Programming
Marketing
Database
Computer Network
Economics
Textbooks Solutions
Accounting
Managerial Accounting
Management Leadership
Cost Accounting
Statistics
Business Law
Corporate Finance
Finance
Economics
Auditing
Tutors
Online Tutors
Find a Tutor
Hire a Tutor
Become a Tutor
AI Tutor
AI Study Planner
NEW
Sell Books
Search
Search
Sign In
Register
study help
mathematics
basic technical mathematics
Basic Technical Mathematics 12th Edition Allyn J. Washington, Richard Evans - Solutions
Determine each of the following as being either true or false. If it is false, explain why.For a normal distribution for which μ = 10 and σ = 5, the z-scores for x = 20 and x = 30 are z = 1.5 and z = 2.5
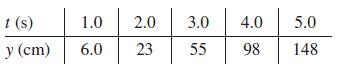
The following data were found for the distance y that an object rolled down an inclined plane in time t. Find a quadratic regression model for these data. Predict the distance at 2.5 s. t (s) y (cm) 1.0 2.0 6.0 3.0 4.0 23 55 98 5.0 148
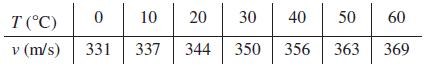
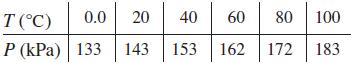
Find the equation of the least-squares line for the given data. Graph the line and data points on the same graph.The speed v (in m/s) of sound was measured as a function of the temperature T (in °C) with the following results. Find v as a function of T. T (°C) v (m/s) 0 10 20 331 337 344 30
Determine the median of the numbers of the given set.Set AA: 3, 6, 4, 2, 5, 4, 7, 6, 3, 4, 6, 4, 5, 7, 3
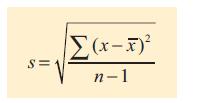
Use Eq. (22.2) to find the standard deviation s for the indicated sets of numbers.Eq. 22.2Set DD: 105, 108, 103, 108, 106, 104, 109, 104, 110, 108, 108, 104, 113, 106, 107, 106, 107, 109, 105, 111, 109, 108 S= Σ(x-5) I-u
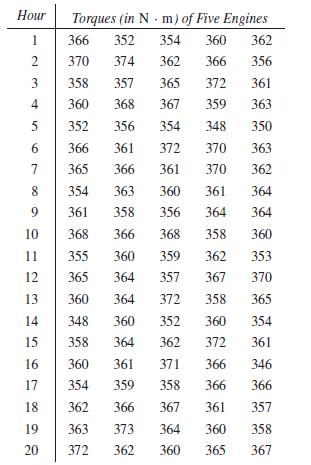
Five automobile engines are taken from the production line each hour and tested for their torque (in N · m) when rotating at a constant frequency. The measurements of the sample torques for 20 h of testing are as follows:Find the central line, UCL, and LCL for the range.
Whether or not a product passes inspectionIndicate whether the variable is qualitative or quantitative.
The amounts of energy produced by a solar panel on a sample of 10 days are given below. Make a stem-and-leaf plot of the data.9.4 8.5 10.7 9.6 7.2 8.7 8.2 9.1 7.9 9.4
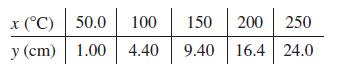
The increase in length y of a certain metallic rod was measured in relation to particular increases x in temperature. Find a quadratic regression model for the given data. x (°C) y (cm) 50.0 100 1.00 4.40 150 200 250 9.40 16.4 24.0
If the weights of cement bags are normally distributed with a mean of 60 lb and a standard deviation of 1 lb, use the empirical rule to find the percent of the bags that weigh the following:Between 58 lb and 62 lb
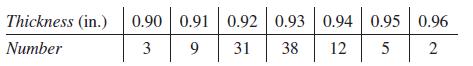
The thickness of 100 machine parts were measured (to the nearest 0.01 in.) and the grouped data is shown below:Find the mean. Thickness (in.) 0.90 0.91 0.92 0.93 0.94 0.95 0.96 Number 3 9 31 38 12 5 2
Determine each of the following as being either true or false. If it is false, explain why.If the least-squares line for a set of data is y = 2x + 4, the deviation of the data point (2, 6) is 4.
Determine the median of the numbers of the given set.Set BB: 25, 26, 23, 24, 25, 28, 26, 27, 23, 28, 25
The time it takes a worker to complete a taskIndicate whether the variable is qualitative or quantitative.
If the weights of cement bags are normally distributed with a mean of 60 lb and a standard deviation of 1 lb, use the empirical rule to find the percent of the bags that weigh the following:Between 59 lb and 61 lb
In linear regression, a value of r close to 0 indicates a good fit.Determine each of the following as being either true or false. If it is false, explain why.
Determine the median of the numbers of the given set.Set CC: 0.48, 0.53, 0.49, 0.45, 0.55, 0.49, 0.47, 0.55, 0.48, 0.57, 0.51, 0.46, 0.53, 0.50, 0.49, 0.53
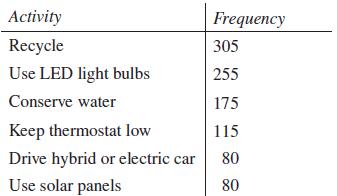
In a random sample, 500 adults aged 30+ were asked which of the following environmentally friendly activities they do or plan to do soon. The results are summarized below:Make a bar graph of these data showing frequency on the vertical axis. Activity Recycle Use LED light bulbs Conserve water Keep
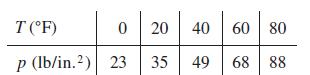
The pressure p at which Freon, a refrigerant, vaporizes for temperature T is given in the following table. Find a quadratic regression model. Predict the vaporization pressure at 30°F. T (°F) p (lb/in.2) 0 20 40 6 23 35 49 68 88 60 80
Five automobile engines are taken from the production line each hour and tested for their torque (in N · m) when rotating at a constant frequency. The measurements of the sample torques for 20 h of testing are as follows:Plot the x̄ chart.
The thickness of 100 machine parts were measured (to the nearest 0.01 in.) and the grouped data is shown below:Find the standard deviation. Thickness (in.) 0.90 0.91 0.92 0.93 0.94 0.95 0.96 Number 3 9 31 38 12 5 2
Use Eq. (22.3) to find the standard deviation s for the indicated sets of numbers.Eq. 22.3Set BB: 25, 26, 23, 24, 25, 28, 26, 27, 23, 28, 25 S = 2 n(Σκ) - (Σ») n( n − 1)
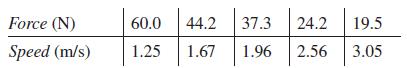
A particular muscle was tested for its speed of shortening as a function of the force applied to it. The results appear below. Find the speed as a function of the force. Then predict the speed if the force is 15.0 N. Is this interpolation or extrapolation? Force (N) Speed (m/s) 60.0 1.25 44.2 37.3
If the weights of cement bags are normally distributed with a mean of 60 lb and a standard deviation of 1 lb, use the empirical rule to find the percent of the bags that weigh the following:Less than 63 lb
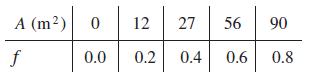
A fraction f of annual hot-water loads at a certain facility are heated by solar energy. The fractions f for certain values of the collector area A are given in the following table. Find a power regression model for these data. A (m²) 0 12 27 56 90 f 0.0 0.2 0.4 0.6 0.8
Five automobile engines are taken from the production line each hour and tested for their torque (in N · m) when rotating at a constant frequency. The measurements of the sample torques for 20 h of testing are as follows:Plot the R chart.
In a random sample, 500 adults aged 30+ were asked which of the following environmentally friendly activities they do or plan to do soon. The results are summarized below:Find the relative frequency for each activity. Activity Recycle Use LED light bulbs Conserve water Keep thermostat low Drive
The thickness of 100 machine parts were measured (to the nearest 0.01 in.) and the grouped data is shown below:Make a relative frequency table. Thickness (in.) 0.90 0.91 0.92 0.93 0.94 0.95 0.96 Number 3 9 31 38 12 5 2
An airline’s records showed that the percent of on-time flights each day for a 20-day period was as follows:72, 75, 76, 70, 77, 73, 80, 75, 82, 85,77, 78, 74, 86, 72, 77, 67, 78, 69, 80Determine the median.
Use Eq. (22.3) to find the standard deviation s for the indicated sets of numbers.Eq. 22.3Set CC: 0.48, 0.53, 0.49, 0.45, 0.55, 0.49, 0.47, 0.55, 0.48, 0.57, 0.51, 0.46, 0.53, 0.50, 0.49, 0.53 S = 2 n(Σκ) - (Σ») n( n − 1)
Determine the median of the numbers of the given set.Set DD: 105, 108, 103, 108, 106, 104, 109, 104, 110, 108, 108, 104, 113, 106, 107, 106, 107, 109, 105, 111, 109, 108
If the weights of cement bags are normally distributed with a mean of 60 lb and a standard deviation of 1 lb, use the empirical rule to find the percent of the bags that weigh the following:More than 62 lb
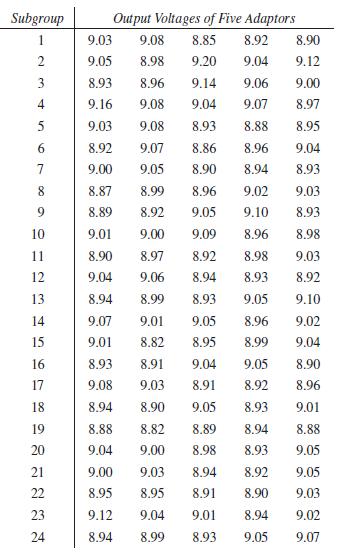
Five AC adaptors that are used to charge batteries of a cellular phone are taken from the production line each 15 min and tested for their direct-current output voltage. The output voltages for 24 sample subgroups are as follows:Find the central line, UCL, and LCL for the mean.
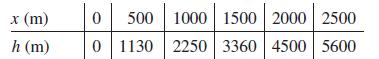
The altitude h (in m) of a rocket was measured at several positions at a horizontal distance x (in m) from the launch site, shown in the table. Find the least-squares line for has a function of x. x (m) h (m) 0 500 1000 1500 2000 2500 0 1130 2250 3360 4500 5600
An airline’s records showed that the percent of on-time flights each day for a 20-day period was as follows:72, 75, 76, 70, 77, 73, 80, 75, 82, 85,77, 78, 74, 86, 72, 77, 67, 78, 69, 80Determine the mode.
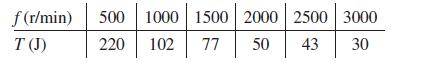
The output torque (in J) of a certain engine was measured at various frequencies (in r/min) with the following results. Find a power regression model for these data. Predict the output torque for a frequency of 3500 r/min. Is this interpolation or extrapolation? f (r/min) T (J) 500 1000 1500 2000
In a random sample, 500 adults aged 30+ were asked which of the following environmentally friendly activities they do or plan to do soon. The results are summarized below:Is it appropriate to use a pie chart for these data? Explain why or why not. Activity Recycle Use LED light bulbs Conserve
Use Eq. (22.3) to find the standard deviation s for the indicated sets of numbers.Eq. 22.3Set DD: 105, 108, 103, 108, 106, 104, 109, 104, 110, 108, 108, 104, 113, 106, 107, 106, 107, 109, 105, 111, 109, 108 S = 2 n(Σκ) - (Σ») n( n − 1)
Determine the mean of the numbers of the given set.Set AA: 3, 6, 4, 2, 5, 4, 7, 6, 3, 4, 6, 4, 5, 7, 3
In testing an air-conditioning system, the temperature T in a building was measured during the afternoon hours with the results shown in the table. Find the least-squares line for T as a function of the time t from noon. Then predict the temperature when t = 2.5. Is this interpolation or
In a random sample, 500 adults aged 30+ were asked which of the following environmentally friendly activities they do or plan to do soon. The results are summarized below:Make a bar graph of these data showing relative frequency on the vertical axis. Activity Recycle Use LED light bulbs Conserve
Use the following information. At a certain customer call-in center, the customer hold time is normally distributed with a mean of 5.2 min and a standard deviation of 1.4 min.According to the empirical rule, what percentage of hold times are between 3.8 min and 6.6 min?
A standardized math test has a mean score of 200 and a standard deviation of 15. Find and interpret the z-scores of the following math test scores.218
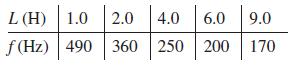
The resonant frequency f of an electric circuit containing a 4-μF capacitor was measured as a function of the inductance L in the circuit. The following data were found. Find a power regression model for these data. L (H) 1.0 f(Hz) 490 2.0 4.0 6.0 360 250 200 9.0 170
An airline’s records showed that the percent of on-time flights each day for a 20-day period was as follows:72, 75, 76, 70, 77, 73, 80, 75, 82, 85,77, 78, 74, 86, 72, 77, 67, 78, 69, 80Determine the mean.
Five AC adaptors that are used to charge batteries of a cellular phone are taken from the production line each 15 min and tested for their direct-current output voltage. The output voltages for 24 sample subgroups are as follows:Find the central line, UCL, and LCL for the range.
Determine the mean of the numbers of the given set.Set BB: 25, 26, 23, 24, 25, 28, 26, 27, 23, 28, 25
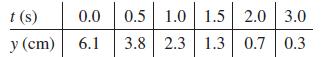
The displacement y of an object at the end of a spring at given times t is shown in the following table. Find an exponential regression model for this. Predict the displacement at 2.5 s. Is this interpolation or extrapolation? t (s) y (cm) 0.0 0.5 1.0 1.5 2.0 3.0 6.1 3.8 2.3 1.3 0.7 0.3
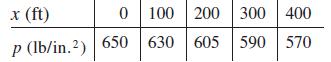
The pressure p was measured along an oil pipeline at different distances from a reference point, with results as shown. Find the least-squares line for p as a function of x using a calculator. Then predict the pressure at a distance of x = 500 ft . Is this interpolation or extrapolation? x (ft) p
Find and interpret the z-score of a hold time of 8.7 min.Use the following information. At a certain customer call-in center, the customer hold time is normally distributed with a mean of 5.2 min and a standard deviation of 1.4 min
A standardized math test has a mean score of 200 and a standard deviation of 15. Find and interpret the z-scores of the following math test scores.179
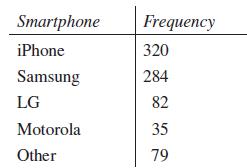
In a random sample, 800 smartphone owners were asked which type of smartphone they would choose with their next purchase (if they could only choose one). The results are summarized below:Find the relative frequencies, rounded to the nearest tenth of a percent.
An airline’s records showed that the percent of on-time flights each day for a 20-day period was as follows:72, 75, 76, 70, 77, 73, 80, 75, 82, 85,77, 78, 74, 86, 72, 77, 67, 78, 69, 80Determine the standard deviation.
Use the statistical feature of a calculator to find the mean and the standard deviation s for the indicated sets of numbers.Set AA: 3, 6, 4, 2, 5, 4, 7, 6, 3, 4, 6, 4, 5, 7, 3
Five AC adaptors that are used to charge batteries of a cellular phone are taken from the production line each 15 min and tested for their direct-current output voltage. The output voltages for 24 sample subgroups are as follows:Plot the x̄ chart.
Determine the mean of the numbers of the given set.Set CC: 0.48, 0.53, 0.49, 0.45, 0.55, 0.49, 0.47, 0.55, 0.48, 0.57, 0.51, 0.46, 0.53, 0.50, 0.49, 0.53
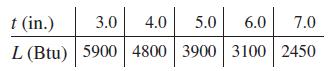
The heat loss L per hour through various thicknesses of a particular type of insulation was measured as shown in the table. Find the least-squares line for L as a function of t using a calculator. t (in.) 3.0 4.0 5.0 6.0 7.0 L (Btu) 5900 4800 3900 3100 2450
An airline’s records showed that the percent of on-time flights each day for a 20-day period was as follows:72, 75, 76, 70, 77, 73, 80, 75, 82, 85,77, 78, 74, 86, 72, 77, 67, 78, 69, 80Construct a frequency distribution table with class limits of 67, 71, 75, 79, 83, and 87.
Use the following information. At a certain customer call-in center, the customer hold time is normally distributed with a mean of 5.2 min and a standard deviation of 1.4 min.What percent of hold times are less than 7.3 min?
A standardized math test has a mean score of 200 and a standard deviation of 15. Find and interpret the z-scores of the following math test scores.164
Use the statistical feature of a calculator to find the mean and the standard deviation s for the indicated sets of numbers.Set BB: 25, 26, 23, 24, 25, 28, 26, 27, 23, 28, 25
In a random sample, 800 smartphone owners were asked which type of smartphone they would choose with their next purchase (if they could only choose one). The results are summarized below:What is the sum of the relative frequencies found in Exercise 11? Why is this sum not exactly 100%?Data from
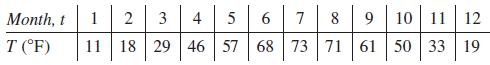
The average daily temperatures T (in °F ) for each month in Minneapolis (National Weather Service records) are given in the following table. (1 = Jan, 2 = Feb, etc.).Find a sinusoidal regression model for these data. Month, t T (°F) 1 2 3 4 11 18 29 46 5 6 7 8 9 10 11 12 57 68 73 71 61 50 33 19
Five AC adaptors that are used to charge batteries of a cellular phone are taken from the production line each 15 min and tested for their direct-current output voltage. The output voltages for 24 sample subgroups are as follows:Plot the R chart.
Determine the mean of the numbers of the given set.Set DD: 105, 108, 103, 108, 106, 104, 109, 104, 110, 108, 108, 104, 113, 106, 107, 106, 107, 109, 105, 111, 109, 108
A standardized math test has a mean score of 200 and a standard deviation of 15. Find and interpret the z-scores of the following math test scores.233
Each hour, for 20 consecutive hours, a sample of 5 M&M packets are randomly selected and their weights are measured. Explain how these data can be used to make an R control chart.
An airline’s records showed that the percent of on-time flights each day for a 20-day period was as follows:72, 75, 76, 70, 77, 73, 80, 75, 82, 85,77, 78, 74, 86, 72, 77, 67, 78, 69, 80Make a stem-and-leaf plot of these data using split stems.
What happens to the standard error of the mean as n increases? Use the formula for the standard error to help explain your answer.The lifetimes of a certain type of automobile tire have been found to be distributed normally with a mean lifetime of 100,000 km and a standard deviation of 10,000
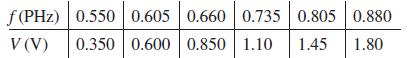
In an experiment on the photoelectric effect, the frequency of light being used was measured as well as the stopping potential (the voltage just sufficient to stop the photoelectric effect) with the results given below. Use a calculator to find the least-squares line for V as a function of f. The
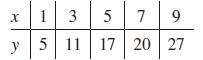
Find the equation of the least-squares line for the points indicated in the following table. Graph the line and data points on the same graph. X 1 3 5 7 9 y 5 11 17 20 27
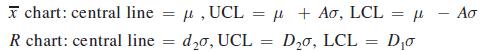
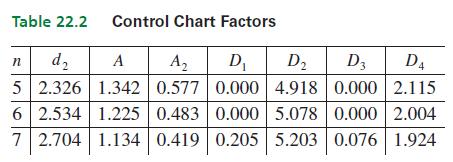
For a production process for which there is a great deal of data since its last modification, the population mean μ and population standard deviation σ are assumed known. For such a process, we have the following values (using additional statistical analysis):The values of A, d2, D2, and D1 are
If gas is cooled under conditions of constant volume, it is noted that the pressure falls nearly proportionally as the temperature. If this were to happen until there was no pressure, the theoretical temperature for this case is referred to as absolute zero. In an elementary experiment, the
In a random sample, 800 smartphone owners were asked which type of smartphone they would choose with their next purchase (if they could only choose one). The results are summarized below:Use the relative frequencies to make a pie chart of these data.
In a random sample, 800 smartphone owners were asked which type of smartphone they would choose with their next purchase (if they could only choose one). The results are summarized below:Make a bar graph of these data using the frequencies.
Use the statistical feature of a calculator to find the mean and the standard deviation s for the indicated sets of numbers.Set CC: 0.48, 0.53, 0.49, 0.45, 0.55, 0.49, 0.47, 0.55, 0.48, 0.57, 0.51, 0.46, 0.53, 0.50, 0.49, 0.53
According to the empirical rule, what percent of the batteries have voltages between 1.45 V and 1.55 V?It has been previously established that for a certain type of AA battery (when newly produced), the voltages are distributed normally with μ = 1.50 V and σ = 0.05 V.
Determine the mode of the numbers of the given set.Set AA: 3, 6, 4, 2, 5, 4, 7, 6, 3, 4, 6, 4, 5, 7, 3
An airline’s records showed that the percent of on-time flights each day for a 20-day period was as follows:72, 75, 76, 70, 77, 73, 80, 75, 82, 85,77, 78, 74, 86, 72, 77, 67, 78, 69, 80Draw a histogram for the data using the table from Exercise 11.Data from Exercises 11Construct a frequency
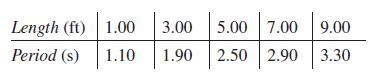
The period of a pendulum as a function of its length was measured, giving the following results:Find the equation of the power regression model for these data. Length (ft) Period (s) 1.00 1.10 3.00 5.00 7.00 9.00 1.90 2.50 2.90 3.30
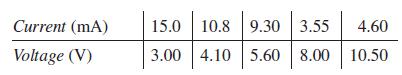
Find and interpret the values of r and r2 for the given data.Exercise 7Data from Exercises 7In an electrical experiment, the following data were found for the values of current and voltage for a particular element of the circuit. Find the voltage V as a function of the current i. Then predict the
For a production process for which there is a great deal of data since its last modification, the population mean μ and population standard deviation σ are assumed known. For such a process, we have the following values (using additional statistical analysis):The values of A, d2, D2, and D1 are
Use the statistical feature of a calculator to find the mean and the standard deviation s for the indicated sets of numbers.Set DD: 105, 108, 103, 108, 106, 104, 109, 104, 110, 108, 108, 104, 113, 106, 107, 106, 107, 109, 105, 111, 109, 108
Find the standard deviation for the indicated sets of numbers. A calculator may be used.The miles traveled in Exercise 15Data from Exercises 15Use the following data. In testing a new electric engine, an automobile company randomly selected 20 cars of a certain model and recorded the range (in mi)
What percent of the batteries have voltages between 1.52 V and 1.58 V?It has been previously established that for a certain type of AA battery (when newly produced), the voltages are distributed normally with μ = 1.50 V and σ = 0.05 V
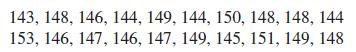
In testing a new electric engine, an automobile company randomly selected 20 cars of a certain model and recorded the range (in mi) that the car could travel before the batteries needed recharging. The results are shown below.Using the classes 141−44, 144 −147, . . . , 153−156, form a
Determine the mode of the numbers of the given set.Set BB: 25, 26, 23, 24, 25, 28, 26, 27, 23, 28, 25
For a production process for which there is a great deal of data since its last modification, the population mean μ and population standard deviation σ are assumed known. For such a process, we have the following values (using additional statistical analysis):The values of A, d2, D2, and D1 are
An airline’s records showed that the percent of on-time flights each day for a 20-day period was as follows:72, 75, 76, 70, 77, 73, 80, 75, 82, 85,77, 78, 74, 86, 72, 77, 67, 78, 69, 80Construct a relative frequency table for the data using the class limits given in Exercise 11.Data from
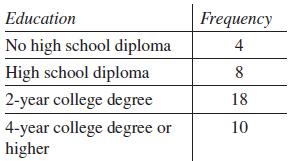
For the employees of a certain business, the highest education level is summarized below:Use the frequencies to make a bar graph of these data. Education No high school diploma High school diploma 2-year college degree 4-year college degree or higher Frequency 4 8 18 10
In testing a new electric engine, an automobile company randomly selected 20 cars of a certain model and recorded the range (in mi) that the car could travel before the batteries needed recharging. The results are shown below.Find the relative frequencies for the classes given in Exercise 15.Data
Find and interpret the values of r and r2 for the given data.Exercise 8Data from Exercises 8A particular muscle was tested for its speed of shortening as a function of the force applied to it. The results appear below. Find the speed as a function of the force. Then predict the speed if the force
What percent of the batteries have voltages below 1.54 V?It has been previously established that for a certain type of AA battery (when newly produced), the voltages are distributed normally with μ = 1.50 V and σ = 0.05 V.
Determine the mode of the numbers of the given set.Set CC: 0.48, 0.53, 0.49, 0.45, 0.55, 0.49, 0.47, 0.55, 0.48, 0.57, 0.51, 0.46, 0.53, 0.50, 0.49, 0.53
Find and interpret the values of r and r2 for the given data.Exercise 10Data from Exercises 10In testing an air-conditioning system, the temperature T in a building was measured during the afternoon hours with the results shown in the table. Find the least-squares line for T as a function of the
For a production process for which there is a great deal of data since its last modification, the population mean μ and population standard deviation σ are assumed known. For such a process, we have the following values (using additional statistical analysis):The values of A, d2, D2, and D1 are
For the employees of a certain business, the highest education level is summarized below:Using relative frequencies, make a pie chart of these data. Education No high school diploma High school diploma 2-year college degree 4-year college degree or higher Frequency 4 8 18 10
Find the standard deviation for the indicated sets of numbers. A calculator may be used.The following data giving the mean number of days of rain for Vancouver, B.C., for the 12 months of the year20, 17, 17, 14, 12, 11, 7, 8, 9, 16, 19, 22
Find the standard deviation for the indicated sets of numbers. A calculator may be used.The number of apps in ExerciseData from Exercises 19 Use the following data. In a random sample, 30 Android users were asked to record the number of apps that were installed on their phone. The resulting
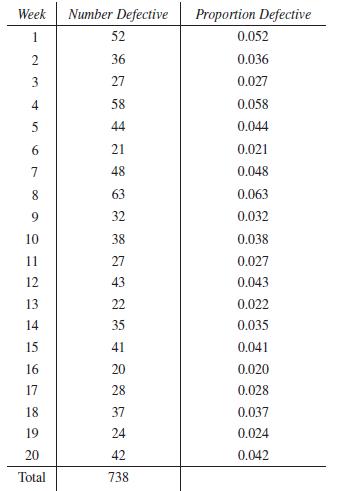
A manufacturer of drone propellers randomly selects 1000 propellers from the production line each week and inspects them for defects. The number of defective propellers, along with the proportion of defective propellers, is given in the following table for a 20-week period:For the p chart, find the
Showing 200 - 300
of 9193
1
2
3
4
5
6
7
8
9
10
11
12
13
14
15
Last
Step by Step Answers