New Semester
Started
Get
50% OFF
Study Help!
--h --m --s
Claim Now
Question Answers
Textbooks
Find textbooks, questions and answers
Oops, something went wrong!
Change your search query and then try again
S
Books
FREE
Study Help
Expert Questions
Accounting
General Management
Mathematics
Finance
Organizational Behaviour
Law
Physics
Operating System
Management Leadership
Sociology
Programming
Marketing
Database
Computer Network
Economics
Textbooks Solutions
Accounting
Managerial Accounting
Management Leadership
Cost Accounting
Statistics
Business Law
Corporate Finance
Finance
Economics
Auditing
Tutors
Online Tutors
Find a Tutor
Hire a Tutor
Become a Tutor
AI Tutor
AI Study Planner
NEW
Sell Books
Search
Search
Sign In
Register
study help
mathematics
business statistics
Elementary Statistics A Step By Step Approach 10th Edition Allan G. Bluman - Solutions
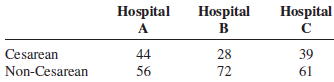
The national Cesarean delivery rate for a recent year was 32.2% (number of live births performed by Cesarean section). A random sample of 100 birth records from three large hospitals showed the following results for type of birth. Test for homogeneity of proportions using α = 0.10.
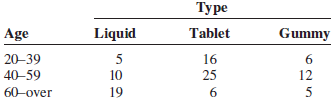
A medical researcher wishes to determine if the type of vitamin pills taken is related to the age of the person. The data are shown. At α = 0.10, is the type of vitamin related to the age of the person taking the vitamin? Type Tablet Gummy Age 20-39 40-59 60-over Liquid 5 10 19 16 25
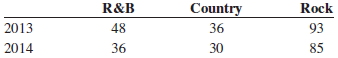
Are the sales of CDs (in millions) by genre related to the year in which the sales occurred? Use the 0.05 level of significance. R&B Country 36 Rock 93 85 2013 2014 48 36 30
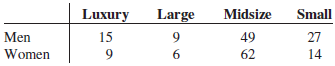
A study was done on the type of automobiles owned by women and men. The data are shown. At α = 0.10, is there a relationship between the type of automobile owned and the gender of the individual? Luxury Large Midsize 49 62 Small 27 14 Men Women 15
In a recent year U.S. retail automobile sales were categorized as listed below.luxury 16.0% large 4.6% midsize 39.8% small 39.6%A random sample of 150 recent purchases indicated the following results: 25 were luxury models, 12 were large cars,
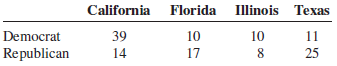
Four states were randomly selected, and their members in the U.S. House of Representatives (114th Congress) are noted. At α = 0.10, can it be concluded that there is a dependent relationship between the state and the political party affiliation of its representatives? Illinois Texas
According to the National Safety Council, 10% of the annual deaths from firearms were victims from birth through 19 years of age. Half of the deaths from firearms were victims aged 20 through 44 years, and 40% of victims were aged 45 years and over. A random sample of 100 deaths by firearms in a
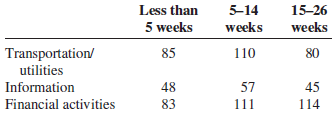
Is the length of unemployment related to the type of industry? A random sample of unemployed workers from three different sectors yielded the following data. At the 0.05 level of significance, are the two categories dependent? Less than 5-14 weeks 15-26 5 weeks weeks 110 85 Transportation/ 80
A store manager wishes to see if the number of absences of her employees is the same for each weekday. She selected a random week and finds the following number of absences.At α = 0.05, is there a difference in the number of absences for each day of the week? Tues Mon 13 Fri Day
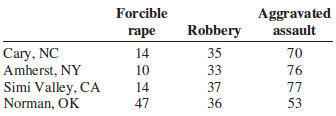
A record of violent crimes for a random sample of cities from the list of U.S. cities with the fewest crimes is shown below. At α = 0.05, is there sufficient evidence to indicate a relationship between the city and the type of crime committed? Aggravated assault Forcible Robbery 35 33
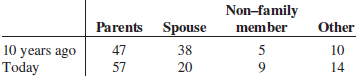
A study was done on the living arrangement of individuals aged 18 to 24 years to see if the proportions of people are different today than those of 10 years ago. The data are shown. At α = 0.05, test the claim. Non-family member 5 Parents Spouse Other 10 14 10 years ago Today 47 38 20
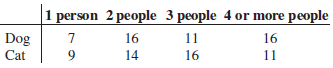
A study of pet owners showed the following information concerning the ownership of the dogs and cats. At α = 0.10, is there a relationship between the number of people in a family and dog or cat ownership? |1 person 2 people 3 people 4 or more people 16 14 11 16 Dog Cat 9. 16
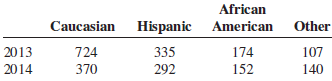
Are movie admissions related to ethnicity? A 2014 study indicated the following numbers of admissions (in thousands) for two different years. At the 0.05 level of significance, can it be concluded that movie attendance by year was dependent upon ethnicity? African Caucasian Hispanic American Other
A researcher surveyed 100 randomly selected teachers in a large school district and found that 46 wanted to extend the school year, 42 did not, and 12 had no opinion. At the 0.05 level of significance, is the distribution different from the national distribution where 45% wished to extend the
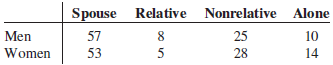
A recent study of 100 individuals found the following living arrangement for men and women. The results are shown. Check the data for a dependent relationship at α = 0.05. Spouse Relative Nonrelative Alone 25 28 Men Women 10 14 57 53 5
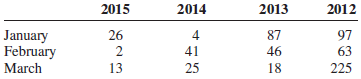
According to records from the Storm Prediction Center, the following numbers of tornadoes occurred in the first quarter of each of years 2012€“2015. Is there sufficient evidence to conclude that a relationship exists between the month and year in which the tornadoes occurred? Use
A medical researcher wishes to see if hospital patients in a large hospital have the same blood type distribution as those in the general population. The distribution for the general population is as follows:type A, 20%; type B, 28%; type O, 36%; and type AB = 16%. He selects a random sample of 50
How are the null and alternative hypotheses stated for the test of homogeneity of proportions?
A professor wishes to see if students show a time preference for statistics classes. A sample of four statistics classes shows the enrollment. At α = 0.01, do the students show a time preference for the classes?
How are the expected values computed for each cell in the table?
A store manager wishes to see if the employees of the store had a preference in the types of music played on the speaker system. A survey of 60 employees stated the type of music they preferred. The data are shown. At α = 0.05, is there a preference? Rock Type Number Classical Pop
When the expected frequency is less than 5 for a specific class, what should be done so that you can use the goodness-of-fit test?
What is the name of the table used in the independence test?
How are the expected values computed for the goodness-of-fit test?
Generally, how would the null and alternative hypotheses be stated for the chi-square independence test?
How are the degrees of freedom computed for the goodness-of-fit test?
How are the degrees of freedom computed for the independence test?
How does the goodness-of-fit test differ from the chi-square variance test?
How is the chi-square independence test similar to the goodness-of-fit test? How is it different?
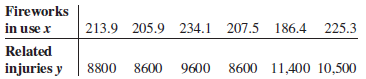
These data were obtained for the years 2009 through 2014 and indicate the number of fireworks (in millions) used and the related injuries. Predict the number of injuries if 100 million fireworks are used during a given year. Fireworks 213.9 205.9 234.1 207.5 186.4 225.3 in use x Related injuries y
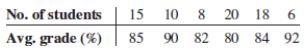
School administrators wondered whether class size and grade achievement (in percent) were related. A random sample of classes revealed the following data. Are the variables linearly related? No. of students 15 10 8 8 20 18 6 Avg. grade (%) 85 90 82 80 84 92
School administrators wondered whether class size and grade achievement (in percent) were related. A random sample of classes revealed the following data.Find yʹ when x = 12.For each exercise, find the equation of the regression line and find the yʹ value for the specified x
The data show the number of stories and the heights (in feet) of a sample of buildings in Chicago.For a building with 55 stories, how high would we expect it be?For each exercise, find the equation of the regression line and find the yʹ value for the specified x value. Remember that no
Is there a relationship between the gestation of a sample of animals and the average longevity in years for a random sample of animals? Gestation x 105 285 238 151 112 5 15 Longevity y 41 10
The data show the gestation period in days and the longevity of the lifetime of the animals in years. Predict yʹ if x = 200 days.For each exercise, find the equation of the regression line and find the yʹ value for the specified x value. Remember that no regression should be
For the same countries used in Exercise 22, the literacy rates (in percents) for both men and women are listed. Is there a linear relationship between the variables? (The information in this exercise will be used for Exercise 23 in Section 10 €“2.) Men (%) 92.6 65.7 27.9 61.5 76.7 43.1
Is there a relationship between the life expectancy for men and the life expectancy for women in a given country? A random sample of nonindustrialized countries was selected, and the life expectancy in years is listed for both men and women. Are the variables linearly related? 72.9 41.9 77.8 44.5
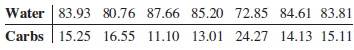
Here are the number of grams of water and the number of grams of carbohydrates for a random selection of raw foods (100 g each). Is there a linear relationship between the variables? Water 83.93 80.76 87.66 85.20 72.85 84.61 83.81 Carbs | 15.25 16.55 11.10 13.01 24.27 14.13 15.11
Is the average age of armed services personnel related to the average amount of length of service in months? The data are shown. 24.9 25.6 27.3 Age 26.1 27 66.5 70 74.8 89.6 82.6 Time
Is there a linear relationship between the number of hits a World Series player gets and the number of times at bat the player has? 44 55 39 77 67 51 45 At Bats 67 25 30 23 16 19 20 20 23 Hits 18
The data show the number of hits and the number of at bats for 7 major league players in recent World Series.Find yʹ when x = 60.For each exercise, find the equation of the regression line and find the yʹ value for the specified x value. Remember that no regression should be
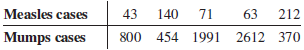
A researcher wishes to see if there is a relationship between the number of reported cases of measles and mumps for a recent 5-year period. Is there a linear relationship between the two variables? Measles cases 71 63 140 71 212 43 Mumps cases 800 454 1991 2612 370
The data show the number of cases of measles and mumps for a recent 5-year period.Given a year with 100 cases of measles, predict the expected number of cases of mumps for that year.For each exercise, find the equation of the regression line and find the yʹ value for the specified x
Years and contribution data are as follows:Find yʹ when x = 4 years.For each exercise, find the equation of the regression line and find the yʹ value for the specified x value. Remember that no regression should be done when r is not significant. 1 5 3 10 7 500 100 300 50 75
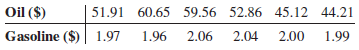
The average gasoline price per gallon (in cities) and the cost of a barrel of oil are shown below for a random selection of weeks in 2015.Find the cost of gasoline when oil is $60 a barrel.For each exercise, find the equation of the regression line and find the yʹ value for the
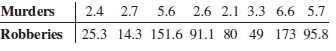
The number of murders and robberies per 100,000 population for a random selection of states are shown.Find yʹ when x = 4.5 murders.For each exercise, find the equation of the regression line and find the yʹ value for the specified x value. Remember that no regression should
A researcher wishes to see if there is a relationship between Internet use by high school students and isolation of the students. Internet use is measured by the number of hours per week that the students spend on the computer. Isolation is measured by having the students complete a questionnaire.
In today’s economy, everyone has become savings savvy. It is still believed, though, that a higher percentage of women than men clip coupons. A random survey of 180 female shoppers indicated that 132 clipped coupons while 56 out of 100 men did so. At α = 0.01, is there sufficient evidence that
An instructor who taught an online statistics course and a classroom course feels that the variance of the final exam scores for the students who took the online course is greater than the variance of the final exam scores of the students who took the classroom final exam. The following data were
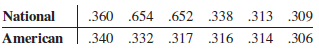
Random samples of batting averages from the leaders in both leagues prior to the All-Star break are shown. At the 0.05 level of significance, can a difference be concluded? 338 313 .309 .360 .654 .652 .340 .332 .317 .316 .314 .306 National American
Summer reading programs are very popular with children. At the Citizens Library, Team Ramona read an average of 23.2 books with a standard deviation of 6.1. There were 21 members on this team. Team Beezus read an average of 26.1 books with a standard deviation of 2.3. There were 23 members on this
A recent random survey of 100 individuals in Michigan found that 80 drove to work alone. A similar survey of 120 commuters in New York found that 62 drivers drove alone to work. Find the 95% confidence interval for the difference in proportions.
In a study of a group of women science majors who remained in their profession and a group who left their profession within a few months of graduation, the researchers collected the data shown here on a self-esteem questionnaire. At α = 0.05, can it be concluded that there is a difference in the
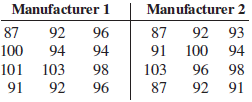
The sodium content of brands of cereal produced by two major manufacturers is shown. At α = 0.01, is there a significant difference in the variances? Manufacturer 1 Manufacturer 2 92 87 96 87 92 93 100 100 94 94 91 94 101 103 98 103 96 98 91 96 87 92 91 92
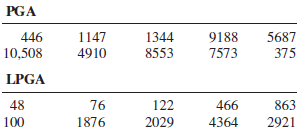
Two random samples of earnings of professional golfers were selected. One sample was taken from the Professional Golfers Association, and the other was taken from the Ladies Professional Golfers Association. At α = 0.05, is there a difference in the means? The data are in thousands of
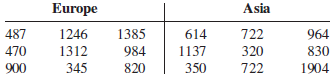
Is there a significant difference at α = 0.10 in the mean heights in feet of waterfalls in Europe and the ones in Asia? The data are shown. Asia 722 320 722 Europe 1385 984 487 470 1246 614 964 1312 345 1137 350 830 1904 900 820
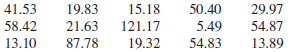
An investing club randomly selects 15 NYSE stocks for consideration, and the prices per share are listed here. Estimate the mean price in dollars of all stocks with 95% confidence.Assume that all variables are approximately normally distributed. 15.18 121.17 19.32 19.83 21.63 87.78 29.97 54.87
Estimate the variance in mean mathematics SAT scores by state, using the randomly selected scores listed below. Estimate with 99% confidence. Assume the variable is normally distributed. 565 502 209 499 490 211 572 543 469 550 515 500
For the same countries used in Exercise 22, the literacy rates (in percents) for both men and women are listed.Find yʹ when x = 80.For each exercise, find the equation of the regression line and find the yʹ value for the specified x value. Remember that no regression should
A random sample of nonindustrialized countries was selected, and the life expectancy in years is listed for both men and women.Find women€™s life expectancy in a country where men€™s life expectancy = 60 years.For each exercise, find the equation of the regression line and find
Here are the number of grams of water and the number of grams of carbohydrates for a random selection of raw foods (100 g each).Find yʹ for x = 75.For each exercise, find the equation of the regression line and find the yʹ value for the specified x value. Remember that no
The data show the average ages and lengths of service in months.If a service person is 26.8 years old, predict the time that the person will serve.For each exercise, find the equation of the regression line and find the yʹ value for the specified x value. Remember that no regression
What is the meaning of the adjusted R2? Why is it computed?
What test is used to test the significance of R?
Define the standard error of the estimate for regression. When can the standard error of the estimate be used to construct a prediction interval about a value yʹ?
What are the hypotheses used to test the significance of R?
Find the coefficients of determination and nondetermination and explain the meaning of each.r = 0.15
Define R2 and R2adj.
The average gasoline price per gallon (in cities) and the cost of a barrel of oil are shown for a random selection of weeks in 2015. Is there a linear relationship between the variables? Oil ($) Gasoline ($) 1.97 1 51.91 60.65 59.56 52.86 45.12 44.21 1.96 2.06 2.04 2.00 1.99
Find the coefficients of determination and nondetermination and explain the meaning of each.r = 0.12
What is the range of values R can assume?
The number of murders and robberies per 100,000 population for a random selection of states is shown. Is there a linear relationship between the variables? 2.4 2.7 5.6 2.6 2.1 3.3 6.6 5.7 Murders Robberies 25.3 14.3 151.6 91.1 80 49 173 95.8
Find the coefficients of determination and nondetermination and explain the meaning of each.r = 0.97
Explain the meaning of the multiple correlation coefficient R.
When two variables are correlated, can the researcher be sure that one variable causes the other? Why or why not?
Find the coefficients of determination and nondetermination and explain the meaning of each.r = 0.51
When the value of r is not significant, what value should be used to predict y?
What statistical test is used to test the significance of the correlation coefficient?
Find the coefficients of determination and nondetermination and explain the meaning of each.r = 0.44
How is the value of the correlation coefficient related to the accuracy of the predicted value for a specific value of x?
What is the name of the correlation coefficient used in this section?
Find the coefficients of determination and nondetermination and explain the meaning of each.r = 0.62
As the value of the correlation coefficient increases from 0 to 1, or decreases from 0 to −1, how do the points of the scatter plot fit the regression line?
What is the diagram of the independent and dependent variables called? Why is drawing this diagram important?
A researcher found that there are relationships between nursing home satisfaction and the age of the patient and his or her physical health. Nursing home satisfaction is measured on a scale of 1 to 10, with 10 being the highest satisfaction. Physical health is measured in a scale of 1 to 10 and is
What is the relationship between the sign of the correlation coefficient and the sign of the slope of the regression line?
Define the coefficient of nondetermination.
A researcher has determined that a significant relationship exists among an employee’s age x1, grade point average x2, and income y. The multiple regression equation is yʹ = −34,127 + 132x1 + 20,805x2. Predict the income of a person who is 32 years old and has a GPA of 3.4.
When all the points fall on the regression line, what is the value of the correlation coefficient?
What is meant when the relationship between the two variables is called positive? Negative?
How do the values of the individual correlation coefficients compare to the value of the multiple correlation coefficient?
What is the range of values for the correlation coefficient?
What are the assumptions for multiple regression?
What is the symbol for the slope? For the yʹ intercept?
A researcher feels that a pet store bases the cost of puppies on the cuteness of the animals. Eight puppies were rated on their cuteness. The ratings were from 1 to 6, with 6 being the highest rating. The ratings and the cost in dollars of the puppies are shown. Is there a significant relationship
What is the symbol for the sample correlation coefficient? The population correlation coefficient?
What is meant by the total variation? How is it computed?
Why would a researcher prefer to conduct a multiple regression study rather than separate regression studies using one independent variable and the dependent variable?
What is the general form for the regression line used in statistics?
NOAA keeps track of not only deaths from lightning each year but also the circumstances under which those deaths occur. Listed below are the number of deaths from lightning other than when standing under a tree and the number that occurred when the victim was under a tree, for a random selection of
Showing 3000 - 3100
of 4119
First
24
25
26
27
28
29
30
31
32
33
34
35
36
37
38
Last
Step by Step Answers