New Semester
Started
Get
50% OFF
Study Help!
--h --m --s
Claim Now
Question Answers
Textbooks
Find textbooks, questions and answers
Oops, something went wrong!
Change your search query and then try again
S
Books
FREE
Study Help
Expert Questions
Accounting
General Management
Mathematics
Finance
Organizational Behaviour
Law
Physics
Operating System
Management Leadership
Sociology
Programming
Marketing
Database
Computer Network
Economics
Textbooks Solutions
Accounting
Managerial Accounting
Management Leadership
Cost Accounting
Statistics
Business Law
Corporate Finance
Finance
Economics
Auditing
Tutors
Online Tutors
Find a Tutor
Hire a Tutor
Become a Tutor
AI Tutor
AI Study Planner
NEW
Sell Books
Search
Search
Sign In
Register
study help
mathematics
business statistics
Statistics For Business Decision Making And Analysis 3rd Edition Robert A. Stine, Dean Foster - Solutions
Match each definition on the left with a mathematical expression or term on the right.Avoids confounding in a two-sample comparison(a) t = -4.6(b) t = 1.3(c) µ1 €“ µ2(d) (e) n - 1(f) xÌ…1 €“ xÌ…2(g) Confounding(h) Randomization(i)
Match each definition on the left with a mathematical expression or term on the right.Test statistic indicating a statistically significant result if α = 0.05 and H0: µ1 €“ µ2 ‰¥ 0(a) t = -4.6(b) t = 1.3(c) µ1 €“ µ2(d) (e) n -
Match each definition on the left with a mathematical expression or term on the right.Test statistic indicating that a mean difference is not statistically significant if α = 0.05(a) t = -4.6(b) t = 1.3(c) µ1 €“ µ2(d) (e) n - 1(f) xÌ…1
Match each definition on the left with a mathematical expression or term on the right.The number of degrees of freedom in a paired t-test(a) t = -4.6(b) t = 1.3(c) µ1 €“ µ2(d) (e) n - 1(f) xÌ…1 €“ xÌ…2(g) Confounding(h) Randomization(i)
Match each definition on the left with a mathematical expression or term on the right.Multiple factors explain the difference between two samples(a) t = -4.6(b) t = 1.3(c) µ1 €“ µ2(d) (e) n - 1(f) xÌ…1 €“ xÌ…2(g) Confounding(h)
Mark each statement True or False. If you believe that a statement is false, briefly explain why you think it is false.If the standard two-sample t-test rejectsH0: µ1 – µ2 ≤ $100, then µ1 is more than $100 larger than µ2.
The value of r2 = 1 if data lie along a single line. Is it possible to fit a linear regression for which r2 is exactly equal to zero?
If the busy commuter in Exercise 21 decides to do more testing, how should she decide on the mode of transportation? Should she, for example, drive for a week and then take public transit for a week? What advice would you offer?Data from exercise 21A busy commuter is concerned about the time she
A business offers its employees free membership in a local fitness center. Rather than ask the employees if they like this benefit, the company developed a measure of productivity for each employee based on the number of claims handled. To assess the program, managers measured productivity of staff
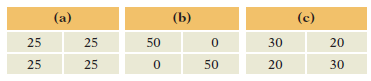
Without doing all the calculations, which of these 2 × 2 tables has the largest value of chi-squared? The smallest? (Each table has n = 100.) (a) (c) (b) 25 50 25 30 20 20 25 25 30 50 2.
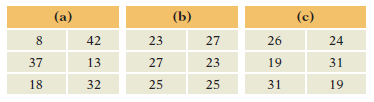
Without doing all the calculations, which of these 3 × 2 tables has the largest value of chi-squared? The smallest? (Each table has n = 150.) (b) (a) (c) 27 26 42 23 24 19 37 13 27 23 31 18 32 25 19 25 31
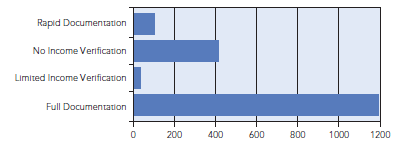
This is a bar chart of the number of defaults on mortgages in a collection of loans during the credit crisis that began in 2007€“2008. The bar chart identifies the type of income documentation used when the mortgage was obtained. Before we test whether loans with full documentation are
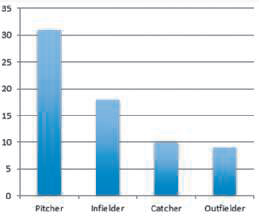
The following bar chart shows the number of major and minor league baseball players that were suspended for using steroids during the 2008 season. Can we use these counts to test whether the rate of steroid use is higher in some positions than others? 35 30 25 20 15 10 Infielder Catcher Outfielder
A stock market analyst recorded the number of stocks that went up or went down each day for 5 consecutive days, producing a contingency table with two rows (up or down) and five columns (Monday through Friday). Are these data suitable for applying the chi-squared test of independence?
A market research firm gathered a random sample of 150 customers. The firm randomly assigned 50 of these to rate the current product and assigned 50 each to rate new versions of the product. The firm then formed a contingency table of Version (old, new A, new B) versus Rating (like, dislike,
A bank makes loans to many types of customers. Some of these customers default on their loans. How could analysts at the bank use x2 to identify characteristics associated with customers who default on loans?
Inventory counts are seldom perfect because of misplaced items or misfiled sales reports. How could managers use x2 to decide whether expected inventory counts differ substantially from the actual counts?
Managers in the human resources department suspect that sick-day absentee rates are higher on some weekdays than others. What test can they use to investigate this claim?
A manager in the previous question thinks that the absentee rate is the same on Monday and Friday, but different from the rate on Tuesday through Thursday. What method should she use to test her suspicion?
Match each description on the left with its mathematical expression on the right.Symbol for the standard deviation of the residuals(a) r2(b) b0(c) y̅(d) b1(e) X(f) ŷ(g) b0 + b1(h) Y(i) y – ŷ(j) se
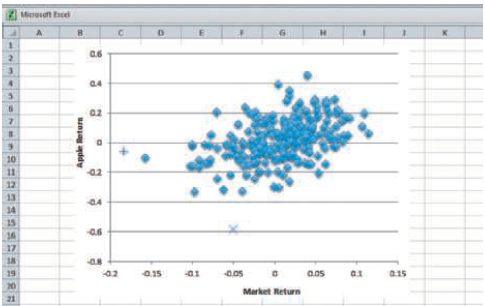
This data set tracks monthly performance of stock in Apple from January 1990 through December 2015, a total of 312 months. The data include returns on the entire stock market, Treasury Bills (short-term, 30-day loans to the government), and inflation. (The column Market Return is the return on a
After calculating the correlation, the analyst at the fitness center in Exercise 26 discovered that the scale used to weigh the athletes was off by 5 pounds; each athlete’s weight was measured as 5 pounds more than it actually was. How does this error affect the reported correlation?Data from
Cramer’s V (Chapter 5) measures dependence and varies from 0 to 1. The correlation also measures dependence but varies from - 1 to + 1. Why doesn’t it make sense for V also to take on negative values?
The visual test for association can be used to help distinguish whether the pattern in a plot is real or imagined. The original ought to stand out clearly. If you look at four plots, one the original and three with scrambled coordinates, and guess, what is the chance that you’ll guess the
The visual test for association requires you to compare several plots. One has the original data, and the others show the data with scrambled coordinates. Would it help in finding the original if these scatterplots include the marginal histograms along the edges of the plot?
Bold names shown with a question identify the data table for the problem. The title of each of the following exercises identifies the data table to be used for the problem.Drive Preferences These data give the percentage of new vehicles bought with four-wheel drive, state by state in the
Cars These data report characteristics of 413 types of cars sold in the United States in 2016. One column gives the official mileage (combined MPG), and another gives the rated horsepower.(a) Make a scatterplot of these two columns. Which variable makes the most sense to put on the x-axis, and
Find the matching item from the second column.Independent events(a) P(A and B) ≠ P(A) × P(B)(b) Ac(c) S(d) P(A or B) + P(A and B) = P(A) + P(B)(e) P(A or B) ≤ P(A) + P(B)(f) A and B(g) P(A and B) = 0(h) A or B(i) P(Ac) = 1 – P(A)(j) P(A and B) = P(A) × P(B)
Find the matching item from the second column.Disjoint events(a) P(A and B) ≠ P(A) × P(B)(b) Ac(c) S(d) P(A or B) + P(A and B) = P(A) + P(B)(e) P(A or B) ≤ P(A) + P(B)(f) A and B(g) P(A and B) = 0(h) A or B(i) P(Ac) = 1 – P(A)(j) P(A and B) = P(A) × P(B)
Find the matching item from the second column.Union(a) P(A and B) ≠ P(A) × P(B)(b) Ac(c) S(d) P(A or B) + P(A and B) = P(A) + P(B)(e) P(A or B) ≤ P(A) + P(B)(f ) A and B(g) P(A and B) = 0(h) A or B(i) P(Ac) = 1 – P(A)(j) P(A and B) = P(A) × P(B)
Find the matching item from the second column.Intersection(a) P(A and B) ≠ P(A) × P(B)(b) Ac(c) S(d) P(A or B) + P(A and B) = P(A) + P(B)(e) P(A or B) ≤ P(A) + P(B)(f) A and B(g) P(A and B) = 0(h) A or B(i) P(Ac) = 1 – P(A)(j) P(A and B) = P(A) × P(B)
Find the matching item from the second column.Complement of A(a) P(A and B) ≠ P(A) × P(B)(b) Ac(c) S(d) P(A or B) + P(A and B) = P(A) + P(B)(e) P(A or B) ≤ P(A) + P(B)(f ) A and B(g) P(A and B) = 0(h) A or B(i) P(Ac) = 1 – P(A)(j) P(A and B) = P(A) × P(B)
Find the matching item from the second column.Sample space(a) P(A and B) ≠ P(A) × P(B)(b) Ac(c) S(d) P(A or B) + P(A and B) = P(A) + P(B)(e) P(A or B) ≤ P(A) + P(B)(f ) A and B(g) P(A and B) = 0(h) A or B(i) P(Ac) = 1 – P(A)(j) P(A and B) = P(A) × P(B)
Find the matching item from the second column.Addition Rule(a) P(A and B) ≠ P(A) × P(B)(b) Ac(c) S(d) P(A or B) + P(A and B) = P(A) + P(B)(e) P(A or B) ≤ P(A) + P(B)(f ) A and B(g) P(A and B) = 0(h) A or B(i) P(Ac) = 1 – P(A)(j) P(A and B) = P(A) × P(B)
Find the matching item from the second column.Complement Rule(a) P(A and B) ≠ P(A) × P(B)(b) Ac(c) S(d) P(A or B) + P(A and B) = P(A) + P(B)(e) P(A or B) ≤ P(A) + P(B)(f ) A and B(g) P(A and B) = 0(h) A or B(i) P(Ac) = 1 – P(A)(j) P(A and B) = P(A) × P(B)
Find the matching item from the second column.Boole’s inequality(a) P(A and B) ≠ P(A) × P(B)(b) Ac(c) S(d) P(A or B) + P(A and B) = P(A) + P(B)(e) P(A or B) ≤ P(A) + P(B)(f ) A and B(g) P(A and B) = 0(h) A or B(i) P(Ac) = 1 – P(A)(j) P(A and B) = P(A) × P(B)
Find the matching item from the second column.Dependent events(a) P(A and B) ≠ P(A) × P(B)(b) Ac(c) S(d) P(A or B) + P(A and B) = P(A) + P(B)(e) P(A or B) ≤ P(A) + P(B)(f ) A and B(g) P(A and B) = 0(h) A or B(i) P(Ac) = 1 – P(A)(j) P(A and B) = P(A) × P(B)
A market research assistant watches five customers as they leave a store. He records whether the customer is carrying a store bag that indicates any customer made a purchase. He writes down a yes or a no for each. The sample space consists of all possible sequences of yes or no for these five
A company seeks to hire engineering graduates who also speak a foreign language. Should you describe the combination of talents as an intersection or a union?
Customers visit a store with several departments. A randomly chosen customer goes to the sporting goods department. After wandering for a bit, she buys a pair of running shoes. This event is most naturally viewed as a union or an intersection?
The combination of which two of the following characteristics would produce the sort of data needed in order for the Law of Large Numbers to guarantee that a proportion converges to a probability?(a) Independent trials.(b) Constant chance for the event to occur on each trial.(c) The probability of
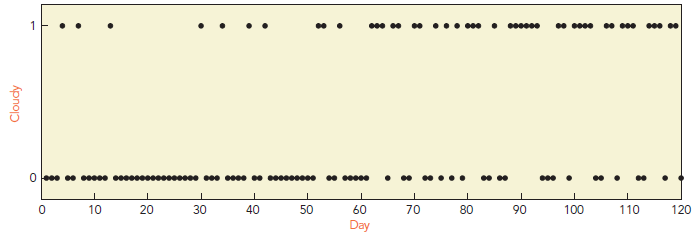
The manager of a beachside vacation resort tracks the local weather. Each day, she records a 1 if the day is cloudy. She records a 0 if the day is sunny. The following plot shows a sequence from her data. Would these data be well suited for estimating the probability of sunny weather? 60 120 10 20
A market analyst on TV makes predictions such as saying that there is a 25% chance that the market will move up the next week. What do you think is the meaning of such a phrase?
A basketball player who has missed his last seven consecutive shots then makes the game-winning shot. When speaking to reporters afterward, the player says he was very confident that last time because he knew he was “due to make a basket.” Comment on his statement.
Intel and AMD compete to put their processing chips into personal computers. In 2014, Intel claimed 93% of the laptop market and 83% of the market for desktop computers. In 2010, Intel commanded 86% of the laptop market and 72% of the desktop market.(a) What is the probability that someone who
Match the item from the first column to the best item from the second.Probability of B given A(a) P(A and B) = P(A) × P(B|A)(b) P(A|B) = P(B|A) × P(A) >P(B)(c) P(A) = P(A|B)(d) 1 - P(B|A)(e) P(A) ≠ P(A|B)(f) P(A and B) /P(A)
Match the item from the first column to the best item from the second.Probability of Bc given A(a) P(A and B) = P(A) × P(B|A)(b) P(A|B) = P(B|A) × P(A) >P(B)(c) P(A) = P(A|B)(d) 1 - P(B|A)(e) P(A) ≠ P(A|B)(f) P(A and B) /P(A)
Match the item from the first column to the best item from the second.Identifies independent events(a) P(A and B) = P(A) × P(B|A)(b) P(A|B) = P(B|A) × P(A) >P(B)(c) P(A) = P(A|B)(d) 1 - P(B|A)(e) P(A) ≠ P(A|B)(f) P(A and B) /P(A)
Match the item from the first column to the best item from the second.Identifies dependent events(a) P(A and B) = P(A) × P(B|A)(b) P(A|B) = P(B|A) × P(A) >P(B)(c) P(A) = P(A|B)(d) 1 - P(B|A)(e) P(A) ≠ P(A|B)(f) P(A and B) /P(A)
Match the item from the first column to the best item from the second.Bayes’ Rule(a) P(A and B) = P(A) × P(B|A)(b) P(A|B) = P(B|A) × P(A) >P(B)(c) P(A) = P(A|B)(d) 1 - P(B|A)(e) P(A) ≠ P(A|B)(f) P(A and B) /P(A)
Match the item from the first column to the best item from the second.Multiplication Rule(a) P(A and B) = P(A) × P(B|A)(b) P(A|B) = P(B|A) × P(A) >P(B)(c) P(A) = P(A|B)(d) 1 - P(B|A)(e) P(A) ≠ P(A|B)(f) P(A and B) /P(A)
Describe the outcomes of these random processes as either independent or dependent. Briefly explain your choice.Recording whether the manufacturer is located in Europe, Asia, or North America for a sequence of cars observed on an interstate highway.
Describe the outcomes of these random processes as either independent or dependent. Briefly explain your choice.Recording the type of accident reported to an auto insurance firm in the weeks following a major ice storm in a region where the firm sells insurance
Describe the outcomes of these random processes as either independent or dependent. Briefly explain your choice.Tracking the number of visits to a major Web site day by day
Describe the outcomes of these random processes as either independent or dependent. Briefly explain your choice.Tracking the daily price of a share of stock in Microsoft
Describe the outcomes of these random processes as either independent or dependent. Briefly explain your choice.Recording the amount purchased by individual customers entering a large retail store (with a zero for those who do not make a purchase)
Describe the outcomes of these random processes as either independent or dependent. Briefly explain your choice.Counting the number of gallons of gasoline put into cars arriving at a service station on the turnpike
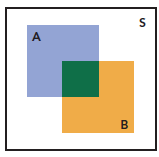
In the following Venn diagrams, we have drawn the sample space S as a square, and you may assume that the area of the regions is proportional to the probability. Describe the events A and B as either independent or dependent, with a short explanation of your reasoning. The areas of A and B are both
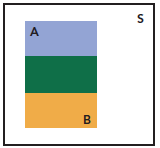
In the following Venn diagrams, we have drawn the sample space S as a square, and you may assume that the area of the regions is proportional to the probability. Describe the events A and B as either independent or dependent, with a short explanation of your reasoning. The areas of A and B are both
A pharmaceutical company has developed a diagnostic test for a rare disease. The test has sensitivity 0.99 (the probability of testing positive among people with the disease) and specificity 0.995 (the probability of testing negative among people who do not have the disease). What other probability
Seventy percent of customers at the snack counter of a movie theater buy drinks. Among those who buy drinks, 30% also purchase popcorn. What’s the probability that a customer at the counter buys a drink and popcorn? Theaters use this type of calculation to decide which products should be bundled
Match the descriptive phrases to the symbols on the right. In these exercises, X denotes a random variable.Expected value of X.(a) E(X – µ)(b) 10X(c) (X – 0.04)/σ(d) X + 10(e) E(X – µ)2(f) √Var(X)(g) µ(h) p(x)
Match the descriptive phrases to the symbols on the right. In these exercises, X denotes a random variable.Variance of X(a) E(X – µ)(b) 10X(c) (X – 0.04)/σ(d) X + 10(e) E(X – µ)2(f) √Var(X)(g) µ(h) p(x)
Match the descriptive phrases to the symbols on the right. In these exercises, X denotes a random variable.Standard deviation of X(a) E(X – µ)(b) 10X(c) (X – 0.04)/σ(d) X + 10(e) E(X – µ)2(f) √Var(X)(g) µ(h) p(x)
Match the descriptive phrases to the symbols on the right. In these exercises, X denotes a random variable.Shorthand notation for P(X = x)(a) E(X – µ)(b) 10X(c) (X – 0.04)/σ(d) X + 10(e) E(X – µ)2(f) √Var(X)(g) µ(h) p(x)
Match the descriptive phrases to the symbols on the right. In these exercises, X denotes a random variable.Has 10 times the standard deviation of X(a) E(X – µ)(b) 10X(c) (X – 0.04)/σ(d) X + 10(e) E(X – µ)2(f) √Var(X)(g) µ(h) p(x)
Match the descriptive phrases to the symbols on the right. In these exercises, X denotes a random variable.Is always equal to zero(a) E(X – µ)(b) 10X(c) (X – 0.04)/σ(d) X + 10(e) E(X – µ)2(f) √Var(X)(g) µ(h) p(x)
Match the descriptive phrases to the symbols on the right. In these exercises, X denotes a random variable.Increases the mean of X by 10(a) E(X – µ)(b) 10X(c) (X – 0.04)/σ(d) X + 10(e) E(X – µ)2(f) √Var(X)(g) µ(h) p(x)
Match the descriptive phrases to the symbols on the right. In these exercises, X denotes a random variable.Has standard deviation 1(a) E(X – µ)(b) 10X(c) (X – 0.04)/σ(d) X + 10(e) E(X – µ)2(f) √Var(X)(g) µ(h) p(x)
If investors want portfolios with small risk (variance), should they look for investments that have positive covariance, have negative covariance, or are uncorrelated?
Does a portfolio formed from the mix of three investments have more risk (variance) than a portfolio formed from two?
If the covariance between the prices of two investments is 100,000, must the correlation between the two be close to 1?
If the correlation between the price of Microsoft stock and the price of an Xbox is 1, could you predict the price of an Xbox from knowing the price of Microsoft stock? How well?
Would it be reasonable to model the sequence of daily sales of a downtown restaurant as a sequence of iid random variables?
If percentage changes in the value of a stock are iid with mean 0, then how should we predict the change tomorrow if the change today was a 3% increase? How would the prediction change if the value today decreased by 2%?
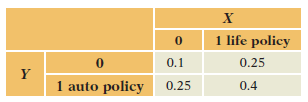
An insurance agent sells two types of policies to clients, both life insurance and auto insurance. The following joint distribution summarizes the number of life insurance policies sold to an individual (X) and the number of auto policies (Y).(a) Find the expected value and variance of the number
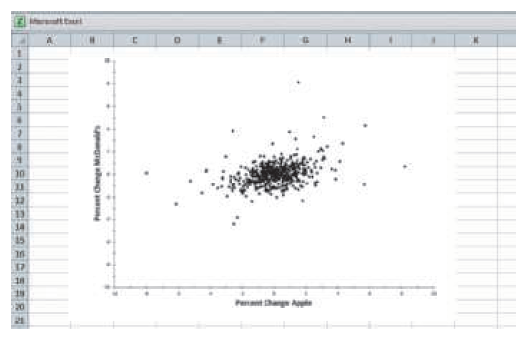
The relevance of variance and covariance developed for random variables in this chapter carries over to the analysis of returns on real stocks. The file €œdaily_stocks€ includes the daily percentage changes in the value of stock in Apple and stock in McDonald€™s in
One hundred customers visit a Web site during a 15-minute period. The number of these customers who make a purchase is modeled as a binomial random variable with n = 100 and p = 0.05. What model should be used for the number of customers who do not make a purchase?
A car dealer makes $1,000 on each vehicle sold. Assume 30% of customers entering the dealership make a purchase. If 50 customers enter the dealership in a day, can the binomial model be used to estimate the probability that the dealership makes more than $20,000 on this day?
If the office visits of a detail rep are Bernoulli trials, then which of these two sequences of six office visits is more likely (S stands for success and the rep sees the doctor, and F for failure): SSSFFF or SFFSFS?
Four customers in a taste test sample two types of beverage (called A and B here) and are asked which is preferred. If customers cannot tell the two beverages apart, are we more likely to see the response AABB or AAAA?
A software project requires 10 components to be completed within the next three months. Each component is produced by a programming team that operates independently of the other teams. Each team has a 50% chance of finishing on time. Is there a 50% chance that the project will be finished on time?
A venture capitalist invests in startup technology companies. She expects about 10% of these companies to be successful.(a) What is the probability that she will have to invest in more than four companies before she comes upon one that is successful? Be sure to state any assumptions you make.(b)
Match each statement on the left to the notation on the right. X denotes a normally distributed random variable: X ~ N(µ, σ2). A googol, the namesake of Google, is 10100. The random variable Z denotes a standard normal random variable, Z ~ N(0, 1).Mean of X(a) 1/2(b) P(Z < 1)(c) 0.05(d) 2/3(e)
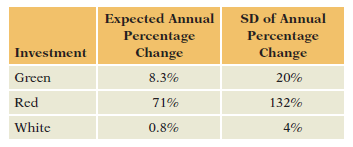
1. If you repeat the dice game several times, or perhaps in a class, you might find that Red occasionally comes out the winner. Seeing that all of the others lose with Red, how might it be that some team comes out ahead with Red?2. Is Pink the best mix of Red and White? There€™s no rule
Match each statement on the left to the notation on the right. X denotes a normally distributed random variable: X ~ N(µ, σ2). A googol, the namesake of Google, is 10100. The random variable Z denotes a standard normal random variable, Z ~ N(0, 1).Variance of X(a) 1/2(b) P(Z < 1)(c) 0.05(d)
1. M&M’s weigh 0.86 grams on average with SD = 0.04 grams, so the coefficient of variation is 0.04>0.86 < 0.047. Suppose that we decide to label packages by count rather than weight. The system adds candy to a package until the weight of the package exceeds a threshold. How large would
Match each statement on the left to the notation on the right. X denotes a normally distributed random variable: X ~ N(µ, σ2). A googol, the namesake of Google, is 10100. The random variable Z denotes a standard normal random variable, Z ~ N(0, 1).Standard deviation of Z(a) 1/2(b) P(Z < 1)(c)
How large can a single observation from a normal distribution be?
If used to model data that have limits (such as the age of a customer using a credit card or amount spent by a customer), what problem does a normal model have?
Mosquitos carry numerous tropical diseases. A public health agency wants to identify the extent of mosquito breeding areas (e.g., standing water) within its community. Comment on the following approaches to determining the extent of breeding areas.(a) Send letters to residents asking them to report
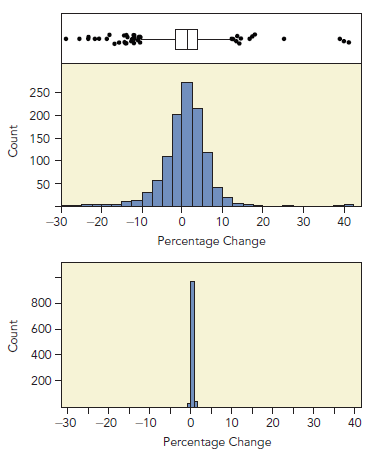
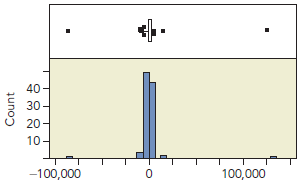
Would the skewness K3and kurtosis K4of the 100 observations shown in the following histogram both be close to zero, or can you see that one or the other would differ from zero? You don€™t need to give a precise value; just indicate the direction away from zero. 40- 30 20 10- -100,000
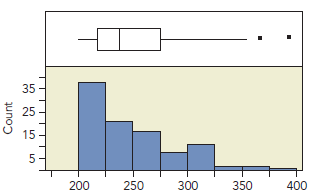
Would the skewness K3and kurtosis K4of the 100 observations shown in the following histogram both be close to zero, or can you see that one or the other would differ from zero? You don€™t need to give a precise value; just indicate the direction away from zero. 35 25 15 250 200 300 350
Robots gather the items for orders shipped by Amazon from bins located in vast warehouses. Computers know what should be in every bin, but sometimes items are missing from a bin. Evaluate the following strategies for learning the prevalence of missing items from storage bins.(a) Close the warehouse
An employer replaced its paycheck system with a paperless system that directly deposits payments into employee checking or savings accounts. To verify that proper deductions have been made, employees can check their pay stubs online. To investigate whether employees prefer the new system, the
Mark each statement True or False. If you believe that a statement is false, briefly explain why you think it is false.Larger surveys convey a more accurate impression of the population than smaller surveys.
Mark each statement True or False. If you believe that a statement is false, briefly explain why you think it is false.The wording of questions has been shown to have no influence on the responses in surveys.
Mark each statement True or False. If you believe that a statement is false, briefly explain why you think it is false.Sampling variation occurs when respondents change their answers to questions during an interview or change their answers when offered a repeated question.
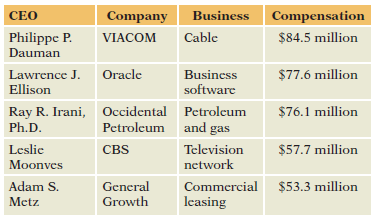
1. If someone tells you the mean and SD of a variable, what had you better find out before trying to use the Empirical Rule?2. Another approach to working with skewed data is to remove the extreme values and work with those that remain. Does this approach work? Remove the top 5 or 10 compensations
If the correlation between number of customers and sales in dollars in retail stores is r = 0.6, then what would be the correlation if the sales were measured in thousands of dollars? In euros? (1 euro is worth about 1.2 to 1.5 dollars.)
Showing 2300 - 2400
of 4119
First
17
18
19
20
21
22
23
24
25
26
27
28
29
30
31
Last
Step by Step Answers