New Semester
Started
Get
50% OFF
Study Help!
--h --m --s
Claim Now
Question Answers
Textbooks
Find textbooks, questions and answers
Oops, something went wrong!
Change your search query and then try again
S
Books
FREE
Study Help
Expert Questions
Accounting
General Management
Mathematics
Finance
Organizational Behaviour
Law
Physics
Operating System
Management Leadership
Sociology
Programming
Marketing
Database
Computer Network
Economics
Textbooks Solutions
Accounting
Managerial Accounting
Management Leadership
Cost Accounting
Statistics
Business Law
Corporate Finance
Finance
Economics
Auditing
Tutors
Online Tutors
Find a Tutor
Hire a Tutor
Become a Tutor
AI Tutor
AI Study Planner
NEW
Sell Books
Search
Search
Sign In
Register
study help
mathematics
business statistics
Business Statistics In Practice Using Data Modeling And Analytics 8th Edition Bruce L Bowerman, Richard T O'Connell, Emilly S. Murphree - Solutions
A local newspaper randomly selects 20 patrons of the Springwood Restaurant on a given Saturday night and has each patron rate the quality of his or her meal as 5 (excellent), 4 (good), 3 (average), 2 (poor), or 1 (unsatisfactory). When the results are summarized, it is found that there are 16
Explain the circumstances in which we use the Wilcoxon rank sum test.
Identify the parametric test corresponding to the Wilcoxon rank sum test. What assumption is needed for the validity of this parametric test (and not needed for the Wilcoxon rank sum test)?
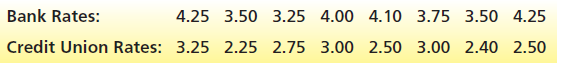
A loan officer at a bank wishes to compare the new car loan rates charged at banks in Ohio with the new car loan rates of Ohio credit unions. Two independent random samples of bank rates and credit union rates in Ohio are obtained with the following results (all rates are fixed rates):Because both
Explain the circumstances in which we use the Wilcoxon signed ranks test.
Identify the parametric test corresponding to the Wilcoxon signed ranks test. What assumption is needed for the validity of the parametric test (and not needed for the Wilcoxon signed ranks test)?
Explain the circumstances in which we use the Kruskal–Wallis H test.
Identify the parametric test corresponding to the Kruskal–Wallis H test.
What are the assumptions needed for the validity of the parametric test identified in Exercise 17.21 that are not needed for the Kruskal–Wallis H test?Exercise 17.21Identify the parametric test corresponding to the Kruskal–Wallis H test.
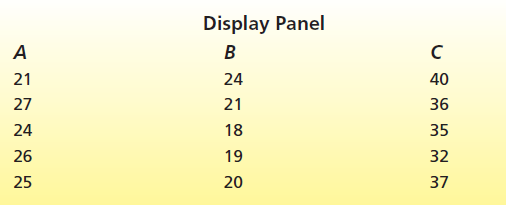
Use the Kruskal€“Wallis H test to compare display panels A, B, and C using the data in Table 17.8. Use α = .05.Table 17.8Use the given independent samples to perform the Kruskal€“Wallis H test of the null hypothesis H0 that the corresponding populations are
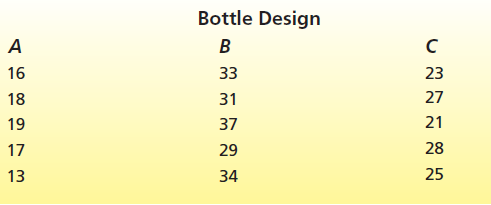
Use the Kruskal€“Wallis H test to compare bottle designs A, B, and C using the data in Table 17.9. Use α = .01.Table 17.Use the given independent samples to perform the Kruskal€“Wallis H test of the null hypothesis H0 that the corresponding populations are
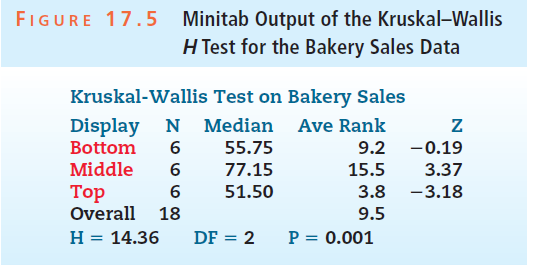
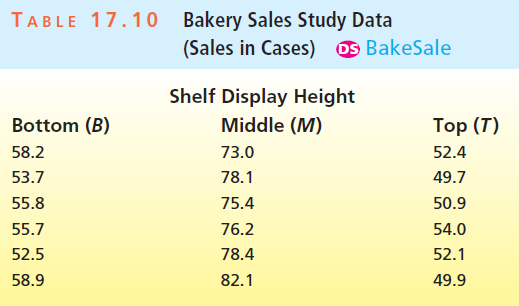
Use the Kruskal€“Wallis H test and the Minitab output in Figure 17.5 to compare the bottom (B), middle (M), and top (T) display heights using the data in Table 17.10. Use α = .05. Then, repeat the analysis if the first sales value for the middle display height is found to be
Explain the circumstances in which we use Spearman’s rank correlation coefficient.
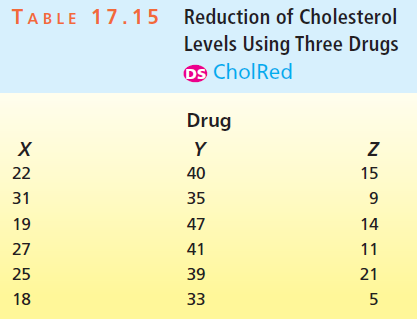
A drug company wishes to compare the effects of three different drugs (X, Y, and Z) that are being developed to reduce cholesterol levels. Each drug is administered to six patients at the recommended dosage for six months. At the end of this period the reduction in cholesterol level is recorded for
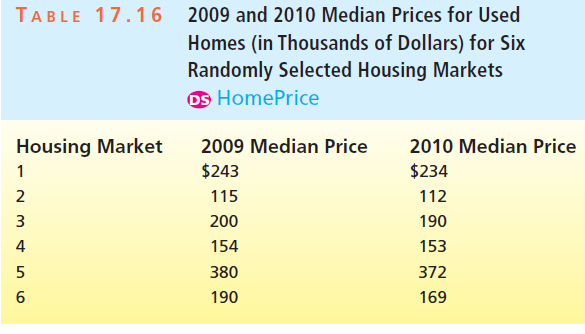
Table 17.16 gives the median 2009 and 2010 prices for used homes (in thousands of dollars) for six randomly selected U.S. housing markets. Use a nonparametric test to attempt to show that housing prices decreased from 2009 to 2010. Use α = .05 and explain your conclusion. 2009 and
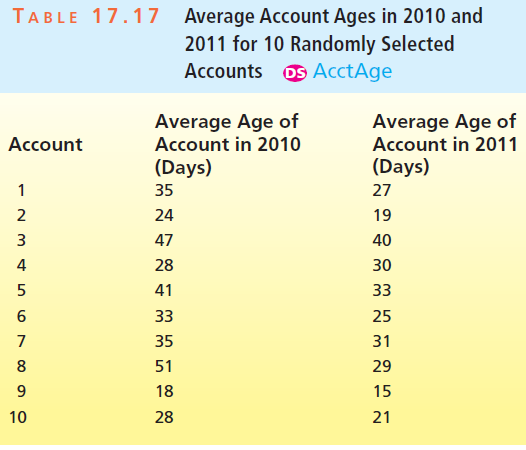
During 2011 a company implemented a number of policies aimed at reducing the ages of its customers€™ accounts. In order to assess the effectiveness of these measures, the company randomly selects 10 customer accounts. The average age of each account is determined for each of the years
Explain the differences between(a) Decision making under certainty,(b) Decision making under uncertainty,(c) Decision making under risk.
Explain how to use the(a) Maximin criterion,(b) Maximax criterion,(c) Expected monetary value criterion.
Explain how to find the expected value of perfect information.
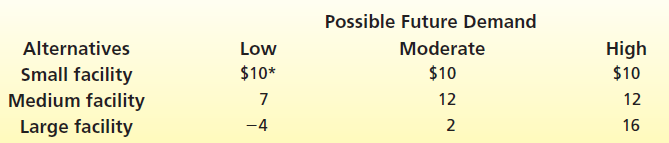
Find the best alternative (and the resulting payoff) in the given payoff table if it is known with certainty that demand will bea. Low.b Medium.c High.The example involves a capacity-planning problem in which a company must choose to build a small, medium, or large production facility. The payoff
Given the payoff table, find the alternative that would be chosen using the maximin criterion.The example involves a capacity-planning problem in which a company must choose to build a small, medium, or large production facility. The payoff obtained will depend on whether future demand is low,
Given the payoff table, find the alternative that would be chosen using the maximax criterion.The example involves a capacity-planning problem in which a company must choose to build a small, medium, or large production facility. The payoff obtained will depend on whether future demand is low,
Suppose that the company assigns prior probabilities of .3, .5, and .2 to low, moderate, and high demands, respectively.a. Find the expected monetary value for each alternative (small, medium, and large).b. What is the best alternative if we use the expected monetary value criterion?The example
Construct a decision tree for the information in the payoff table assuming that the prior probabilities of low, moderate, and high demands are, respectively, .3, .5, and .2.The example involves a capacity-planning problem in which a company must choose to build a small, medium, or large production
For the information in the payoff table finda. The expected payoff under certainty.b. The expected value of perfect information, EVPI.The example involves a capacity-planning problem in which a company must choose to build a small, medium, or large production facility. The payoff obtained will
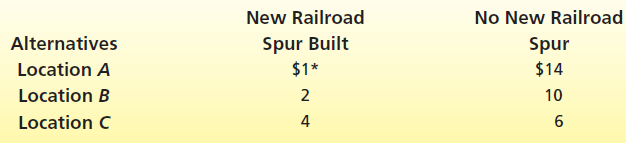
A firm wishes to choose the location for a new factory. Profits obtained will depend on whether a new railroad spur is constructed to serve the town in which the new factory will be located. The second payoff table at the bottom of the page summarizes the relevant information. Determine the
Construct a decision tree for the information given in Exercises 18.10 and 18.11.Exercise 18.10 and Exercise 18.11 No New Railroad Spur New Railroad Alternatives Spur Built $1* $14 Location A Location B 2 10 Location C
Refer to the information given in Exercise 18.10. Using the probabilities of .60 for a new railroad spur and .40 for no new railroad spur.a. Compute the expected monetary value for each location.b. Find the location that should be selected using the expected monetary value criterion.c. Compute the
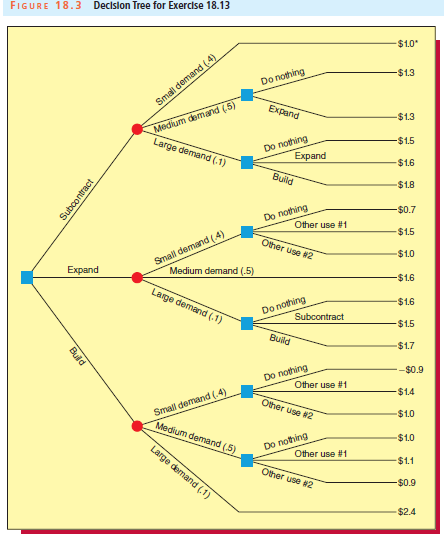
Figure 18.3 gives a decision tree presented in the book Production/Operations Management by William J. Stevenson. Use this tree diagram to do the following:a. Find the expected monetary value for each of the alternatives (subcontract, expand, and build).b. Determine the alternative that should be
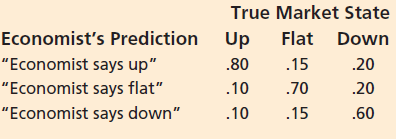
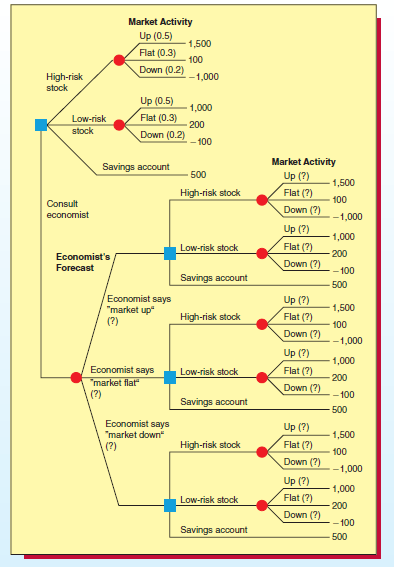
Identify and list each of the following for the investor€™s decision problem:a. The investor€™s alternative actions.b. The states of nature.c. The possible results of sampling (that is, of information gathering).An Introduction to Decision Analysis, 2nd ed., Robert T. Clemen
Carry out a prior analysis of the investor€™s decision problem. That is, determine the investment choice that should be made and find the expected monetary value of that choice assuming that the investor does notconsult the economist about future stock market behavior.An Introduction to
Carry out a posterior analysis of the investor€™s decision problem. That is, determine the investment choice that should be made and find the expected monetary value of that choice assuming:a. The economist says €œmarket up.€b. The economist says €œmarket
Carry out a preposterior analysis of the investor€™s decision problem by finding:a. The expected monetary value associated with consulting the economist; that is, find the EPS.b. The expected monetary value associated with not consulting the economist; that is, find the EPNS.c. The
Identify and list each of the following for the control device situation:a. The firm’s alternative actions.b. The states of nature.c. The possible results of sampling (that is, of information gathering).A firm designs and manufactures automatic electronic control devices that are installed at
Construct a decision tree for a prior analysis of the control device situation. Then determine whether the engineers should be sent, assuming that the piece of test equipment is not employed to check the device’s alignment. Also find the expected monetary value associated with the best
Set up probability revision tables to:a. Find the probability that the test equipment “reads in,” and find the posterior probabilities of in alignment and out of alignment given that the test equipment “reads in.”b. Find the probability that the test equipment “reads out,” and find the
Carry out a posterior analysis of the control device problem. That is, decide whether the engineers should be sent, and find the expected monetary value associated with either sending or not sending (depending on which is best) the engineers assuming:a. The test equipment “reads in.”b. The test
What is a utility?
Carry out a preposterior analysis of the control device problem by finding:a. The expected monetary value associated with using the test equipment; that is, find the EPS.b. The expected monetary value associated with not using the test equipment; that is, find the EPNS.c. The expected value of
Suppose that a decision maker has the opportunity to invest in an oil well drilling operation that has a .3 chance of yielding a profit of $1,000,000, a .4 chance of yielding a profit of $400,000, and a .3 chance of yielding a profit of -$100,000. Also, suppose that the decision maker’s utilities
Consider Exercise 18.31. Find the expected utility of the oil well drilling operation. Find the expected utility of not investing. What should the decision maker do if he/she wishes to maximize expected utility?Exercise 18.31Suppose that a decision maker has the opportunity to invest in an oil well
Write out the payoff table for the investor€™s decision problem.An Introduction to Decision Analysis, 2nd ed., Robert T. Clemen presents an example in which an investor wishes to choose between investing money in (1) a high-risk stock, (2) a low-risk stock, or (3) a savings account. The
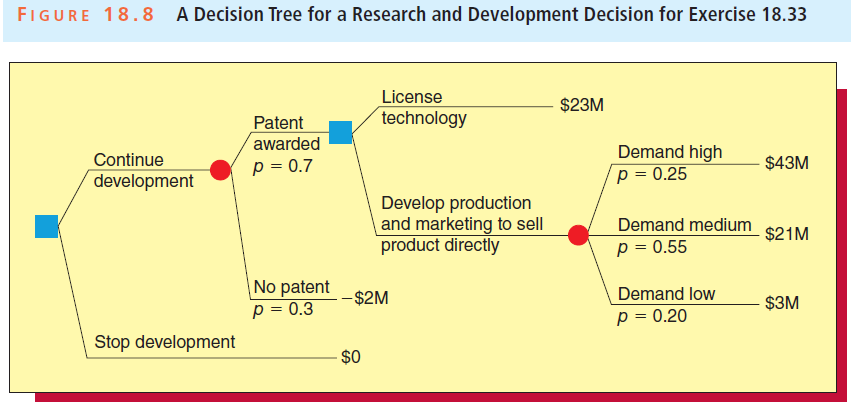
In the book Making Hard Decisions: An Introduction to Decision Analysis, Robert T. Clemen presents a decision tree for a research and development decision (note that payoffs are given in millions of dollars, which is denoted by M). Based on this decision tree (shown in Figure 18.8), answer the
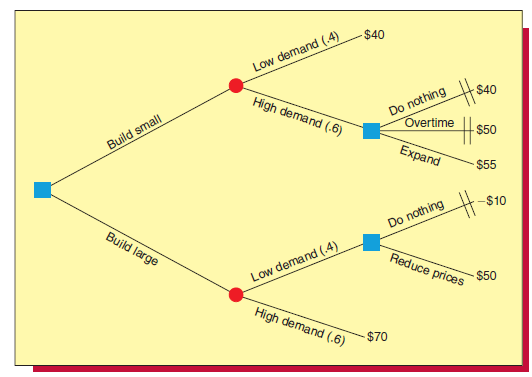
In the book Production/Operations Management, William J. Stevenson presents a decision tree concerning a firm€™s decision about the size of a production facility. This decision tree is given in Figure 18.9 (payoffs are given in millions of dollars). Use the decision tree to determine
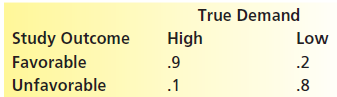
Consider the decision tree in Figure 18.9 and the situation described in Exercise 18.34. Suppose that a marketing research study can be done to obtain more information about whether demand will be high or low. The marketing research study will result in one of two outcomes:
Discuss the purpose of differencing.
Explain how we use the SAC and SPAC.
Use Excel, MegaStat, or Minitab to perform a regression analysis of the Bonner Frozen Foods sales volume data in Table 14.5 on page 599 by using the model y = β0+ β1x1+ β2x2+ β3x1x2+ ε.Table 14.5a Determine if the interaction term x1x2 is
How do we model the interaction between two independent variables?
When does a scatter plot suggest the use of the quadratic regression model?
What is a qualitative independent variable?
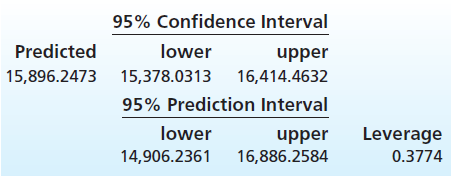
Consider a hospital for which XRay = 56,194, BedDays = 14,077.88, and LengthStay = 6.89. A 95 percent prediction interval for the labor hours corresponding to this combination of values of the independent variables is given in the following MegaStat output:Find and report the prediction interval on
Use the Bonner Frozen Foods sales volume data in Table 14.5 on page 599 and the model y = β0 + β1x1 + β2x2 + ε to find(1) A point estimate of and a 95 percent confidence interval for the mean sales volume in all sales regions when $2,000 is spent on radio and television advertising and $5,000
What is the purpose of the overall F test?
What is estimated by the mean square error, and what is estimated by the standard error?
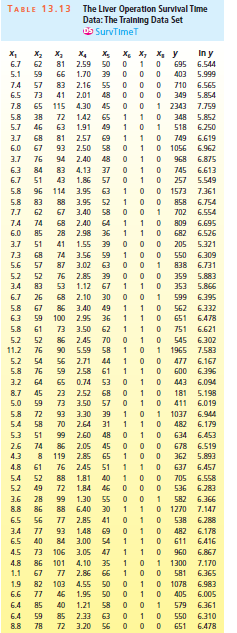
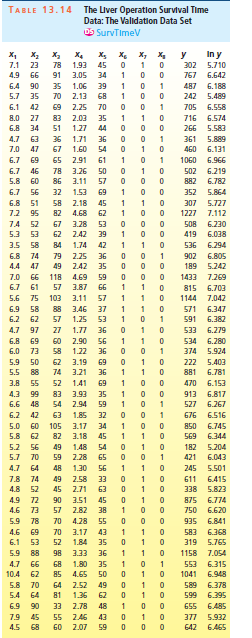
When developing a regression model to predict a dependent variable y, it is best, if there are enough data, to €œbuild€ the model using one data set (called the training data set) and then €œvalidate€ the model by using it to analyze a different data set
How do we check the normality assumption?
Explain what is meant by the population correlation coefficient ρ.
Use the real estate sales price data in Table 13.7 to find(1) A point estimate of and a 95 percent confidence interval for the mean sales price of all houses having a size of 20 (that is, 2,000 square feet).(2) A point prediction of and a 95 percent prediction interval for the sales price of a
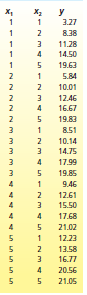
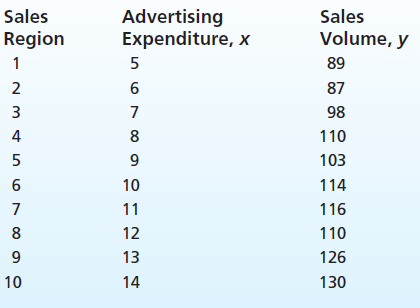
Use the sales volume data in Figure 3.22(a) to find (1) A point estimate of and a 95 percent confidence interval for the mean sales volume in all sales regions when advertising expenditure is 10 (that is, $100,000).(2) A point prediction of and a 95 percent prediction interval for the sales
What does the simple coefficient of determination measure?
What is estimated by the mean square error, and what is estimated by the standard error?
What is the purpose behind summarizing data in the form of a two-way contingency table?
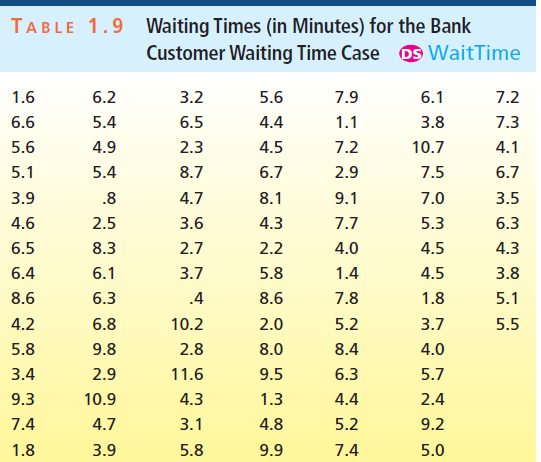
Consider the sample of 100 waiting times given in Table 1.9. Use these data to carry out a chi-square goodness-of-fit test to determine whether the population of all waiting times is normally distributed. Use α = .10, and note that x̅ 5.46 and s = 2.475 for the 100
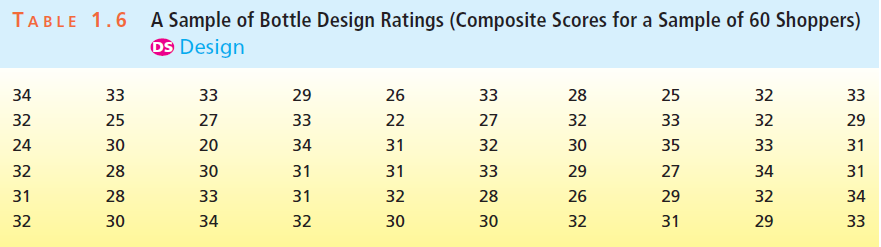
Consider the sample of 60 bottle design ratings given in Table 1.6. Use these data to carry out a chi-square goodness-of-fit test to determine whether the population of all bottle design ratings is normally distributed. Use α = .05, and note that x̅ = 30.35 and s = 3.1073
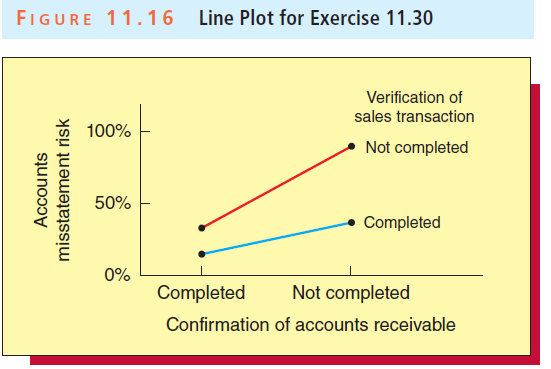
In an article in the Accounting Review, Brown and Solomon study the effects of two factors€”confirmation of accounts receivable and verification of sales transactions€”on account misstatement risk by auditors. Both factors had two levels€”completed or not
What is a treatment in the context of a two-factor factorial experiment?
How can we test to determine if the blocks we have chosen are reasonable?
In your own words, explain why we sometimes employ the randomized block design.
Explain the assumptions that must be satisfied in order to validly use the one-way ANOVA formulas.
Suppose a company wishes to compare the hourly output of its employees before and after vacations. Explain how you would collect data for a paired difference experiment to make this comparison.
Why is a paired difference experiment sometimes more informative than an independent samples experiment? Give an example of a situation in which a paired difference experiment might be advantageous.
Explain how a paired difference experiment differs from an independent samples experiment in terms of how the data for these experiments are collected.
What assumption must hold to make statistical inferences about a population variance?
What condition must be satisfied in order for the methods of this section to be appropriate?
If we wish to test a hypothesis to provide evidence supporting the claim that fewer than 5 percent of the units produced by a process are defective, formulate the null and alternative hypotheses.
Explain what a p-value is, and explain how it is used to test a hypothesis.
Define a population total. Give an example of a population total that a business might estimate.
Discuss when it is appropriate to use the t-based confidence interval for μ.
For a fixed level of confidence, what happens to a confidence interval for μ when we increase the sample size?
For a fixed sample size, what happens to a confidence interval for μ when we increase the level of confidence?
Explain the meaning of the term “95 percent confidence.”
Describe the effect of increasing the sample size on the population of all possible sample proportions.
If the sample size n is large, the sampling distribution of p̂ is approximately a normal distribution. What condition must be satisfied to guarantee that n is large enough to say that p̂ is approximately normally distributed?
The sampling distribution of p̂ is the probability distribution of a population. Describe this population.
What does the Central Limit Theorem tell us about the sampling distribution of the sample mean?
The sampling distribution of the sample mean x̅ is the probability distribution of a population. Describe this population.
If a normal probability plot has the appearance of a straight line, what should we conclude?
Explain the relationship between the Poisson and exponential distributions.
Under what condition may we use the normal approximation to the binomial distribution?
Explain why it might be convenient to approximate binomial probabilities by using areas under an appropriate normal curve.
Explain how to compute the z value corresponding to a value of a normally distributed random variable. What does the z value tell us about the value of the random variable?
What two properties must be satisfied by a continuous probability distribution (or probability curve)?
How do we use the continuous probability distribution (or probability curve) of a random variable x to find probabilities? Explain.
A discrete probability distribution assigns probabilities to individual values. To what are probabilities assigned by a continuous probability distribution?
Explain the meaning of a positive covariance.
Explain the meaning of a negative covariance.
In the context of the hypergeometric distribution, explain the meanings of N, r, and n.
Explain the logic behind the rare event approach to making statistical inferences.
When performing a chi-square goodness-of-fit test, explain why a large value of the chi-square statistic provides evidence that H0 should be rejected.
Showing 2500 - 2600
of 4119
First
19
20
21
22
23
24
25
26
27
28
29
30
31
32
33
Last
Step by Step Answers