New Semester
Started
Get
50% OFF
Study Help!
--h --m --s
Claim Now
Question Answers
Textbooks
Find textbooks, questions and answers
Oops, something went wrong!
Change your search query and then try again
S
Books
FREE
Study Help
Expert Questions
Accounting
General Management
Mathematics
Finance
Organizational Behaviour
Law
Physics
Operating System
Management Leadership
Sociology
Programming
Marketing
Database
Computer Network
Economics
Textbooks Solutions
Accounting
Managerial Accounting
Management Leadership
Cost Accounting
Statistics
Business Law
Corporate Finance
Finance
Economics
Auditing
Tutors
Online Tutors
Find a Tutor
Hire a Tutor
Become a Tutor
AI Tutor
AI Study Planner
NEW
Sell Books
Search
Search
Sign In
Register
study help
mathematics
business statistics
Business Statistics In Practice Using Data Modeling And Analytics 8th Edition Bruce L Bowerman, Richard T O'Connell, Emilly S. Murphree - Solutions
Suppose that x is a binomial random variable. Explain what the values of x represent. That is, how are the values of x defined?
What conditions must be satisfied by the probabilities in a discrete probability distribution? Explain what these conditions mean.
What is a discrete probability distribution? Explain in your own words.
Explain the concept of a random variable.
What sort of dependence seems to exist between whether U.S. residents believed that the amount of violent programming had increased and whether U.S. residents believed that the overall quality of programming had decreased? Explain your answer.
What proportion of the U.S. residents who believed that the overall quality of programming had decreased, believed that the amount of violent programming had increased?
What proportion of the U.S. residents who believed that the amount of violent programming had increased, believed that the overall quality of programming had decreased?
What proportion of the 1,000 U.S. residents believed that either the amount of violent programming had increased or the overall quality of programming had decreased over the past 10 years?
What proportion of the 1,000 U.S. residents believed that both the amount of violent programming had increased and the overall quality of programming had decreased over the past 10 years?
What proportion of the 1,000 U.S. residents believed that the overall quality of programming had decreased over the past 10 years?
What proportion of the 1,000 U.S. residents believed that the amount of violent programming had increased over the past 10 years?
A company employs eight people and plans to select a group of three of these employees to receive advanced training. How many ways can the group of three employees be selected?
A pop quiz consists of three true–false questions and three multiple choice questions. Each multiple choice question has five possible answers. If a student blindly guesses the answer to every question, what is the probability that the student will correctly answer all six questions?
A credit union has two branches; each branch has two departments, and each department has four employees. How many total people does the credit union employ? If you work for the credit union, and one employee is randomly selected to go to a convention, what is the probability that you will be
Explain when it is appropriate to use the counting rule for combinations.
Explain when it is appropriate to use the counting rule for multiple-step experiments.
Explain why counting rules are useful.
Explain the purpose behind using Bayes’ theorem.
What is a prior probability? What is a posterior probability?
Explain the properties that must be satisfied by a probability.
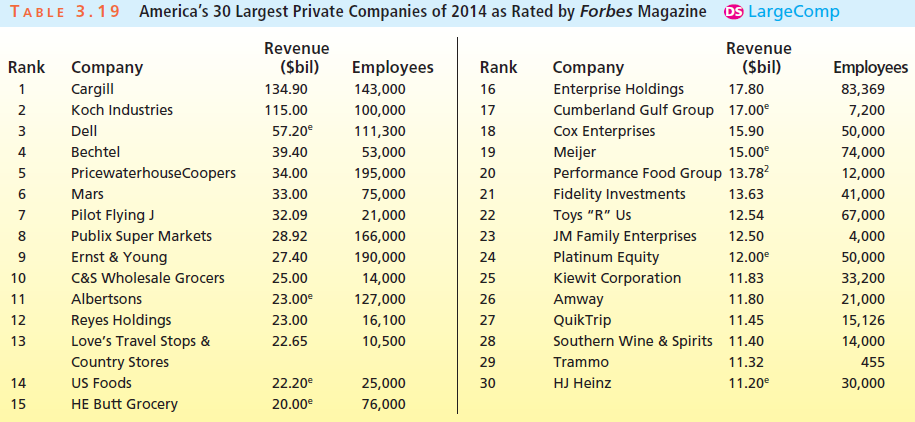
Table 3.19 on the next page gives data concerning America€™s 30 largest private companies of 2014 as rated by Forbes magazine.a. Construct a box-and-whiskers display of the large company revenues.b. Construct a box-and-whiskers display of the large company numbers of employees.c.
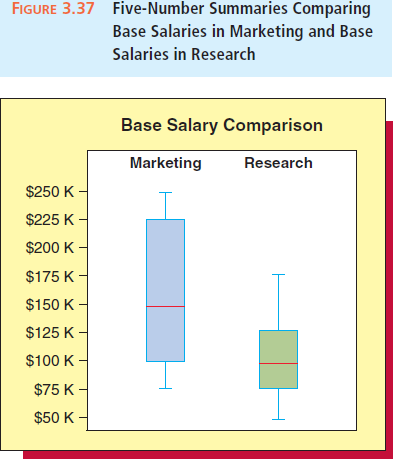
Figure 3.37 gives five-number summaries comparing the base yearly salaries of employees in marketing and employees in research for a large company. Interpret these summaries. FIGURE 3.37 Five-Number Summaries Comparing Base Salaries in Marketing and Base Salaries in Research Base Salary Comparison
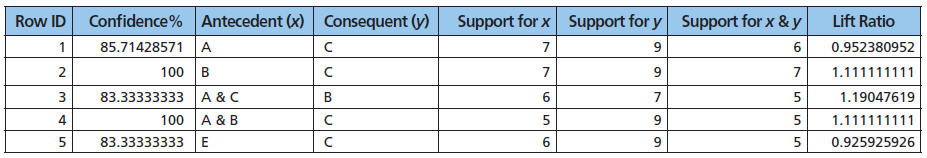
The XLMiner output of an association rule analysis of the DVD renters data using a specified support percentage of 40 percent and a specified confidence percentage of 70 percent is shown below.a. Summarize the recommendations based on a lift ratio greater than 1.b. Consider the recommendation of
In the previous XLMiner output, show how the lift ratio of 1.1111(rounded) for the recommendation of C to renters of B has been calculated. Interpret this lift ratio.
Discuss the meanings of the terms support percentage, confidence percentage, and lift ratio.
What is the purpose of association rules?
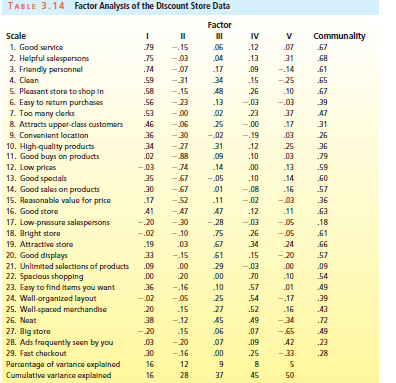
Table 3.14 shows the output of a factor analysis of the ratings of 82 respondents who were asked to evaluate a particular discount store on 29 attributes using a 7-point Likert scale. Interpret and give names to the five factors. TABLE 3.14 Factor Analysis of the Discount Store Data Factor Scale
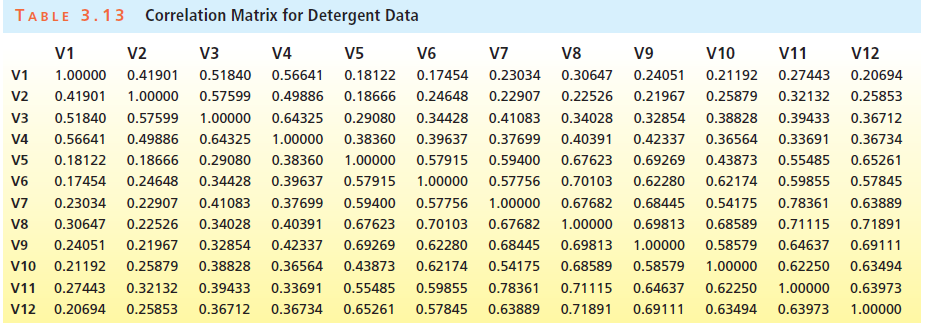
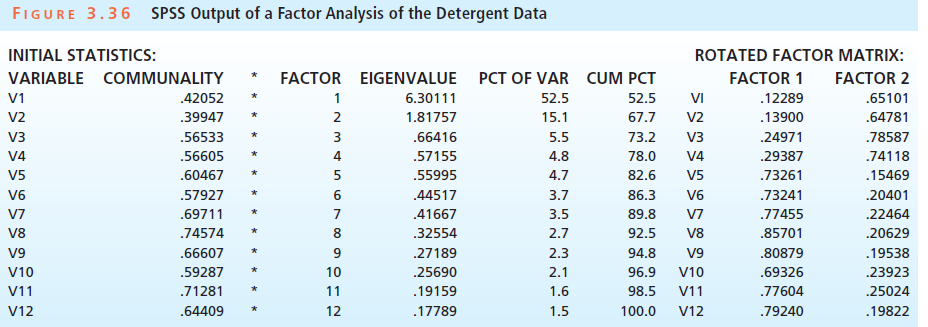
In Applied Multivariate Techniques (John Wiley and Sons, 1996), Subhash Sharma considers a study in which 143 respondents rated three brands of laundry detergents on 12 product attributes using a 5-point Likert scale. The 12 product attributes are:V1: Gentle to natural fabricsV2: Won€™t
Why does factor analysis do factor rotation?
What is the purpose of factor analysis?
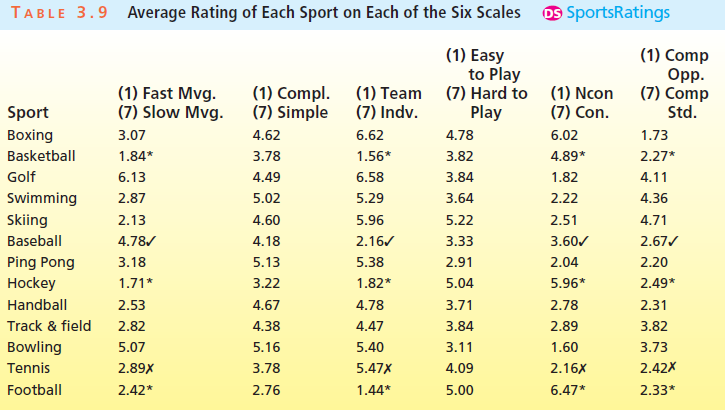
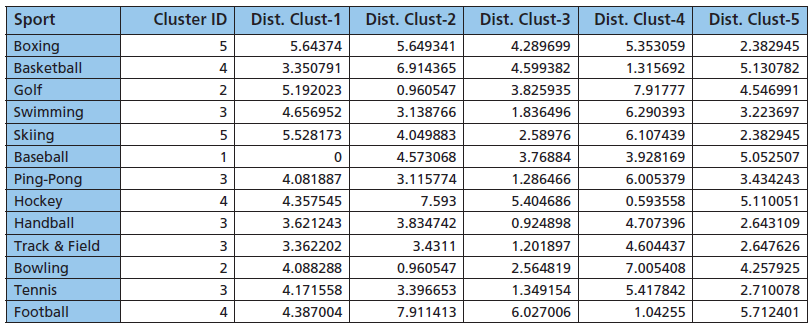
In order to carry out a k-means cluster analysis, we can use Minitab, JMP, or XLMiner. For example, consider using XLMiner to carry out a k-means cluster analysis of the sports perception data in Table 3.9, where we (somewhat arbitrarily) choose to use k = 5 clusters. In this case, the XLMiner
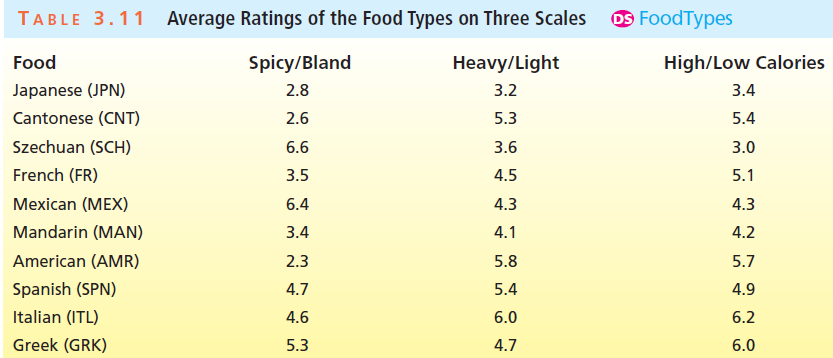
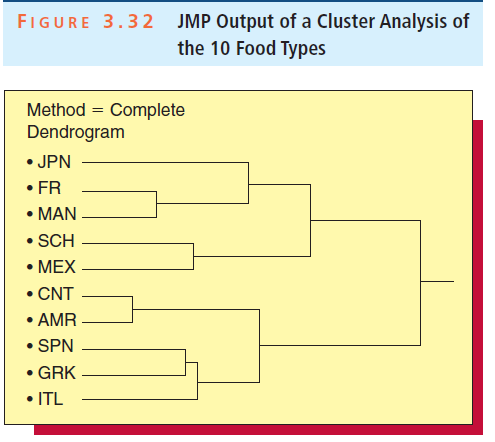
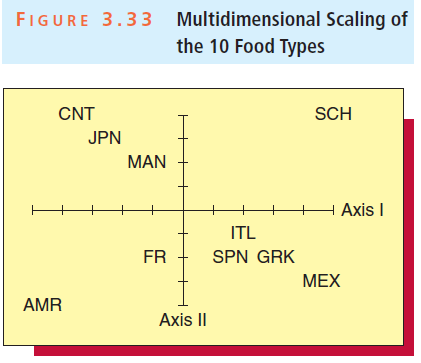
In this exercise we consider a marketing research study concerning the similarities and differences between the 10 types of food shown in Table 3.11. Each type of food was given an integer rating of 1 to 7 by 50 randomly selected restaurant-goers on three scales: bland (1) versus spicy (7), light
Explain what complete linkage means.
Explain how hierarchical clustering and k-means clustering differ with respect to reassigning an item to a different cluster.
What is the difference between a classification tree and a regression tree?
Refer to Exercise 3.52. The values of the DJIA on the first day of trading in 2005, 2006, 2007, 2008, and 2009 were 10,729.43, 10,847.41, 12,474.52, 13,043.96, and 9,034.69.a. Calculate the geometric mean rate of return for the DJIA from 2005 to 2013.b. If an investment of $100,000 is made in 2005
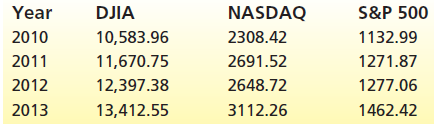
The following table gives the value of the Dow Jones Industrial Average (DJIA), NASDAQ, and the S&P 500 on the first day of trading for the years 2010 through 2013.a. For each stock index, compute the rate of return from 2010 to 2011, from 2011 to 2012, and from 2012 to 2013.b. Calculate the
If we know the initial value of an investment and its geometric mean return over a period of years, can we compute the ending value of the investment? If so, how?
In words, explain the interpretation of the geometric mean return for an investment.
The following is a frequency distribution summarizing earnings per share (EPS) growth data for the 30 fastest growing firms as given on Fortune magazine’s website on January 14, 2015.EPS Growth (Percent)
Sound City sells the TrueSound-XL, a top-of-the-line satellite car radio. Over the last 100 weeks, Sound City has sold no radios in three of the weeks, one radio in 20 of the weeks, two radios in 50 of the weeks, three radios in 20 of the weeks, four radios in 5 of the weeks, and five radios in 2
When we perform grouped data calculations, we represent the measurements in a class by using the midpoint of the class. Explain the assumption that is being made when we do this.
Consider calculating a student’s grade point average using a scale where 4.0 represents an A and 0.0 represents an F. Explain why the grade point average is a weighted mean. What are the xi values? What are the weights?
Discuss how the least squares line is used to predict y on the basis of x.
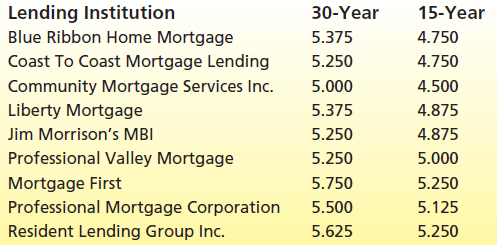
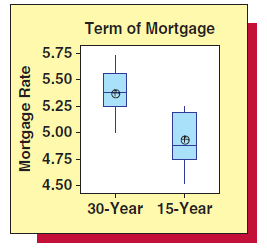
On its website, the Statesman Journal newspaper (Salem, Oregon, 2005) reports mortgage loan interest rates for 30 year and 15-year fixed-rate mortgage loans for a number of Willamette Valley lending institutions. Of interest is whether there is any systematic difference between 30 year rates and
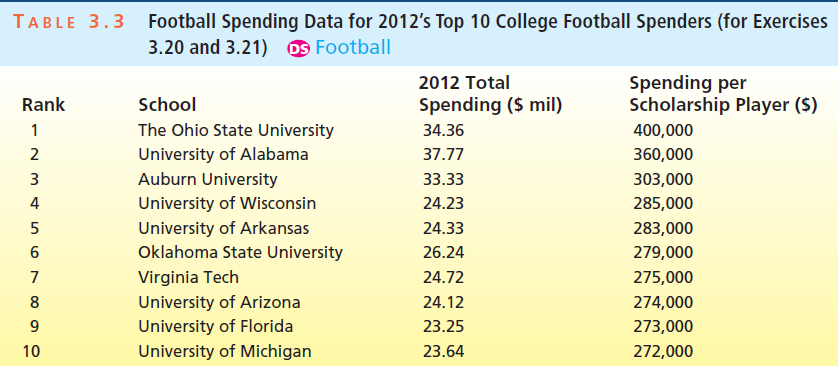
Consider Exercise 3.20.a. Compute and interpret the z€“score for each total spending figure.b. Compute and interpret the z€“score for each spending per scholarship player figure. Football Spending Data for 2012's Top 10 College Football Spenders (for Exercises 3.20 and 3.21) os
Table 3.3 gives spending data for the football programs at the 10 universities that spent the most money on football in 2012. Calculate the population range, variance, and standard deviation of the 10 total football spending figures. Do the same for the 10 spending per scholarship player figures.
The Empirical Rule for a normally distributed population and Chebyshev’s Theorem have the same basic purpose. In your own words, explain what this purpose is.
Discuss how the variance and the standard deviation measure variation.
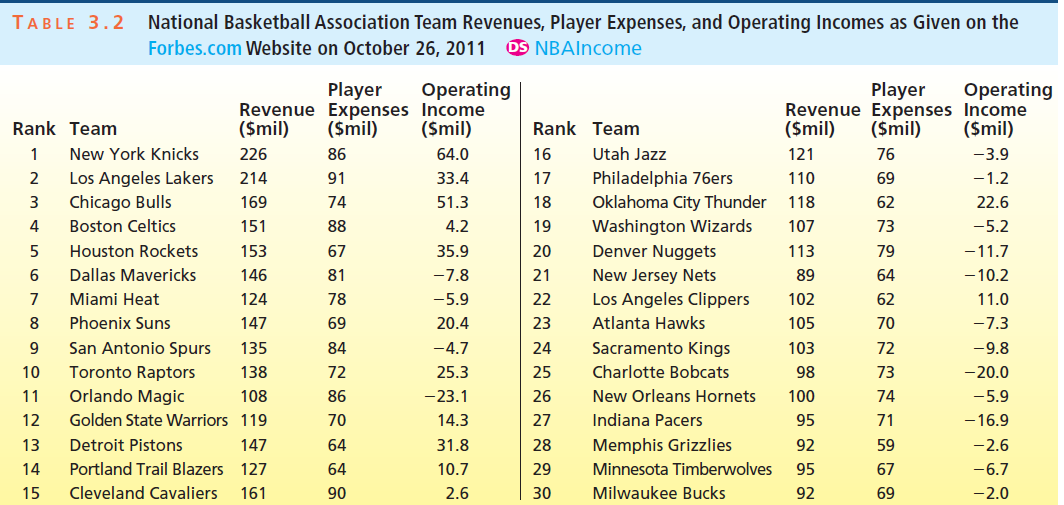
The mean team operating income is the operating income each NBA team would receive if the NBAowners divided the total of their operating incomes equally among the 30 NBA teams. (Of course, some of the owners might object to dividing their operating incomes equally among the teams).a. How would the
Compute the mean team operating income and the median team operating income, and explain the difference between the values of these statistics.In the National Basketball Association (NBA) lockout of 2011, the owners of NBA teams wished to change the existing collective bargaining agreement with the
Construct a histogram and a stem-and-leaf display of the teams€™ operating incomes.In the National Basketball Association (NBA) lockout of 2011, the owners of NBA teams wished to change the existing collective bargaining agreement with the NBA Players Association. The owners wanted a
Compute the mean team player expense and the median team player expense and explain the difference between the values of these statistics.In the National Basketball Association (NBA) lockout of 2011, the owners of NBA teams wished to change the existing collective bargaining agreement with the NBA
Construct a histogram and a stem-and-leaf display of the teams€™ player expenses.In the National Basketball Association (NBA) lockout of 2011, the owners of NBA teams wished to change the existing collective bargaining agreement with the NBA Players Association. The owners wanted a
Compute the mean team revenue and the median team revenue, and explain the difference between the values of these statistics.In the National Basketball Association (NBA) lockout of 2011, the owners of NBA teams wished to change the existing collective bargaining agreement with the NBA Players
Construct a histogram and a stem-and-leaf display of the teams€™ revenues.In the National Basketball Association (NBA) lockout of 2011, the owners of NBA teams wished to change the existing collective bargaining agreement with the NBA Players Association. The owners wanted a
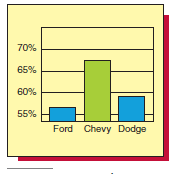
Figure 2.43 was used in various Chevrolet magazine advertisements in 1997 to compare the overall resale values of Chevrolet, Dodge, and Ford trucks in the years from 1990 to 1997. What is somewhat misleading about this graph?Figure 2.43 70% 65% 60% 55% Ford Chevy Dodge
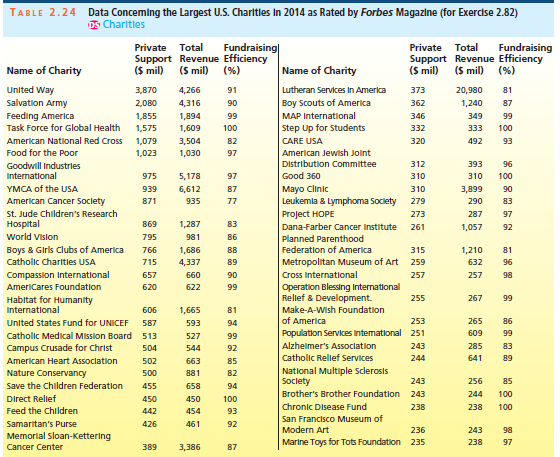
Table 2.24 presents data concerning the largest U.S. charities in 2014 as rated on the Forbes.com website on January 14, 2015.a. Construct a percent frequency histogram of each of(1) The charities€™ private support figures,(2) The charities€™ total revenues,(3) The
Develop a table of row percentages for the contingency table you set up in Exercise 2.76. Using these row percentages, construct a percentage frequency distribution of overall design quality rating for each of the United States, the Pacific Rim, and Europe. Illustrate these three frequency
Construct a contingency table of automobile origin versus overall design quality rating. Set up rows corresponding to the United States, the Pacific Rim (Japan/Korea), and Europe (Germany/Italy/Great Britain/Sweden), and set up columns corresponding to the ratings €œamong the
Construct a contingency table of automobile origin versus overall mechanical quality rating. Set up rows corresponding to the United States, the Pacific Rim (Japan/Korea), and Europe (Germany/Italy/Great Britain/Sweden), and set up columns corresponding to the ratings €œamong the
Construct a percentage pie chart of the overall design quality ratings for each of the following: automobiles of United States origin; automobiles of Pacific Rim origin (Japan/Korea); and automobiles of European origin (Germany/Italy/Great Britain/Sweden). Compare the three distributions in a
Construct a percentage bar chart of the overall mechanical quality ratings for each of the following: automobiles of United States origin; automobiles of Pacific Rim origin (Japan/Korea); and automobiles of European origin (Germany/Italy/Great Britain/Sweden). Compare the three distributions in a
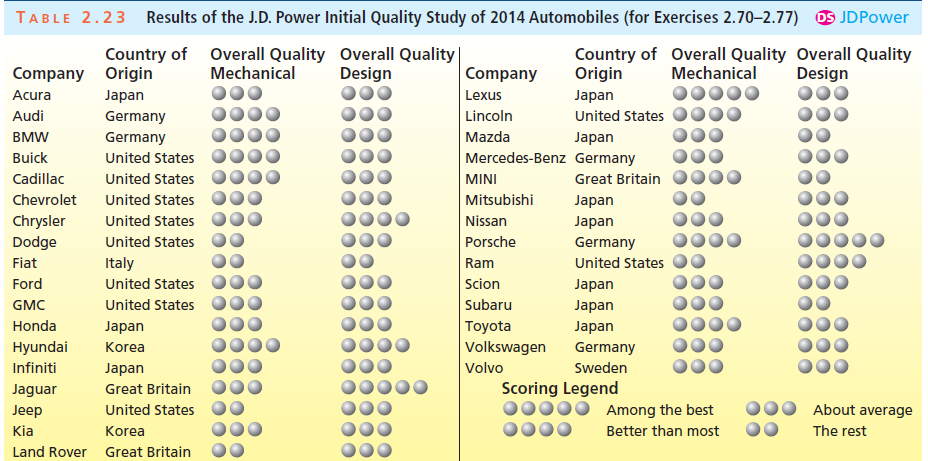
Develop a relative frequency distribution of the overall design quality ratings. Describe the distribution.Based on the data in Table 2.23 (see page 100). This table gives the results of the J.D. Power initial quality study of 2014 automobiles. Each model is rated on overall mechanical quality and
Develop a frequency distribution of the overall mechanical quality ratings. Describe the distribution.Based on the data in Table 2.23 (see page 100). This table gives the results of the J.D. Power initial quality study of 2014 automobiles. Each model is rated on overall mechanical quality and
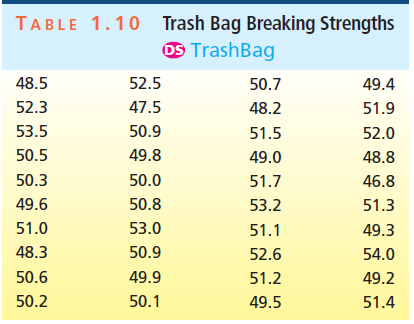
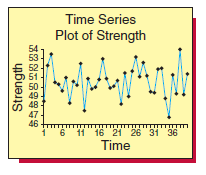
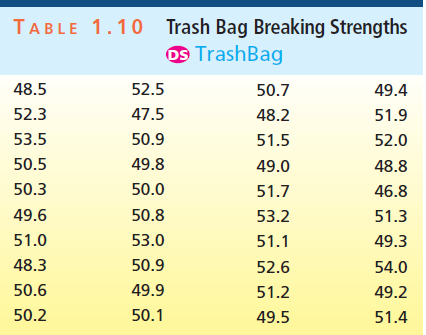
A company that produces and markets trash bags has developed an improved 30-gallon bag. The new bag is produced using a specially formulated plastic that is both stronger and more biodegradable than previously used plastics, and the company wishes to evaluate the strength of this bag.
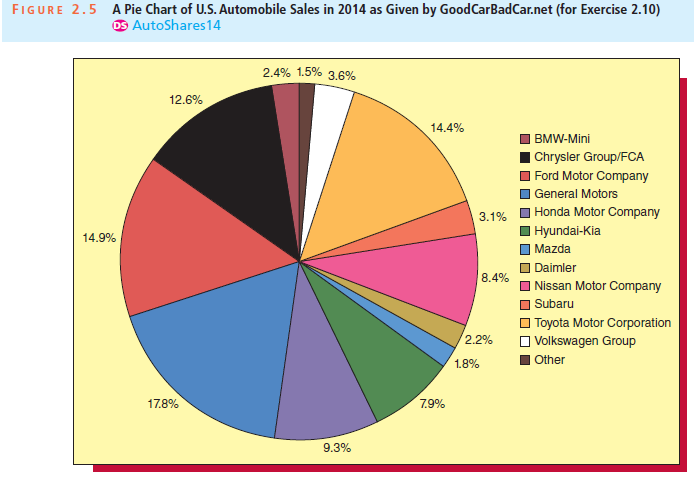
Figure 2.5 gives a percentage pie chart of new vehicle market shares in the United States for 2014 as given by GoodCarBadCar.net. Use this pie chart and your results from Exercise 2.9 to write an analysis explaining how new vehicle market shares in the United States have changed from 2005 to 2014.
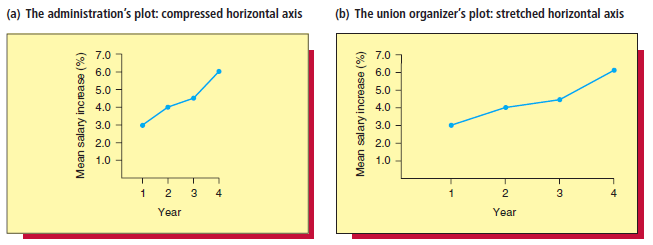
Figure 2.32 gives two more time series plots of the previously discussed mean nurses€™ salary increases. In Figure 2.32(a) the hospital administration has compressed the horizontal axis. In Figure 2.32(b) the union organizers have stretched the horizontal axis. Discuss the different
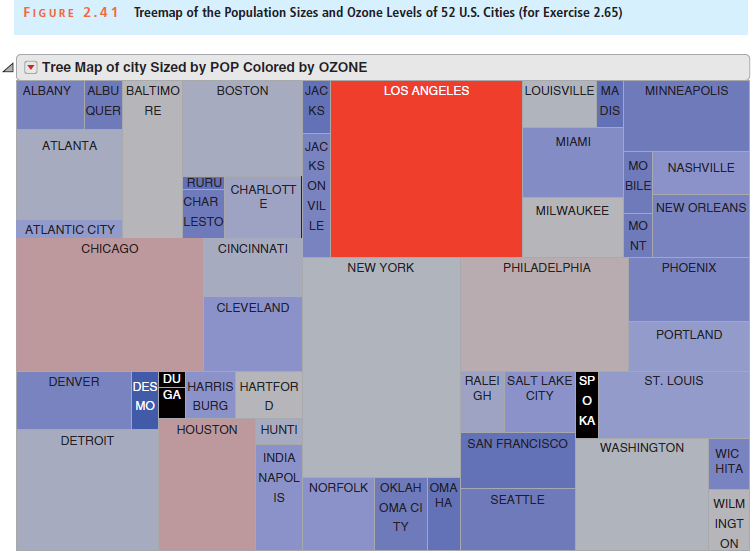
In the treemap in Figure 2.41, dark blue represents the lowest ozone level and bright red represents the highest ozone level. Where is the ozone level higher, Chicago or New York City? Treemap of the Population Sizes and Ozone Levels of 52 U.S. Cities (for Exercise 2.65) FIGURE 2.41 Tree Map of
What is data drill down?
Discuss how each of the following is used: gauge, bullet graph, treemap, sparkline.
When we construct a bar chart or graph, what is the effect of starting the vertical axis at a value that is far above zero? Explain.
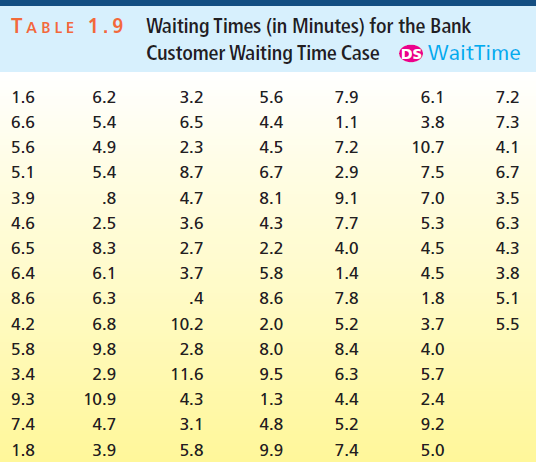
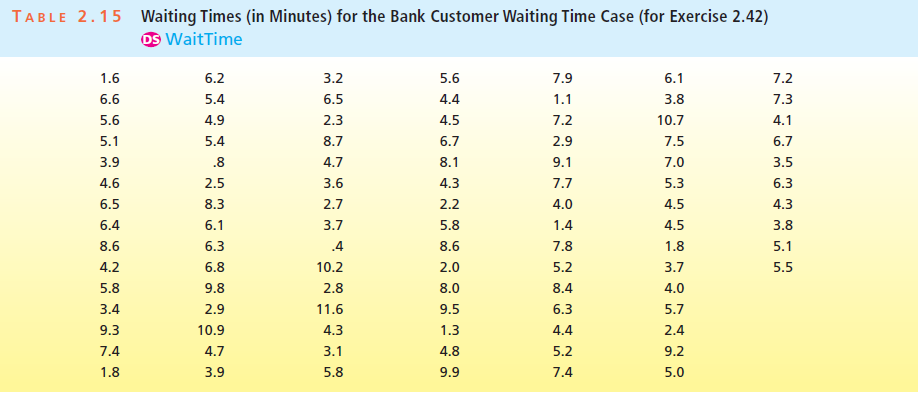
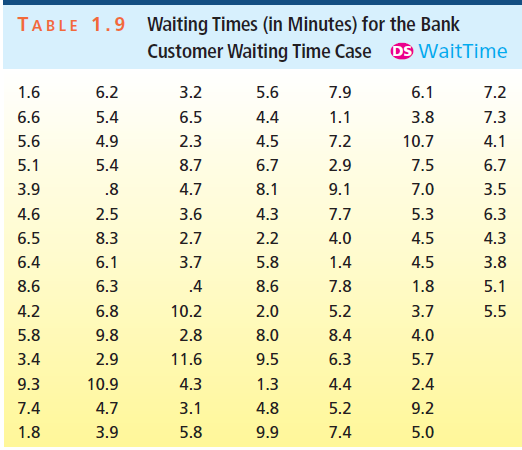
Table 2.15 reproduces the 100 waiting times for teller service that were originally given in Table 1.9.a. Construct a stem-and-leaf display of the waiting times.b. Describe the distribution of the waiting times. Waiting Times (in Minutes) for the Bank Customer Waiting Time Case os WaitTime TABLE
Discuss the relationship between a scatter plot and a time series plot.
Explain the purpose for constructing a scatter plot of y versus x.
A contingency table consists of several “cells.” Explain how we fill the cells in the table.
Explain the purpose behind constructing a contingency table.
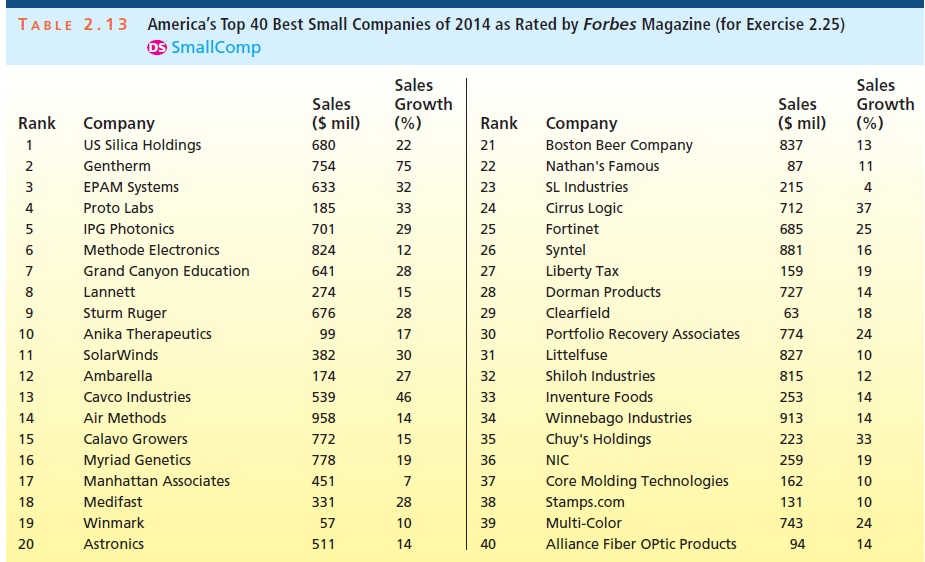
Table 2.13 gives America€™s top 40 best small companies of 2014 as rated on the Forbes.com website on January 14, 2015.a. Develop a frequency distribution and a frequency histogram for the sales values. Describe the distribution of these sales values.b. Develop a percent frequency
If a data set consists of 1,000 measurements, would you summarize the data set by using a stem-and-leaf display or a histogram? Explain.
What are the advantages of using a stem-and-leaf display?
Explain the difference between a histogram and a stem-and-leaf display.
If a data set consists of 1,000 measurements, would you summarize the data set using a histogram or a dot plot? Explain.
When we construct a dot plot, what does the horizontal axis represent? What does each dot represent?
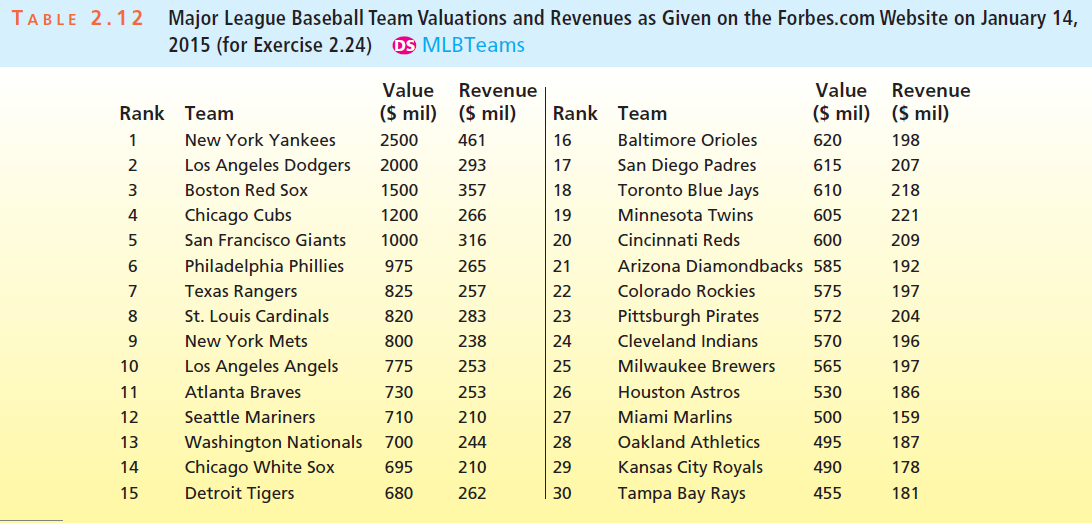
Table 2.12 gives the 2014 franchise value and revenues for each of the 30 teams in Major League Baseball as reported by Forbes magazine and as listed on the Forbes. com website on January 14, 2015.a. Develop a frequency distribution and a frequency histogram for the 30 team values. Then describe
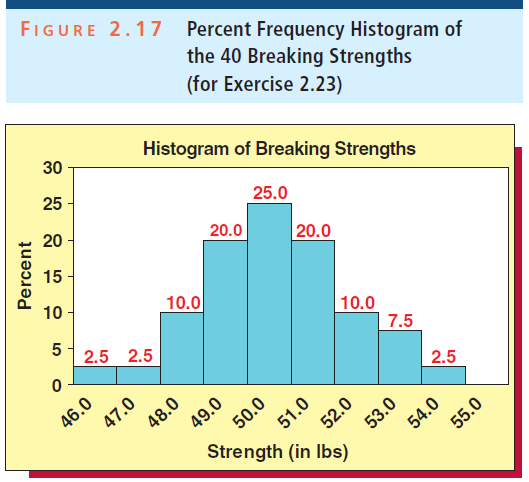
Recall that Table 1.10 presents the breaking strengths of 40 trash bags selected during a 40-hour pilot production run. Figure 2.17 gives a percent frequency histogram of these breaking strengths.a. Describe where the breaking strengths seem to be concentrated.b. Describe and interpret the shape of
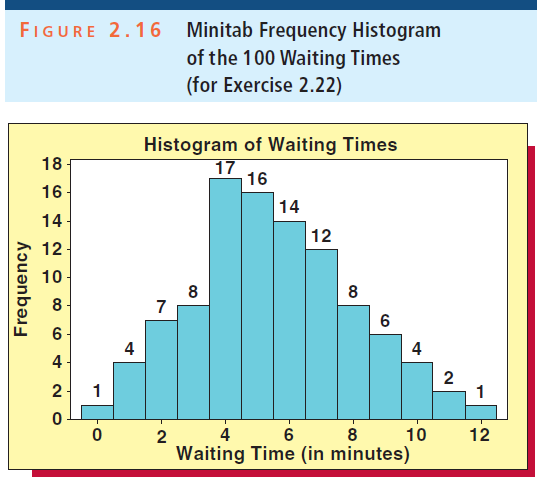
Recall that Table 1.9 presents the waiting times for teller service during peak business hours of 100 randomly selected bank customers.Figure 2.16 above gives the Minitab output of a histogram of these waiting times that has been constructed using automatic classes.a. Describe where the waiting
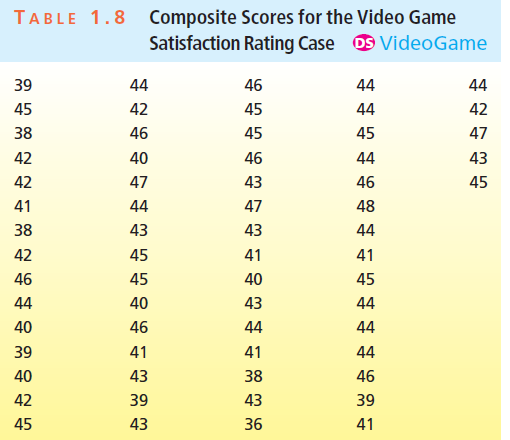
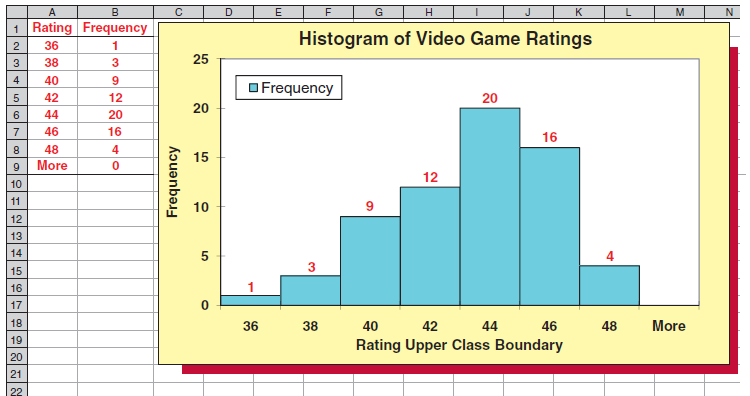
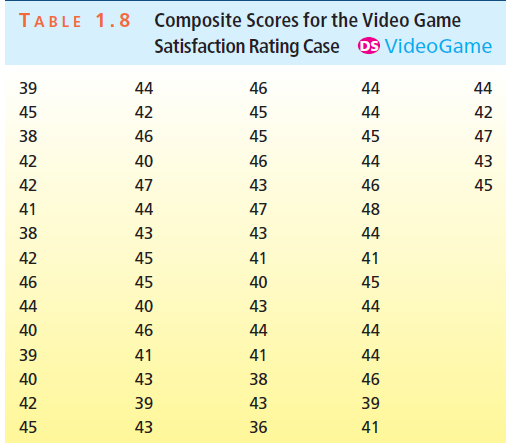
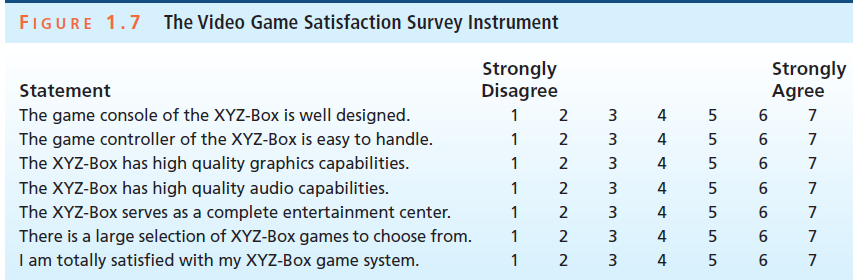
Recall that Table 1.8 presents the satisfaction ratings for the XYZ-Box video game system that have been given by 65 randomly selected purchasers. Figure 2.15 gives the Excel output of a histogram of these satisfaction ratings.Figure 2.15a. Describe where the satisfaction ratings seem to be
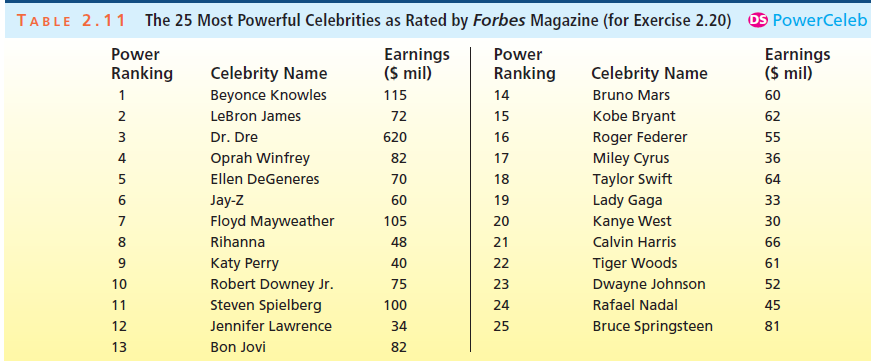
Table 2.11 gives the 25 most powerful celebrities and their annual earnings as ranked by the editors of Forbes magazine and as listed on theForbes.comwebsite on January 14, 2015.a. Remove Dr. Dre from the data set in this part as well as in parts b and c. Develop a frequency distribution for the
Explain how to compute the relative frequency and percent frequency for each class if you are given a frequency distribution.
Explain the purpose behind constructing a frequency or relative frequency distribution.
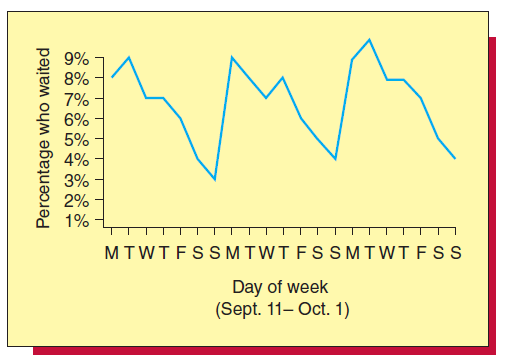
In the article €œAccelerating Improvement€ published in Quality Progress, Gaudard, Coates, and Freeman describe a restaurant that caters to business travelers and has a self-service breakfast buffet. Interested in customer satisfaction, the manager conducts a survey over a
According to the website of the American Association for Justice,14 Stella Liebeck of Albuquerque, New Mexico, was severely burned by McDonald€™s coffee in February 1992. Liebeck, who received third-degree burns over 6 percent of her body, was awarded $160,000 in compensatory damages and
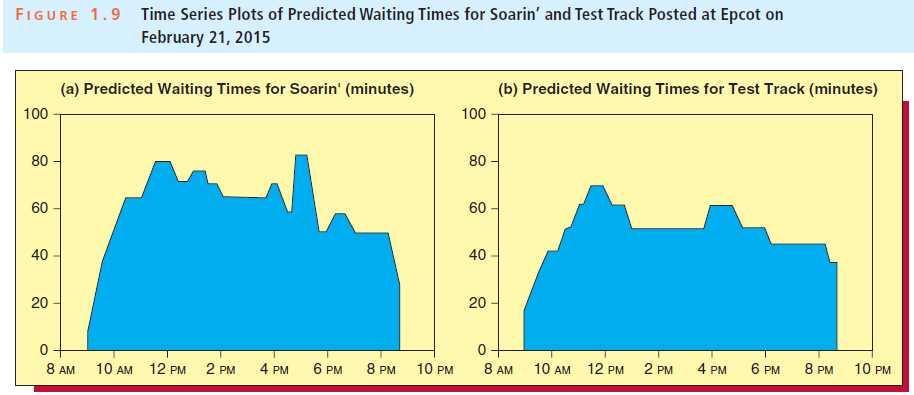
Read the approximate predicted waiting times for Soarin€™ and Test Track at 8 p.m. off of the time series plots in Figure 1.9. Construct a hand-drawn bullet graph of these two predicted waiting times.Figure 1.9 Time Series Plots of Predicted Waiting Times for Soarin' and Test Track Posted
When is cluster sampling used? Why do we describe this type of sampling by using the term cluster?
The time series plots in Figure 1.9 tell us that the predicted waiting times for Soarin€™ and Test Track at Epcot at 5 p.m. on February 21, 2015 were (approximately) 85 minutes and 60 minutes. Construct a hand-drawn bullet graph of these two predicted waiting times. (You need not include
Discuss the basic ideas ofa. Anomaly (outlier) detection.b. Association learning.c. Classification.d. Cluster detection.e. Prediction.f. Factor detection.
Explain each of the following terms:a. Descriptive analytics.b. Predictive analyticsc. Data mining.d. Prescriptive analytics.
A bank manager has developed a new system to reduce the time customers spend waiting to be served by tellers during peak business hours. Typical waiting times during peak business hours under the current system are roughly 9 to 10 minutes. The bank manager hopes that the new system will lower
A company that produces and markets video game systems wishes to assess its customers€™ level of satisfaction with a relatively new model, the XYZ Box. In the six months since the introduction of the model, the company has received 73,219 warranty registrations from purchasers. The
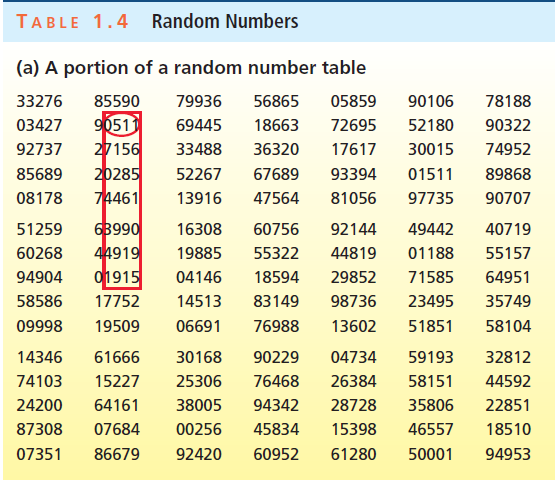
In the page margin, we list 15 companies that have historically performed well in the food, drink, and tobacco industries. Consider the random numbers given in the random number table of Table 1.4(a) on page 12. Starting in the upper left corner of Table 1.4(a) and moving down the two leftmost
Showing 2600 - 2700
of 4119
First
20
21
22
23
24
25
26
27
28
29
30
31
32
33
34
Last
Step by Step Answers