New Semester
Started
Get
50% OFF
Study Help!
--h --m --s
Claim Now
Question Answers
Textbooks
Find textbooks, questions and answers
Oops, something went wrong!
Change your search query and then try again
S
Books
FREE
Study Help
Expert Questions
Accounting
General Management
Mathematics
Finance
Organizational Behaviour
Law
Physics
Operating System
Management Leadership
Sociology
Programming
Marketing
Database
Computer Network
Economics
Textbooks Solutions
Accounting
Managerial Accounting
Management Leadership
Cost Accounting
Statistics
Business Law
Corporate Finance
Finance
Economics
Auditing
Tutors
Online Tutors
Find a Tutor
Hire a Tutor
Become a Tutor
AI Tutor
AI Study Planner
NEW
Sell Books
Search
Search
Sign In
Register
study help
mathematics
business statistics
Elementary Statistics A Step By Step Approach 10th Edition Allan G. Bluman - Solutions
Determine whether these events are mutually exclusive.a. Roll two dice: Get a sum of 7 or get doubles.b. Select a student in your college: The student is a sophomore and the student is a business major.c. Select any course: It is a calculus course and it is an English course.d. Select a registered
During a recent year, there were 13.5 million automobile accidents, 5.2 million truck accidents, and 178,000 motorcycle accidents. If one accident is selected at random, find the probability that it is either a truck or motorcycle accident. What is the probability that it is not a truck accident?
Here are the living arrangements of children under 18 years old living in the United States in a recent year. Numbers are in thousands.Both parents..........................51,823Mother only............................17,283Father only...............................2,572Neither
The numbers show the number of crimes committed in a large city. If a crime is selected at random, find the probability that it is a motor vehicle theft. What is the probability that it is not an assault?Theft....................................................1375Burglary of home or
The population of Hawaii is 22.7% white, 1.5% African-American, 37.7% Asian, 0.2% Native American/Alaskan, 9.46% Native Hawaiian/Pacific Islander, 8.9% Hispanic, 19.4% two or more races, and 0.14% some other. Choose one Hawaiian resident at random. What is the probability that he/she is a Native
In a game of craps, a player wins on the first roll if the player rolls a sum of 7 or 11, and the player loses if the player rolls a 2, 3, or 12. Find the probability that the game will last only one roll.
A couple has 4 children. Find each probability.a. All girlsb. Exactly two girls and two boysc. At least one child who is a girld. At least one child of each gender
Of all of the U.S. album sales 1989 (Taylor Swift) accounted for 25% of sales, Frozen (Various Artists) accounted for 24.1% of sales, In the Lonely Hour (Sam Smith) accounted for 8.2% of sales. What is the probability that a randomly selected album was something other than these three albums?
If one card is drawn from a deck, find the probability of getting these results:a. An aceb. A heartc. A 6 of spadesd. A 10 or a jacke. A card whose face values less than 7 (Count aces as 1.)
If two dice are rolled one time, find the probability of getting these results:a. A sum less than 9b. A sum greater than or equal to 10c. A 3 on one die or on both dice.
If two dice are rolled one time, find the probability of getting these results:a. A sum of 5b. A sum of 9 or 10c. Doubles
If a die is rolled one time, find these probabilities:a. Getting a number less than 7.b. Getting a number greater than or equal to 3c. Getting a number greater than 2 and an even numberd. Getting a number less than 1
If a die is rolled one time, find these probabilities:a. Getting a 7b. Getting an odd numberc. Getting a number less than 7d. Getting a prime number (2, 3, or 5)
Classify each statement as an example of classical probability, empirical probability, or subjective probability.a. The probability that a student will get a C or better in a statistics course is about 70%.b. The probability that a new fast-food restaurant will be a success in Chicago is 35%.c. The
A probability experiment is conducted. Which of these cannot be considered a probability outcome?a. 2/3b. 0.63c. − 3/5d. 1.65e. − 0.44f. 0g. 1h. 125%i. 24%
If the probability that it will rain tomorrow is 0.20, what is the probability that it won’t rain tomorrow? Would you recommend taking an umbrella?
What is the sum of the probabilities of all the outcomes in a sample space?
If an event cannot happen, what value is assigned to its probability?
When an event is certain to occur, what is its probability?
What is the range of the values of the probability of an event?
What are equally likely events?
What is the difference between an outcome and an event?
Define sample space.
What is a probability experiment?
The data show the number of named storms for the years 1851€“1860 and 1941 and 1950. Construct a boxplot for each data set and compare the distributions. 1851–1860 1941–1950 6 5 8 5 5 6 4 6 10 10 11 11 6 9 9 13 13
The frequency distribution shows the number of days it took to fix each of 80 computer’s printers.Class limits Frequency1–3
The number of police calls a small police department received each month is shown in the frequency distribution.Class limits Frequency39.9–42.8
The data show the number of specific recorded cases of meningitis for 14 specific states.Find the z values for eacha. 10b. 28c. 41 10 1 1 28 15 41 4 4 8 2 3 53 34 1
The mean time it takes a group of students to complete a statistics final exam is 44 minutes, and the standard deviation is 9 minutes. Within what limits would you expect approximately 95% of the students to complete the exam? Assume the variable is approximately normally distributed.
The average cost of a man’s haircut is $21. The standard deviation is $4. If the variable is approximately bell-shaped, within what limits would 68% of the haircut cost?
If the range of a data set is 56, find the approximate value of the standard deviation, using the range rule of thumb.
If the range of a data set is 24, find the approximate value of the standard deviation, using the range rule of thumb.
The data show a sample of the number of confirmed measles cases over a recent 12-year period. Find the range, variance, and standard deviation for the data. 212 44 43 55 63 71 66 37 140 56 86 116
The data show the systolic blood pressure of 30 college students. Find the mean and modal class.Class Frequency105–109
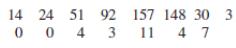
The data show the number of bank failures over a 15-year period. Find the mean, median, midrange, and mode for the data. 14 24 51 92 157 148 30 3 0 0 4 3 11 4 7
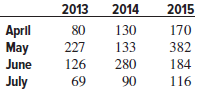
A four-month record for the number of tornadoes in 2013€“2015 is given here.a. Which month had the highest mean number of tornadoes for this 3-year period? May:b. Which year has the highest mean number of tornadoes for this 4-month period? 2015:c. Construct three boxplots and compare the
The data show the heights (in feet) of the 10 largest dams in the United States. Identify the five-number summary and the interquartile range, and draw a boxplot. 770 730 717 710 645 606 602 585 578 564
The data show the sizes in square miles of notable islands in the Baltic Sea and the Aleutian Islands. Construct a boxplot for each data set and compare the distributions.Baltic Sea Aleutian Islands610
The data show the population (in thousands) of the U.S. Colonies in 1700 (Vermont was not a colony until 1791). Construct a boxplot and decide if the distribution is symmetric. 26.0 2.5 29.6 55.9 5.0 14.0 19.1 10.7 18.0 5.9 5.7 58.6
Construct a boxplot for the following data which represent the number of innings pitched by the ERA leaders for the past few years. Comment on the shape of the distribution. 239 249 266 251 245 238 236 228 246 232 241 248 240
The data show a sample of states€™ percentage of public high school graduation rates for a recent year. Construct a boxplot for the data, and comment on the shape of the distribution. 79 82 7 84 80 89 60 79 91 93 88
Identify the five-number summary and find the interquartile range.9.7, 4.6, 2.2, 3.7, 6.2, 9.4, 3.8
Identify the five-number summary and find the interquartile range.14.6, 19.8, 16.3, 15.5, 18.2
A particular standardized test has scores that have a mound-shaped distribution with mean equal to 125 and standard deviation equal to 18. Tom had a raw score of 158, Dick scored at the 98th percentile, and Harry had a z score of 2.00. Arrange these three students in order of their scores from
An employment evaluation exam has a variance of 250. Two particular exams with raw scores of 142 and 165 have z scores of −0.5 and 0.955, respectively. Find the mean of the distribution.
Check each data set for outliers.a. 46, 28, 32, 21, 25, 29, 34, 19b. 82, 100, 97, 93, 89, 90, 65, 94, 101c. 527, 1007, 489, 371, 175
The data show the gold reserves for a recent year for 11 world countries. Find the first and third quartiles and the IQR. The data are in millions of troy ounces. 33.9 78.3 108.9 17.9 78.8 24.6 19.7 33.3 33.4 10.0 261.5
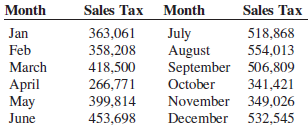
The data show the amount of sales tax paid in Denver County, Colorado. Find the first and third quartiles for the data. Month Sales Tax Month Sales Tax Jan 363,061 July August September 506,809 518,868 358,208 554,013 Feb March 418,500 April May 266,771 October 341,421 399,814 November 349,026 June
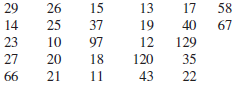
The data for a recent year show the taxes (in millions of dollars) received from a random sample of 10 states. Find the first and third quartiles and the IQR. 13 15 32 36 11 4 6 25 11 71
Find the percentile rank for each test score in the data set.5, 12, 15, 16, 20, 21What test score corresponds to the 33rd percentile?
The data show the population (in thousands) for a recent year of a sample of cities in South Carolina.Find the data value that corresponds to each percentile.a. 40th percentileb. 75th percentilec. 90th percentiled. 30th percentileUsing the same data, find the percentile corresponding to the given
The average miles driven annually per licensed driver in the United States is approximately 14,090 miles. If we assume a fairly mound-shaped distribution with a standard deviation of approximately 3500 miles, find the following:a. z score for 16,000 milesb. z score for 10,000 milesc. Number of
The mean age at which females marry is 24.6. The standard deviation is 3.2 years. Find the corresponding z score for each.a. 27 b. 22c. 31d. 18e. 26
Which is a better relative position, a score of 83 on a geography test that has a mean of 72 and a standard deviation of 6, or a score of 61 on an accounting test that has a mean of 55 and a standard deviation of 3.5?
The average age of Senators in the 114th congress was 61.7 years. If the standard deviation was 10.6, find the z scores of a senator who is 48 years old and one who is 66 years old.
To which percentile, quartile, and decile does the median correspond?
How are deciles related to percentiles?
What is a decile?
What is the relationship between quartiles and percentiles?
Define quartile.
What is the difference between a percentage and a percentile?
Define percentile rank.
The mean and standard deviation of the bonuses that the employees of a company received 10 years ago were, respectively, $2,000 and $325. Today the amount of the bonuses is 5 times what it was 10 years ago. Find the mean and standard deviation of the new bonuses.
The mean price of the fish in a pet shop is $2.17, and the standard deviation of the price is $0.55. If the owner decides to triple the prices, what will be the mean and standard deviation of the new prices?
The mean and standard deviation of the number of hours the employees work in the music store per week are, respectively, 18.6 and 3.2 hours. If the owner increases the number of hours each employee works per week by 4 hours, what will be the new mean and standard deviation of the number of hours
The average price of an instrument at a small music store is $325. The standard deviation of the price is $52. If the owner decides to raise the price of all the instruments by $20, what will be the new mean and standard deviation of the prices?
The national average for mathematics SATs in 2014 was 538. Suppose that the distribution of scores was approximately bell-shaped and that the standard deviation was approximately 48. Within what boundaries would you expect 68% of the scores to fall? What percentage of scores would be above 634?
The average farm in the United States in 2014 contained 504 acres. The standard deviation is 55.7 acres. Use Chebyshev’s theorem to find the minimum percentage of data values that will fall in the range of 392.5 and 896.57 acres.
The average sale price of one-family houses in the United States for January 2016 was $258,100. Find the range of values in which at least 75% of the sale prices will lie if the standard deviation is $48,500.
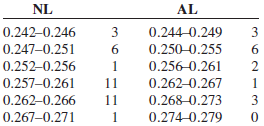
Team batting averages for major league baseball in 2015 are represented below. Find the variance and standard deviation for each league. Compare the results. NL AL 0.242-0.246 3 0.244-0.249 3 0.250-0.255 0.247-0.251 0.252-0.256 1 0.256-0.261 0.257-0.261 11 0.262-0.267 1 0.262-0.266 11 0.268-0.273 3
The following frequency distribution shows the average number of pupils per teacher in the 50 states of the United States. Find the variance and standard deviation for the data.Class limits Frequency9–11
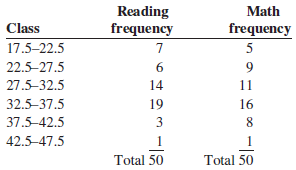
The frequency distributions shown indicate the percentages of public school students in fourth-grade reading and mathematics who performed at or above the required proficiency levels for the 50 states in the United States. Draw histograms for each, and decide if there is any difference in the
One of the air pollutants that is measured in selected cities is sulfur dioxide. This pollutant occurs when fossil fuels are burned. This pollutant is measured in micrograms per cubic meter (μg/m3). The results obtained from a sample of 24 cities are shown in the frequency
The source of federal government revenue for a specific year is50% from individual income taxes32% from social insurance payroll taxes10% from corporate income taxes3% from excise taxes5% otherIf a revenue source is selected at random, what is the probability that it comes from individual or
A person flipped a coin 100 times and obtained 73 heads. Can the person conclude that the coin was unbalanced?
A medical doctor stated that with a certain treatment, a patient has a 50% chance of recovering without surgery. That is, “Either he will get well or he won’t get well.” Comment on this statement.
Toss three coins 128 times and record the number of heads (0, 1, 2, or 3); then record your results with the theoretical probabilities. Compute the empirical probabilities of each.
Toss two coins 100 times and record the number of heads (0, 1, 2). Compute the probabilities of each outcome, and compare these probabilities with the theoretical results.
Define mutually exclusive events, and give an example of two events that are mutually exclusive and two events that are not mutually exclusive.
Explain briefly why addition rule 2 can be used when two events are mutually exclusive.
Determine whether these events are mutually exclusive:a. Draw a card: get a spade and get a 6b. Roll a die: get a prime number (2, 3, 5)c. Roll two dice: get a sum of 7 or get a sum that is an even numberd. Select a student at random in your class: get a male or get a sophomore
A researcher conducted a survey asking people if they believed more than one person was involved in the assassination of John F. Kennedy. The results were as follows: 73% said yes, 19% said no, and 9% had no opinion. Is there anything suspicious about the results?
The frequency distribution shows a sample of the waterfall heights, in feet, of 28 waterfalls. Find the variance and standard deviation for the data.Class boundaries Frequency52.5–185.5
Use the data from Exercises 7, 15, and 17 (unemployment, prisoners, precipitation days) and compare the standard deviation with that obtained by the range rule of thumb (R/4.) Comment on the results.In exercise 15283 394 383 580 498 460 377 482In exercise 17 116 77 135 128 136 116 123 98 44 97 44
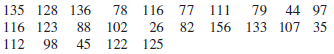
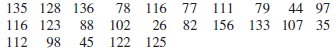
The number of annual precipitation days for one-half of the 50 largest U.S. cities is listed below. Find the range, variance, and standard deviation of the data. 135 128 136 116 123 88 98 79 44 97 116 77 111 78 102 26 82 156 133 107 35 45 122 125 26 112
The data show the number of public laws passed by the U.S. Congress for a sample of recent years. Find the range, variance, and standard deviation for the data.283 394 383 580 498 460 377 482
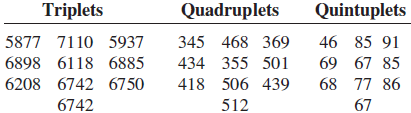
The numbers of various multiple births in the United States for the past 10 years are listed. Find the range, variance, and standard deviation of the data sets. Which set of data is the most variable? Quadruplets 345 468 369 434 355 501 418 506 439 Quintuplets 46 85 91 69 67 85 68 77 86 Triplets
The following data show the price of silver and the price of tin over a recent 9-year period. Find the range, variance, and standard deviation. Which data set is more variable?Silver Tin23.80
The data show the traveler spending in billions of dollars for a recent year for a sample of the states. Find the range, variance, and standard deviation for the data. 110.8 30.9 58.4 20.1 33.5 74.8 23.2 21.7 60.0 24.0
Why is the unbiased estimator of variance used?
What are the symbols used to represent the sample variance and standard deviation?
What are the symbols used to represent the population variance and standard deviation?
Why might the range not be the best estimate of variability?
What is the relationship between the variance and the standard deviation?
Find the mean of 10, 20, 30, 40, and 50.a. Add 10 to each value and find the mean.b. Subtract 10 from each value and find the mean.c. Multiply each value by 10 and find the mean.d. Divide each value by 10 and find the mean.e. Make a general statement about each situation.
If the mean of five values is 64, find the sum of the values.
A local fast-food company claims that the average salary of its employees is $13.23 per hour. An employee states that most employees make minimum wage. If both are being truthful, how could both be correct?
What types of symbols are used to represent sample statistics? Give an example. What types of symbols are used to represent population parameters? Give an example.
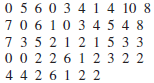
The data show the number of children U.S. Presidents through Obama, had. Construct an ungrouped frequency distribution and find the mean and modal class. 0 5603 4 1 4 10 8 4 4 2 61 2 2
The data show the number of points the winning team scored in the Rose Bowl. Find the mean and modal class for the data.Class Frequency14–20
Showing 3800 - 3900
of 4119
First
28
29
30
31
32
33
34
35
36
37
38
39
40
41
42
Step by Step Answers