New Semester
Started
Get
50% OFF
Study Help!
--h --m --s
Claim Now
Question Answers
Textbooks
Find textbooks, questions and answers
Oops, something went wrong!
Change your search query and then try again
S
Books
FREE
Study Help
Expert Questions
Accounting
General Management
Mathematics
Finance
Organizational Behaviour
Law
Physics
Operating System
Management Leadership
Sociology
Programming
Marketing
Database
Computer Network
Economics
Textbooks Solutions
Accounting
Managerial Accounting
Management Leadership
Cost Accounting
Statistics
Business Law
Corporate Finance
Finance
Economics
Auditing
Tutors
Online Tutors
Find a Tutor
Hire a Tutor
Become a Tutor
AI Tutor
AI Study Planner
NEW
Sell Books
Search
Search
Sign In
Register
study help
mathematics
business statistics
Elementary Statistics A Step By Step Approach 10th Edition Allan G. Bluman - Solutions
The data show the maximum wind speeds for a sample of 40 states. Find the mean and modal class for the data.Class boundaries Frequency47.5–54.5
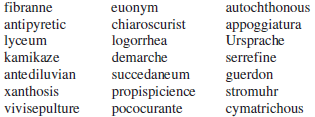
The last words given and spelled correctly at the National Spelling Bee for the past 21 years are spelled out below. Count the number of letters in each word, and find the mean, median, mode, and midrange for the data. fibranne antipyretic autochthonous appoggiatura euonym chiaroscurist logorrhea
Of the 25 brightest stars, the distances from earth (in light-years) for those with distances less than 100 light-years are found below. Find the mean, median, mode, and midrange for the data. 8.6 36.7 42.2 11.4 16.8 33.7 25.1 77.5 87.9 25.3 4.4 65.1 51.5
The data show a sample of the number of passengers in millions that major airlines carried for a recent year. Find the mean, median, midrange, and mode for the data. 143.8 17.7 8.5 120.4 33.0 27.1 7.1 10.0 5.0 6.1 4.3 3.1 12.1
The data show the number of paid days off workers get in a sample of various countries of the world. Find the mean, median, midrange, and mode for the data. 30 으으
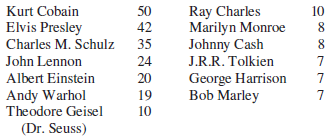
Forbes magazine prints an annual Top-Earning Nonliving Celebrities list (based on royalties and estate earnings). Find the mean, median, mode, and midrange for the data. Comment on the skewness. Figures represent millions of dollars. 50 Ray Charles Marilyn Monroe Johnny Cash J.R.R. Tolkien Kurt
The following represent XBOX One Top Selling Games and units sold:Titanfall............................................................2,000,000Call of Duty: Ghosts........................................1,790,000Battlefield 4.....................................................1,340,000Forza
The lengths of school years in a sample of various countries in the world are shown. Find the mean, median, midrange, and mode of the data. 251 243 226 216 196 180
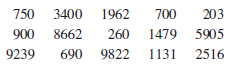
The number of short-term parking spaces at 15 airports is shown. Find the mean, median, mode, and midrange for the data. 750 3400 1962 260 690 9822 1131 203 750 700 1479 5905 2516 8662 900 9239 2516
The data show the heights in feet of 14 roller coasters. Find the mean, median, midrange, and mode for the data. 102 105 125 50 91 95 102 120 160 95 118 160 50 84
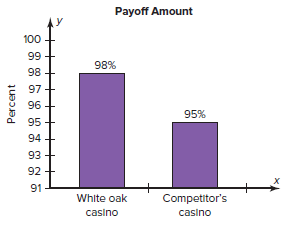
The graph shows the payoffs obtained from the White Oak Casino compared to the nearest competitor€™s casino. Why is this graph misleading? Payoff Amount 100 99 98% 98 + 97 96 95% 95 94 93 92 91 White oak Competitor's casino casino Percent
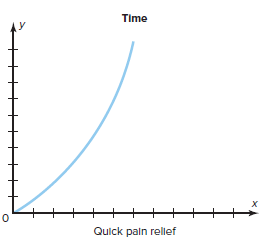
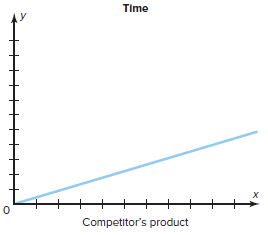
The graph below shows the time it takes Quick Pain Relief to relieve a person€™s pain. The graph below that shows the time a competitor€™s product takes to relieve pain. Why might these graphs be misleading? Time Quick pain rellef Time Competitor's product
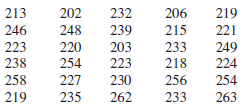
A local football team has 30 players; the weight of each player is shown. Construct a stem and leaf plot for the data. Use stems 20__, 21__, 22__, etc. 213 202 232 206 219 246 248 239 215 221 223 220 203 233 249 238 254 223 218 224 258 230 256 227 254 219 235 262 233 263
The data show the number of songs on each of 40 CDs from the author€™s collection. Construct a dotplot for the data and comment on the graph. 18 uospS5기59D 으=e202으nuu
Peyton Manning played for the Indianapolis Colts for 14 years. (He did not play in 2011.) The data show the number of touchdowns he scored for the years 1998€“2010. Construct a dotplot for the data and comment on the graph. 33 26 26 26 33 27 33 49 27 28 29 31
Construct and analyze a pie graph for the people who did or did not buy insurance for their smart phones at the time of purchase.Response
The data show the high school dropout rate for students for the years 2003 to 2013. Construct a time series graph and analyze thegraph.Year
The data show the number of new Broadway productions for the seasons. Construct and analyze a time series graph for the data.Season New
The data (in billions of dollars) show the estimated amount of money spent on pet care in the United States. Construct a Pareto chart for the data.Type of care Amount
The data show the percentage of the types of crimes commonly committed in the United States. Construct a Pareto chart for the data.Theft........................................55%Burglary...................................20%Motor Vehicle
The data show the number of calories per ounce in selected types of nuts. Construct vertical and horizontal bar graphs for the data.Types
The data show the yearly consumption (in gallons) of popular non-alcoholic beverages. Draw a vertical and horizontal bar graph to represent the data.Soft drinks...............52Water.......................34Milk..........................26Coffee......................21
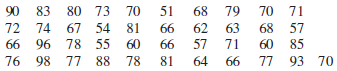
Construct a histogram, frequency polygon, and ogive, using relative frequencies for the data in Exercise 5.Data from 5 79 70 71 63 83 90 72 66 80 73 68 70 51 66 74 67 54 81 62 66 78 68 57 96 78 55 76 60 85 71 66 57 77 88 93 70 77 98 81 64
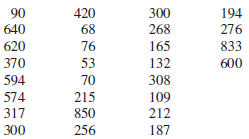
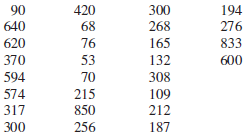
Construct a histogram, frequency polygon, and ogive, using relative frequencies for the data in Exercise 5.Data from 5 90 420 300 194 640 68 268 276 620 76 165 833 370 53 132 600 594 70 308 574 215 109 317 850 212 300 256 187
Construct a histogram, frequency polygon, and ogive for the data in Exercise 6.Data from 6 79 70 71 63 83 90 72 66 80 73 68 70 51 66 74 67 54 81 62 66 78 68 57 96 78 55 76 60 85 71 66 57 77 88 93 70 77 98 81 64
Construct a histogram, frequency polygon, and ogive for the data in Exercise 5.Data from 5 90 420 300 194 640 68 268 276 620 76 165 833 370 53 132 600 594 70 308 574 215 109 317 850 212 300 256 187
Find the relative frequency for the frequency distribution for the data in Exercise 6.Data from 6 79 70 71 63 83 90 72 66 80 73 68 70 51 66 74 67 54 81 62 66 78 68 57 96 78 55 76 60 85 71 66 57 77 88 93 70 77 98 81 64
Find the relative frequency for the frequency distribution for the data in Exercise 5.Data from 5 90 420 300 194 640 68 268 276 620 76 165 833 370 53 132 600 594 70 308 574 215 109 317 850 212 300 256 187
The data show the heights (in feet) of notable waterfalls in North America. Organize the data into a grouped frequency distribution using 6 classes. This data will be used for Exercises 7, 9, and 11. 90 420 300 194 640 68 268 276 620 76 165 833 370 53 132 600 594 70 308 574 215 109 317 850 212 187
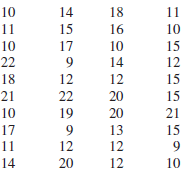
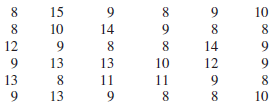
The data show the average wind speed for 36 days in a large city. Construct an ungrouped frequency distribution for the data. 10 15 10 8. 14 9. 8. 14 12 12 8. 8. 13 11 9. 10 11 8. 9. 13 13 10 8. 13
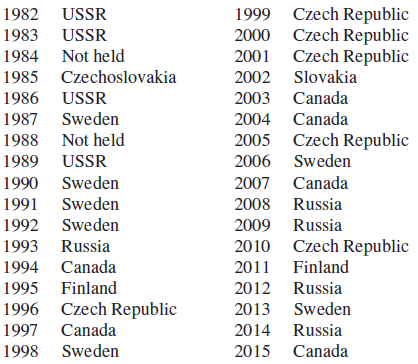
The United States won the Men€™s World Hockey Championship in 1933 and 1960. Below are listed the world champions for the last 30 years. Use this information to construct a frequency distribution of the champions. What is the difficulty with these data? 1999 Czech Republic 2000 Czech
The average amount requested for business trip reimbursement is itemized below. Illustrate the data with an appropriate graph. Do you have any questions regarding the data?Flight..........................................$440Hotel
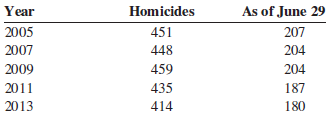
Draw and compare two time series graphs for the number of homicides in the Chicago area. As of June 29 207 204 204 Homicides 451 448 Year 2005 2007 2009 2011 | 2013 459 435 414 187 180
The following information was found in a recent almanac. Use a pie graph to illustrate the information. Is there anything wrong with the data?U.S. Population by Age in 2011Under 20 years..................27.0%20 years and over.................73.065 years and over.................13.1
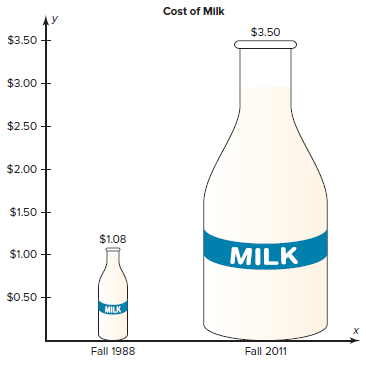
The graph shows the increase in the price of a quart of milk. Why might the increase appear to be larger than it really is? Cost of Milk $3.50 $3.50 $3.00 $2.50 $2.00 $1.50 + $1.08 MILK $1.00 $0.50 MILK Fall 1988 Fall 2011
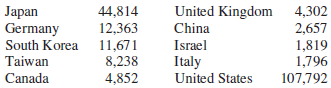
The U.S. Department of Commerce reports the following number of U.S. patents received by foreign countries and the United States in the year 2010. Illustrate the data with a bar graph and a pie graph. Which do you think better illustrates this data set? 44,814 12,363 South Korea 11,671 8,238 4,852
The U.S. health dollar is spent as indicated below. Construct two different types of graphs to represent the data.Government administration........................................9.7%Nursing home care........................................................5.5Prescription
State which type of graph (Pareto chart, time series graph, or pie graph) would most appropriately represent the data.a. Situations that distract automobile driversb. Number of persons in an automobile used for getting to and from work each dayc. Amount of money spent for textbooks and supplies for
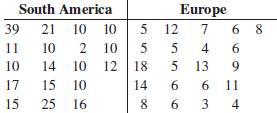
The data show the lengths (in hundreds of miles) of major rivers in South America and Europe. Construct a back-to-back stem and leaf plot, and compare the distributions. South America Europe 5 12 39 21 10 10 5 6. 11 10 2 10 6. 10 14 10 12 18 13 9. 10 17 15 14 6. 6 11 25 15 16 6. 3 4
There are 43 Major League baseball players (as of 2015) that have hit 50 or more home runs in one season. Construct a stem and leaf plot and analyze the data. 532幻科卫列
Fifty off-campus students were asked how long it takes them to get to school. The times (in minutes) are shown. Construct a dotplot and analyze the data. 幻如引四引3站口2 2=8a85は8%3 8%%42到引4m4 20B5H卫8n%8
The data show the number of years of experience the players on the Pittsburgh Steelers football team have at the beginning of the season. Draw and analyze a dot plot for the data. 3 12 6. 12 5 1 4 5 2 3 12 13 6 4 2 4 3 4 3 3 11 1 4 2 0 11 3 15 3 10 3 4.
In Pennsylvania the numbers of teacher strikes for the last 14 years are shown. Construct a dotplot for the data. Comment on the graph. 13 14 14 8. 15 18 8 3 10
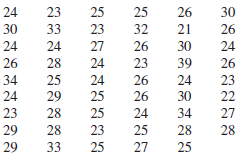
The data show the ages of the players of the Super Bowl L Denver Bronco Champs in 2016. Construct a dotplot for the data, and comment on the distribution. 26 24 23 25 25 30 33 23 32 21 26 24 24 27 26 30 24 26 28 24 23 39 26 34 25 24 26 24 23 29 25 24 26 22 23 28 25 24 34 27 29 28 23 25 28 28 25 29
The following data show where children obtain guns for committing crimes. Draw and analyze a pie graph for the data. Source Friend Family Street Gun or Pawn Shop Other Number 24 15
Draw and analyze a pie graph for the number of credit cards a person has. Number of cards Number 2 or 3 4 or more 52 68 40 40
The data show the average amount of money spent by consumers on Valentine€™s Day. Draw a time series graph for the data and comment on the trend. Year 2007 2008 2009 2010 2011 2012 2012 $120 $123 $103 $103 $110 $126 Amount
Draw a time series graph for the number (in millions) of drivers in the United States 70 or older 2012 1992 2002 20 Year 1982 Number 10 23 15
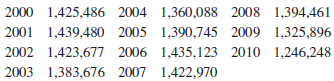
The number of all violent crimes (murder, nonnegligent homicide, manslaughter, forcible rape, robbery, and aggravated assault) in the United States for each of these years is listed below. Represent the data with a time series graph. 2000 1,425,486 2004 1,360,088 2008 1,394,461 | 2001 1,439,480
The amount spent (in billions of dollars) for ads online is shown. (The numbers for 2016 through 2019 are projected numbers.) Draw a time series graph and comment on the trend. 2014 2015 2016 2017 2018 2019 Year Amount $19.72 $31.53 $43.83 $53.29 $61.14 $69.04
Construct a Pareto chart for the sizes of Gulf coastlines in statute miles for each state.State
Construct a vertical and horizontal bar graph for the number of employees (in thousands) of a sample of the largest tech companies as of 2014.Company
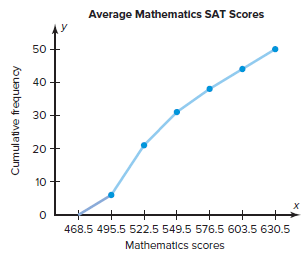
Shown is an ogive depicting the cumulative frequency of the average mathematics SAT scores by state. Use it to construct a histogram and a frequency polygon. Average Mathematics SAT Scores 50 + 40 + 30+ 20 10 х +++++ 468.5 495.5 522.5 549.5 576.5 603.5 630.5 Mathematics scores Cumulative frequency
The data show the most number of home runs hit by a batter in the American League over the last 30 seasons. Construct a frequency distribution using 5 classes. Draw a histogram, a frequency polygon, and an ogive for the date, using relative frequencies. Describe the shape of the histogram.
Construct a histogram, frequency polygon, and ogive, using relative frequencies for the data in Exercise 6 of this section.Class limits
Construct a histogram, frequency polygon, and ogive, using relative frequencies for the data in Exercise 2 of this section.Class limits
Construct a histogram, frequency polygon, and ogive, using relative frequencies for the data in Exercise 1 of this section.Class limits
The frequency distribution shows the waiting times (in minutes) for 50 patients at a walk-in medical facility. Construct a histogram, frequency polygon, and ogive for the data. Is the distribution skewed? How many patients waited longer than 30 minutes?Class limits
The frequency distribution shows the blood glucose levels (in milligrams per deciliter) for 50 patients at a medical facility. Construct a histogram, frequency polygon, and ogive for the data. Comment on the shape of the distribution. What range of glucose levels did most patients fall into?Class
The following frequency distribution shows the length (in feet) of the main spans of the longest suspension bridges in the United States. Construct a histogram, frequency polygon, and ogive for the distribution. Describe the shape of the distribution.Class limits
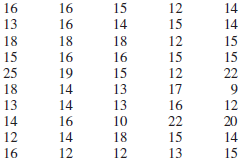
The average number of pupils per teacher in each state is shown. Construct a grouped frequency distribution with 6 classes. Draw a histogram, frequency polygon, and ogive. Analyze the distribution. 16 16 18 :으으할회으로
The number of bears killed in 2014 for 56 counties in Pennsylvania is shown in the frequency distribution. Construct a histogram, frequency polygon, and ogive for the data. Comment on the skewness of the distribution. How many counties had 75 or fewer bears killed? (The data for this exercise will
The ratio of the circumference of a circle to its diameter is known as π (pi). The value of π is an irrational number, which means that the decimal part goes on forever and there is no fixed sequence of numbers that repeats. People have found the decimal part of π to over a million places. We
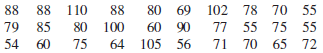
The number of stories in each of a sample of the world€™s 30 tallest buildings follows. Construct a grouped frequency distribution and a cumulative frequency distribution with 7 classes. 102 88 110 78 88 88 55 70 55 75 80 60 69 79 55 72 85 80 100 64 105 56 64 90 75 60 71 70 65 54
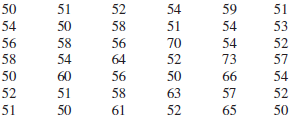
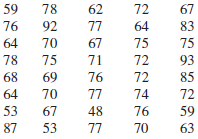
The data show the maximum wind speeds in miles per hour recorded for 40 states. Construct a frequency distribution using 7 classes. 59 78 62 72 67 76 92 77 64 83 64 70 67 75 75 78 75 71 72 93 68 69 76 72 85 72 64 70 77 74 53 67 48 76 59 87 53 77 70 63
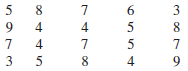
The ages of 20 dogs in a pet shelter are shown. Construct a frequency distribution using 7 classes. 3 6. 4 4 9. 4 3 4 9.
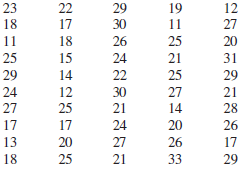
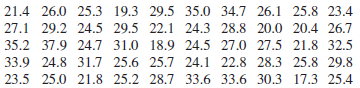
Listed by state are the percentages of the population who have completed 4 or more years of a college education. Construct a frequency distribution with 7 classes. 21.4 26.0 25.3 19.3 29.5 35.0 34.7 26.1 25.8 23.4 20.0 20.4 26.7 35.2 37.9 24.7 31.0 18.9 24.5 27.0 27.5 21.8 32.5 28.3 25.8 29.8 23.5
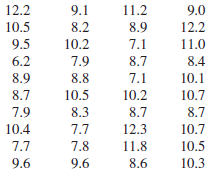
A sample of 40 large cities was selected, and the average of the wind speeds was computed for each city over one year. Construct a frequency distribution, using 7 classes. 11.2 12.2 9.1 9.0 10.5 8.2 8.9 12.2 9.5 10.2 7.1 11.0 6.2 7.9 8.7 8.4 8.9 8.8 7.1 10.1 8.7 10.5 10.2 10.7 7.9 8.3 8.7 8.7 12.3
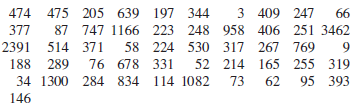
Construct a frequency distribution for the energy consumption of natural gas (in billions of Btu) by the 50 states and the District of Columbia. Use 9 classes. 474 475 205 639 197 344 3 409 247 66 87 747 1166 223 248 958 406 251 3462 58 224 530 317 267 769 76 377 2391 514 371 188 289 34 1300 284
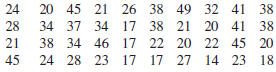
The data show the scores of the winning teams in the Rose Bowl. Construct a frequency distribution for the data using a class width of 7. 38 20 45 24 21 26 38 49 32 41 41 34 37 34 17 38 21 20 41 38 45 20 28 38 34 46 17 22 20 22 17 7 14 21 45 24 28 23 17 17 27 23 18
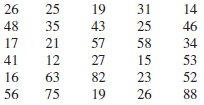
A random sample of 30 large companies in the United States shows the amount, in millions of dollars, that each company donated to charity for a specific year. Construct a frequency distribution for the data, using 9 classes. 26 25 19 31 14 48 35 43 25 46 17 21 57 58 34 41 12 27 15 53 16 63 82 23 52
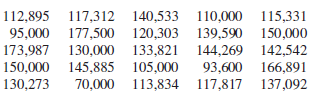
Here are the salaries (in dollars) of the governors of 25 randomly selected states. Construct a grouped frequency distribution with 6 classes. 112,895 117,312 140,533 110,000 115,331 95,000 177,500 120,303 139,590 150,000 173,987 130,000 133,821 144,269 142,542 150,000 145,885 105,000 70,000
Show frequency distributions that are incorrectly constructed. State the reasons why they are wrong.Class
Show frequency distributions that are incorrectly constructed. State the reasons why they are wrong.Class
Show frequency distributions that are incorrectly constructed. State the reasons why they are wrong.Class
Show frequency distributions that are incorrectly constructed. State the reasons why they are wrong.Class
Find the class boundaries, midpoints, and widths for each class.16.3–18.5
Find the class boundaries, midpoints, and widths for each class.16.35–18.46
Find the class boundaries, midpoints, and widths for each class.125–131
Find the class boundaries, midpoints, and widths for each class.58–62
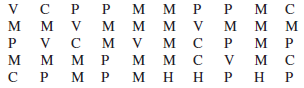
A survey was taken asking the favorite flavor of a coffee drink a person prefers. The responses were V = Vanilla, C = Caramel, M = Mocha, H = Hazelnut, and P = Plain. Construct a categorical frequency distribution for the data. Which class has the most data values and which class has the fewest
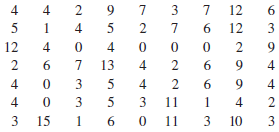
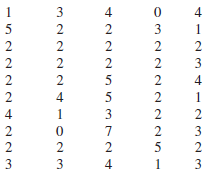
A survey was taken of 50 individuals. They were asked how many days per week they ate at a fast-food restaurant. Construct a frequency distribution using 8 classes (0€“7). Based on the distribution, how often did most people eat at a fastfood restaurant? 1 3 4 2 3 2 2 2 3 2 2 5 2 2 3 2 3
What are open-ended frequency distributions? Why are they necessary?
How many classes should frequency distributions have? Why should the class width be an odd number?
Name the three types of frequency distributions, and explain when each should be used.
List five reasons for organizing data into a frequency distribution.
Most shark attacks occur in ocean water that is 3 feet deep; therefore, it is safer to swim in deep water.Explain why the claims of these studies might be suspect.
A recent study shows that high school dropouts spend less time on the Internet than those who graduated; therefore, the Internet raises your IQ.Explain why the claims of these studies might be suspect.
Only 5% of men surveyed said that they liked “chick flicks.”Explain why the claims of these studies might be suspect.
A survey of a group of people said the thing they dislike most about winter is snow.Explain why the claims of these studies might be suspect.
In High Point County there are 672 raccoons.Explain why the claims of these studies might be suspect.
Based on a recent telephone survey, 72% of those contacted shop online.Explain why the claims of these studies might be suspect.
A study was conducted to determine if workers who had a flexible work schedule had greater job satisfaction than those workers who worked a regular nine-to-five work schedule.Identify the independent and dependent variables for each study.
In an article in the British Journal of Nutrition, two types of mice were randomly selected. One group received a thyme supplement for a specific time, while another group was used as a control group and received no supplements. The brains of the mice were then analyzed, and it was found that the
People who walk at least 3 miles a day are randomly selected, and their blood triglyceride levels are measured in order to determine if the number of miles that they walk has any influence on these levels.Identify the independent and dependent variables for each study.
A study was conducted to determine if crocodiles raised in captivity (i.e., in a zoo) grew faster than crocodiles living in the wild. Identify the explanatory variable and the outcome variable.Identify the independent and dependent variables for each study.
Three groups of gamblers were randomly selected. The first group was given $25 in casino money. The second group was given a $25 coupon for food. The third group was given nothing. After a trip to the casino, each group was surveyed and asked their opinion of their casino experience.Identify each
A sample of females were asked if their supervisors (bosses) at work were to hug them, would they consider that a form of sexual harassment?Identify each study as being either observational or experimental.
A researcher stood at a busy intersection to see if the color of the automobile that a person drives is related to running red lights.Identify each study as being either observational or experimental.
Subjects were randomly assigned to two groups, and one group was given an herb and the other group a placebo. After 6 months, the numbers of respiratory tract infections each group had were compared.Identify each study as being either observational or experimental.
Showing 3900 - 4000
of 4119
First
28
29
30
31
32
33
34
35
36
37
38
39
40
41
42
Step by Step Answers