New Semester
Started
Get
50% OFF
Study Help!
--h --m --s
Claim Now
Question Answers
Textbooks
Find textbooks, questions and answers
Oops, something went wrong!
Change your search query and then try again
S
Books
FREE
Study Help
Expert Questions
Accounting
General Management
Mathematics
Finance
Organizational Behaviour
Law
Physics
Operating System
Management Leadership
Sociology
Programming
Marketing
Database
Computer Network
Economics
Textbooks Solutions
Accounting
Managerial Accounting
Management Leadership
Cost Accounting
Statistics
Business Law
Corporate Finance
Finance
Economics
Auditing
Tutors
Online Tutors
Find a Tutor
Hire a Tutor
Become a Tutor
AI Tutor
AI Study Planner
NEW
Sell Books
Search
Search
Sign In
Register
study help
mathematics
calculus 10th edition
Calculus 10th Edition Ron Larson, Bruce H. Edwards - Solutions
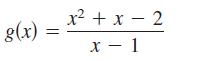
In Exercises use a graphing utility to graph the function. Explain why there is no vertical asymptote when a superficial examination of the function may indicate that there should be one. g(x) = x² + x - 2 x-1
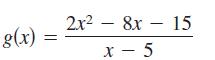
In Exercises use a graphing utility to graph the function and determine the slant asymptote of the graph. Zoom out repeatedly and describe how the graph on the display appears to change. Why does this occur? g(x) = 2x²8x 15 - x-5
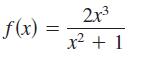
In Exercises use a graphing utility to graph the function and determine the slant asymptote of the graph. Zoom out repeatedly and describe how the graph on the display appears to change. Why does this occur? f(x) = 2x³ x² + 1
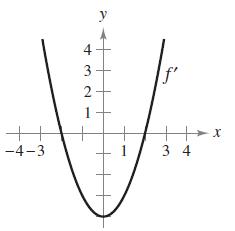
In Exercises use the graph of ƒ' to sketch a graph of ƒ and the graph of ƒ". ++ -4-3 y 432 ++ f' ++ -X 34
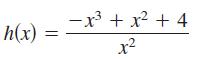
In Exercises use a graphing utility to graph the function and determine the slant asymptote of the graph. Zoom out repeatedly and describe how the graph on the display appears to change. Why does this occur? h(x) = -x³ + x² + 4 x²
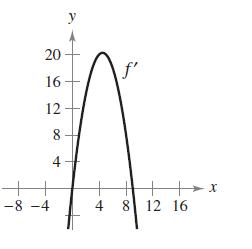
In Exercises use the graph of ƒ' to sketch a graph of ƒ and the graph of ƒ". 20 16 12 8 4 -8-4 +x + 4 8 12 16
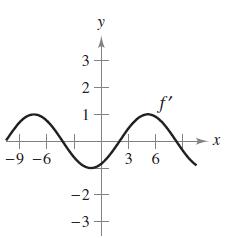
In Exercises use the graph of ƒ' to sketch a graph of ƒ and the graph of ƒ". -9 -6 3. 2 - -2 -3 y + f' 36 - X
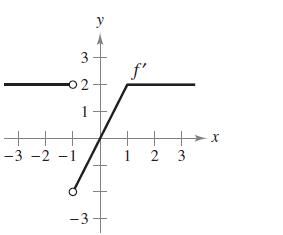
In Exercises use the graph of ƒ' to sketch a graph of ƒ and the graph of ƒ". 3 -02: 1 + -3 -2 -1 -3- f' 12 3 X
Consider the function(a) Use a computer algebra system to graph the function and use the graph to approximate the critical numbers visually. (b) Use a computer algebra system to find ƒ' and approximate the critical numbers. Are the results the same as the visual approximation in part (a)?
In Exercises create a function whose graph has the given characteristics.Vertical asymptote: x = 3 Horizontal asymptote: y = 0
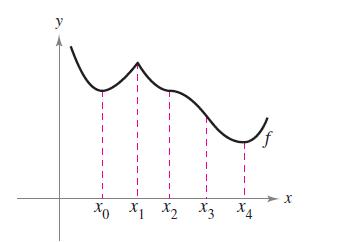
Identify the real numbers X0, X1, X2, X3, and x4 in the figure such that each of the following is true.(a) ƒ'(x) = 0(b) ƒ"(x) = 0(c) ƒ'(x) does not exist.(d) ƒ has a relative maximum.(e) ƒ has a point of inflection. y ¹x Ox 1 Jf X2 X3 X4 X
In Exercises create a function whose graph has the given characteristics.Vertical asymptote: x = -5 Horizontal asymptote: None
In Exercises create a function whose graph has the given characteristics.Vertical asymptote: x = 3 Slant asymptote: y = 3x + 2
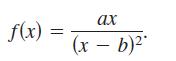
Consider the functionDetermine the effect on the graph of ƒ as a and b are changed. Consider cases where a and b are both positive or both negative, and cases where a and b have opposite signs. f(x) = ax (x - b)²*
In Exercises create a function whose graph has the given characteristics.Vertical asymptote: x = 2 Slant asymptote: y = -x
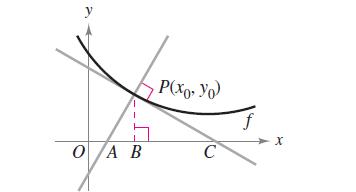
Let P(x0, y0) be an arbitrary point on the graph of ƒ such that ƒ'(x0) ≠ 0, as shown in the figure. Verifyeach statement.(a) The intercept of the tangent line is(b) The intercept of the tangent line is(c) The intercept of the normal line is(d) The intercept of the normal line is(e)(f)(g)(h) O A
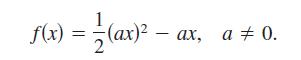
Consider the function(a) Determine the changes (if any) in the intercepts, extrema, and concavity of the graph of ƒ when a is varied.(b) In the same viewing window, use a graphing utility tograph the function for four different values of a. f(x) = -=— (ax)² - (ax)² - ax, a ‡ 0.
In Exercises the graph of the function has two slant asymptotes. Identify each slant asymptote. Then graph the function and its asymptotes. y = √√4 + 16x²2
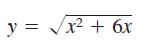
In Exercises the graph of the function has two slant asymptotes. Identify each slant asymptote. Then graph the function and its asymptotes. y = √√√√x² + 6x
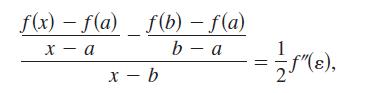
Let ƒ(x) be defined for a ≤ x ≤ b. Assuming appropriateof continuity and derivability, prove forpropertiesa < x < b thatwhere is some number between a and b. f(x)-f(a) f(b) - f(a) x - a b - a x - b 1 -==—ƒ"(e),
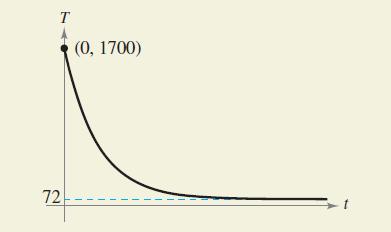
The graph shows the temperature T in degrees Fahrenheit, of molten glass seconds after it is removed from a kiln.(a) Find What does this limit represent?(b) Find What does this limit represent?(c) Will the temperature of the glass ever actually reach room temperature? Why? T (0,
In Exercises use a graphing utility to complete the table and estimate the limit as x approaches infinity. Then use a graphing utility to graph the function and estimate the limit. Finally, find the limit analytically and compare your results with the estimates. X f(x) 10⁰ 10¹ 10² 10³
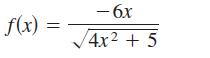
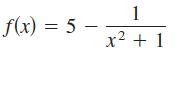
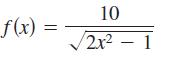
In Exercises match the function with one of the graphs [(a), (b), (c), (d), (e), or (f)] using horizontal asymptotes as an aid.(a)(b)(c)(d)(e)(f) -2 -1 3 -1 1 2 X
In Exercises match the function with one of the graphs [(a), (b), (c), (d), (e), or (f)] using horizontal asymptotes as an aid.(a)(b)(c)(d)(e)(f) -2 -1 3 -1 1 2 X
In Exercises match the function with one of the graphs [(a), (b), (c), (d), (e), or (f)] using horizontal asymptotes as an aid.(a)(b)(c)(d)(e)(f) -2 -1 3 -1 1 2 X
In Exercises match the function with one of the graphs [(a), (b), (c), (d), (e), or (f)] using horizontal asymptotes as an aid.(a)(b)(c)(d)(e)(f) -2 -1 3 -1 1 2 X
In Exercises match the function with one of the graphs [(a), (b), (c), (d), (e), or (f)] using horizontal asymptotes as an aid.(a)(b)(c)(d)(e)(f) -2 -1 3 -1 1 2 X
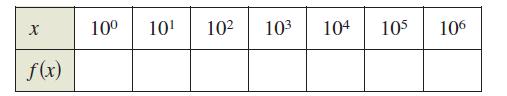
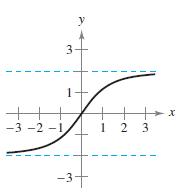
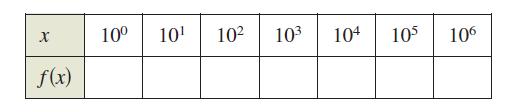
In Exercises use a graphing utility to complete the table and estimate the limit as x approaches infinity. Then use a graphing utility to graph the function and estimate the limit graphically. x f(x) 10⁰ 10¹ 10² 10³ 104 105 106
In Exercises use a graphing utility to complete the table and estimate the limit as x approaches infinity. Then use a graphing utility to graph the function and estimate the limit graphically. x f(x) 10⁰ 10¹ 10² 10³ 104 105 106
In Exercises match the function with one of the graphs [(a), (b), (c), (d), (e), or (f)] using horizontal asymptotes as an aid.(a)(b)(c)(d)(e)(f) -2 -1 3 -1 1 2 X
In Exercises use a graphing utility to complete the table and estimate the limit as x approaches infinity. Then use a graphing utility to graph the function and estimate the limit graphically. x f(x) 10⁰ 10¹ 10² 10³ 104 105 106
In Exercises use a graphing utility to complete the table and estimate the limit as x approaches infinity. Then use a graphing utility to graph the function and estimate the limit graphically. x f(x) 10⁰ 10¹ 10² 10³ 104 105 106
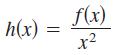
In Exercises findif possible.(a)(b)(c) lim h(x), x- .00
In Exercises use a graphing utility to complete the table and estimate the limit as x approaches infinity. Then use a graphing utility to graph the function and estimate the limit graphically. x f(x) 10⁰ 10¹ 10² 10³ 104 105 106
In Exercises findif possible.(a)(b)(c) lim h(x), x- .00
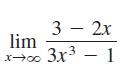
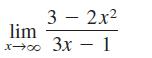
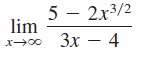
In Exercises find each limit, if possible.(a)(b)(c) 3 - 2x lim x-∞0 3x³ - 1
In Exercises use a graphing utility to complete the table and estimate the limit as x approaches infinity. Then use a graphing utility to graph the function and estimate the limit graphically. x f(x) 10⁰ 10¹ 10² 10³ 104 105 106
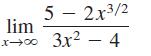
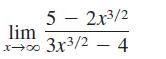
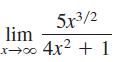
In Exercises find each limit, if possible.(a)(b)(c) lim X-8 5 - 2x³/2 3x² - 4
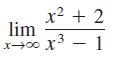
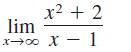
In Exercises find each limit, if possible.(a)(b)(c) lim x² + 2 I - EX ∞o←x
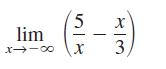
In Exercises, find the limit. lim 5 x ∞0-←x 813 X
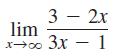
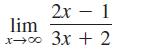
In Exercises, find the limit. lim x→∞0 2x - 1 3x + 2
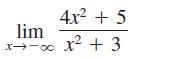
In Exercises, find the limit. lim 8 4x² +5 x2+3
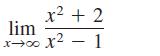
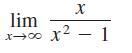
In Exercises, find the limit. X x² - 1 lim x-00x²
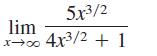
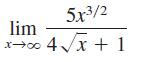
In Exercises find each limit, if possible.(a)(b)(c) 5r3/2 lim x→∞0 4x² + 1
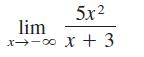
In Exercises, find the limit. lim x →∞ 5x² x + 3
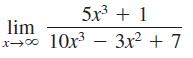
In Exercises, find the limit. lim x-∞ 5r3+1 10x³ 3x² + 7
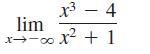
In Exercises, find the limit. x³-4 lim x-00x² + 1
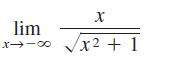
In Exercises, find the limit. lim X √x² + 1
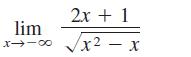
In Exercises, find the limit. lim x118 2x + 1 x2 x² - X
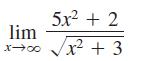
In Exercises, find the limit. lim x→∞0 5r2 + 2 x² + 3
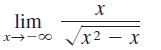
In Exercises, find the limit. lim X - 2x, X
In Exercises, find the limit. lim 007-x 1 2x - 1
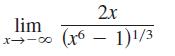
In Exercises, find the limit. 2x lim 8118 (x61)1/3
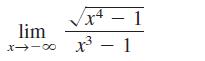
In Exercises, find the limit. lim ∞0-7x x4 - 1 x³ - 1
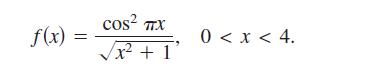
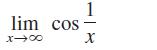
In Exercises, find the limit. lim cos 01x 1 X
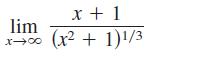
In Exercises, find the limit. lim X-8 x + 1 (x² + 1)1/3 -2
In Exercises, find the limit. lim x-∞ 1 2x + sin x
In Exercises, find the limit. X x soɔ - x - ալ
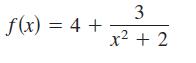
In Exercises use a graphing utility to graph the function and identify any horizontal asymptotes. f(x) = 3x x2 + 2
In Exercises use a graphing utility to graph the function and identify any horizontal asymptotes. f(x) = 川 x+1
In Exercises use a graphing utility to graph the function and identify any horizontal asymptotes. f(x) 3x + 2 x-2
In Exercises find the limit. Let x = 1/t and find the limit as t→0+.) lim x tan x-00 1 X
In Exercises use a graphing utility to graph the function and identify any horizontal asymptotes. f(x) = 9x² - 2 2x + 1
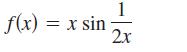
In Exercises find the limit. Let x = 1/t and find the limit as t→0+.) lim x sin x →∞0 1 X
In Exercises, find the limit. 2 lim (x - √√√x² + x)
In Exercises, find the limit. lim 8118 (3x + /9x² - x)
In Exercises, find the limit. lim (4x- x →∞ √16x² - x
In Exercises use a graphing utility to complete the table and estimate the limit as x approaches infinity. Then use a graphing utility to graph the function and estimate the limit. Finally, find the limit analytically and compare your results with the estimates. X f(x) 10⁰ 10¹ 10² 10³
In Exercises use a graphing utility to complete the table and estimate the limit as x approaches infinity. Then use a graphing utility to graph the function and estimate the limit. Finally, find the limit analytically and compare your results with the estimates. X f(x) 10⁰ 10¹ 10² 10³
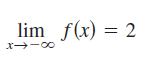
In Exercises describe in your own words what the statement means. lim f(x) = 2 8118
In Exercises use a graphing utility to complete the table and estimate the limit as x approaches infinity. Then use a graphing utility to graph the function and estimate the limit. Finally, find the limit analytically and compare your results with the estimates. X f(x) 10⁰ 10¹ 10² 10³
Is it possible to sketch a graph of a function that satisfies the conditions of Exercise 55 and has no points of inflection? Explain.Data from in Exercise 55Sketch a graph of a differentiable function f that satisfies the following conditions and has x = 2 as its only critical number. f'(x) <
In Exercises describe in your own words what the statement means. lim f(x) = 4 X10
The graph of a function ƒ is shown below.(a) Sketch ƒ'.(b) Use the graphs to estimate(c) Explain the answers you gave in part (b). -4 -2 6 4 2 -2 y f ++ +xx 2 4
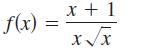
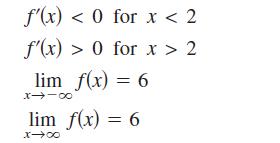
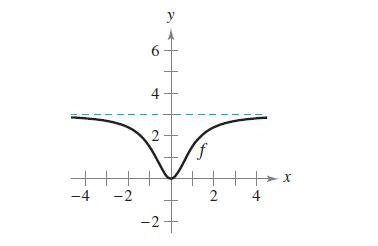
Sketch a graph of a differentiable function f that satisfies the following conditions and has x = 2 as its only critical number. f'(x) < 0 for x < 2 f'(x) > 0 for x > 2 lim f(x) = 6 x118 lim f(x) = 6 X→∞
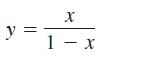
In Exercises sketch the graph of the equation using extrema, intercepts, symmetry, and asymptotes. Then use a graphing utility to verify your result. y X 1 - x
If is a continuous function such that find, if possible,for each specified condition.(a) The graph of ƒ is symmetric with respect to the y-axis.(b) The graph of ƒ is symmetric with respect to the origin. lim f(x) = 5, X-∞
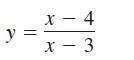
In Exercises sketch the graph of the equation using extrema, intercepts, symmetry, and asymptotes. Then use a graphing utility to verify your result. y = x - 4 x - 3
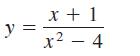
In Exercises sketch the graph of the equation using extrema, intercepts, symmetry, and asymptotes. Then use a graphing utility to verify your result. y = x + 1 +2 x² - 4
In Exercises sketch the graph of the equation using extrema, intercepts, symmetry, and asymptotes. Then use a graphing utility to verify your result. 2 xy² = 9
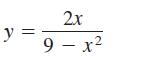
In Exercises sketch the graph of the equation using extrema, intercepts, symmetry, and asymptotes. Then use a graphing utility to verify your result. У || 2x 9 - x²
In Exercises sketch the graph of the equation using extrema, intercepts, symmetry, and asymptotes. Then use a graphing utility to verify your result. x²y = 9
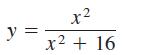
In Exercises sketch the graph of the equation using extrema, intercepts, symmetry, and asymptotes. Then use a graphing utility to verify your result. y || x² x² + 16 -2
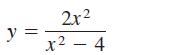
In Exercises sketch the graph of the equation using extrema, intercepts, symmetry, and asymptotes. Then use a graphing utility to verify your result. y = 2x² x² - 4
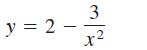
In Exercises sketch the graph of the equation using extrema, intercepts, symmetry, and asymptotes. Then use a graphing utility to verify your result. y = 2 · 3 X 2
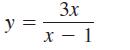
In Exercises sketch the graph of the equation using extrema, intercepts, symmetry, and asymptotes. Then use a graphing utility to verify your result. y 3x x-1
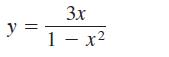
In Exercises sketch the graph of the equation using extrema, intercepts, symmetry, and asymptotes. Then use a graphing utility to verify your result. У || 3x 1 - x²
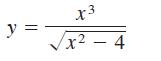
In Exercises sketch the graph of the equation using extrema, intercepts, symmetry, and asymptotes. Then use a graphing utility to verify your result. y = x 3 √√x² - 4
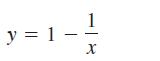
In Exercises sketch the graph of the equation using extrema, intercepts, symmetry, and asymptotes. Then use a graphing utility to verify your result. y = 1 _ 1 - X
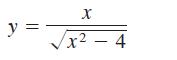
In Exercises sketch the graph of the equation using extrema, intercepts, symmetry, and asymptotes. Then use a graphing utility to verify your result. y = X x² - 4
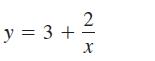
In Exercises sketch the graph of the equation using extrema, intercepts, symmetry, and asymptotes. Then use a graphing utility to verify your result. y = 3 + 2 X
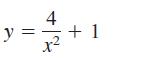
In Exercises sketch the graph of the equation using extrema, intercepts, symmetry, and asymptotes. Then use a graphing utility to verify your result. y || 4 치 + 1
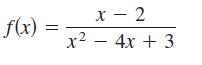
In Exercises use a computer algebra system to analyze the graph of the function. Label any extrema and/or asymptotes that exist. f(x): = x - 2 x² - 4x + 3
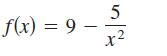
In Exercises use a computer algebra system to analyze the graph of the function. Label any extrema and/or asymptotes that exist. f(x) = 9. 5 x²
In Exercises use a computer algebra system to analyze the graph of the function. Label any extrema and/or asymptotes that exist. f(x) = 3x 4x² + 1
In Exercises use a computer algebra system to analyze the graph of the function. Label any extrema and/or asymptotes that exist. f(x) || 1 x²x2
In Exercises use a computer algebra system to analyze the graph of the function. Label any extrema and/or asymptotes that exist. f(x) x + 1 x² + x + 1
In Exercises use a computer algebra system to analyze the graph of the function. Label any extrema and/or asymptotes that exist. f(x) = 2 sin 2x X
In Exercises use a computer algebra system to analyze the graph of the function. Label any extrema and/or asymptotes that exist. g(x) = 2x √3x² + 1
In Exercises use a computer algebra system to analyze the graph of the function. Label any extrema and/or asymptotes that exist. g(x) = sin( X x-2, x > 3
Showing 8400 - 8500
of 9867
First
78
79
80
81
82
83
84
85
86
87
88
89
90
91
92
Last
Step by Step Answers