New Semester
Started
Get
50% OFF
Study Help!
--h --m --s
Claim Now
Question Answers
Textbooks
Find textbooks, questions and answers
Oops, something went wrong!
Change your search query and then try again
S
Books
FREE
Study Help
Expert Questions
Accounting
General Management
Mathematics
Finance
Organizational Behaviour
Law
Physics
Operating System
Management Leadership
Sociology
Programming
Marketing
Database
Computer Network
Economics
Textbooks Solutions
Accounting
Managerial Accounting
Management Leadership
Cost Accounting
Statistics
Business Law
Corporate Finance
Finance
Economics
Auditing
Tutors
Online Tutors
Find a Tutor
Hire a Tutor
Become a Tutor
AI Tutor
AI Study Planner
NEW
Sell Books
Search
Search
Sign In
Register
study help
mathematics
calculus early transcendentals 9th
Calculus Early Transcendentals 9th Edition James Stewart, Daniel K. Clegg, Saleem Watson, Lothar Redlin - Solutions
Find the limit. Use l’Hospital’s Rule where appropriate. If there is a more elementary method, consider using it. If l’Hospital’s Rule doesn’t apply, explain why. lim (e* + 10x)¹/* x →∞
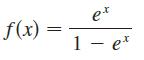
(a) Find the vertical and horizontal asymptotes.(b) Find the intervals of increase or decrease.(c) Find the local maximum and minimum values.(d) Find the intervals of concavity and the inflection points.(e) Use the information from parts (a) – (d) to sketch the graph of f. f(x) ex 1 - et
Find the limit. Use l’Hospital’s Rule where appropriate. If there is a more elementary method, consider using it. If l’Hospital’s Rule doesn’t apply, explain why. lim xe x→∞
Let a and b be positive numbers. Find the length of the shortest line segment that is cut off by the first quadrant and passes through the point (a, b).
(a) Find the vertical and horizontal asymptotes.(b) Find the intervals of increase or decrease.(c) Find the local maximum and minimum values.(d) Find the intervals of concavity and the inflection points.(e) Use the information from parts (a) – (d) to sketch the graph of f. u x - x - x = (x)ƒ
Find the absolute maximum and absolute minimum values of f on the given interval.f(t) = 2cos t + sin 2t, [0, π/2]
(a) Graph f(x) = 2x – 3√x .(b) Starting with the graph in part (a), sketch a rough graph of the antiderivative F that satisfies F(0) = 1.(c) Use the rules of this section to find an expression for F(x).(d) Graph F using the expression in part (c). Compare with your sketch in part (b).
Find the limit. Use l’Hospital’s Rule where appropriate. If there is a more elementary method, consider using it. If l’Hospital’s Rule doesn’t apply, explain why. lim (4x + 1) cotx x-0+
(a) Find the vertical and horizontal asymptotes.(b) Find the intervals of increase or decrease.(c) Find the local maximum and minimum values.(d) Find the intervals of concavity and the inflection points.(e) Use the information from parts (a) – (d) to sketch the graph of f.f(x) = e–x2
Find the limit. Use l’Hospital’s Rule where appropriate. If there is a more elementary method, consider using it. If l’Hospital’s Rule doesn’t apply, explain why. lim (1 cos x) sin x x→0+
Find the absolute maximum and absolute minimum values of f on the given interval.f(x) = xex/2, [−3, 1]
Find an equation of the slant asymptote. Do not sketch the curve. y = I + ₂x x + 1
A particle is moving with the given data. Find the position of the particle.v(t) = 2 cos t + 4 sin t, s(0) = 3
Find the absolute maximum and absolute minimum values of f on the given interval.f(x) = ln(x2 + x + 1), [−1, 1]
(a) Find the vertical and horizontal asymptotes.(b) Find the intervals of increase or decrease.(c) Find the local maximum and minimum values.(d) Find the intervals of concavity and the inflection points.(e) Use the information from parts (a) – (d) to sketch the graph of f.f(x) = earctan x
Find the absolute maximum and absolute minimum values of f on the given interval.f(x) = x − 2 tan-1x, [0, 4]
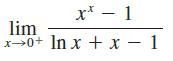
Find the limit. Use l’Hospital’s Rule where appropriate. If there is a more elementary method, consider using it. If l’Hospital’s Rule doesn’t apply, explain why. xx - 1 lim x0+ ln x + x - 1
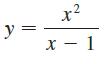
Use the guidelines of this section to sketch the curve. In guideline D, find an equation of the slant asymptote. y x² 2 x - 1
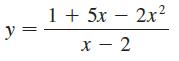
Use the guidelines of this section to sketch the curve. In guideline D, find an equation of the slant asymptote. y = 1 + 5x - 2x² x-2
A particle is moving with the given data. Find the position of the particle.a(t) = sin t – cos t, s(0) = 0, s(π) = 6
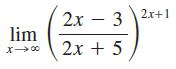
Find the limit. Use l’Hospital’s Rule where appropriate. If there is a more elementary method, consider using it. If l’Hospital’s Rule doesn’t apply, explain why. lim x →∞ 2x - 3 2x + 5 2x+1
Find f.f'(t) = 2t – 3 sin t, f(0) = 5
(a) Use a graph to estimate the absolute maximum and minimum values of the function to two decimal places.(b) Use calculus to find the exact maximum and minimum values.f(x) = ex + e−2x, 0 ≤ x ≤ 1
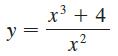
Use the guidelines of this section to sketch the curve. In guideline D, find an equation of the slant asymptote. y x³ + 4 .3 X x² 2
(a) Use a graph of f to give a rough estimate of the intervals of concavity and the coordinates of the points of inflection.(b) Use a graph of f" to give better estimates.f(x) = sin 2x + sin 4x, 0 ≤ x ≤ π
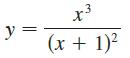
Use the guidelines of this section to sketch the curve. In guideline D, find an equation of the slant asymptote. y= X3 (x + 1)2
(a) Use a graph to estimate the absolute maximum and minimum values of the function to two decimal places.(b) Use calculus to find the exact maximum and minimum values.f(x) = x − 2 cos x, −2 ≤ x ≤ 0
(a) Use a graph of f to give a rough estimate of the intervals of concavity and the coordinates of the points of inflection.(b) Use a graph of f" to give better estimates.f(x) = (x – 1)2 (x + 1)3
Find f.f"(x) = 5x3 + 6x2 + 2, f(0) = 3, f(1) = –2
A particle is moving along a straight line with the given data. Find the position of the particle.ν(t) = 2t – 1/(1 + t2), s(0) = 1
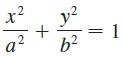
Consider the tangent line to the ellipseat a point (p, q) in the first quadrant.(a) Show that the tangent line has x-intercept a2/p and y-intercept b2/q.(b) Show that the portion of the tangent line cut off by the coordinate axes has minimum length a + b.(c) Show that the triangle formed by the
Use the guidelines of this section to sketch the curve. In guideline D, find an equation of the slant asymptote.y = 1 – x + e1+x/3
A particle is moving along a straight line with the given data. Find the position of the particle.a(t) = sin t + 3 cos t, s(0) = 0, ν(0) = 2
After an antibiotic tablet is taken, the concentration of the antibiotic in the bloodstream is modeled by the functionC(t) = 8(e-0.4t − e20.6t)where the time t is measured in hours and C is measured in μg/mL. What is the maximum concentration of the antibiotic during the first 12 hours?
(a) If f(x) = 0.1ex + sin x, –4 ≤ x ≤ 4, use a graph of f to sketch a rough graph of the antiderivative F of f that satisfies F(0) = 0.(b) Find an expression for F(x).(c) Graph F using the expression in part (b). Compare with your sketch in part (a).
Prove thatfor any positive integer n. This shows that the exponential function approaches infinity faster than any power of x. lim ex uX x-x 8
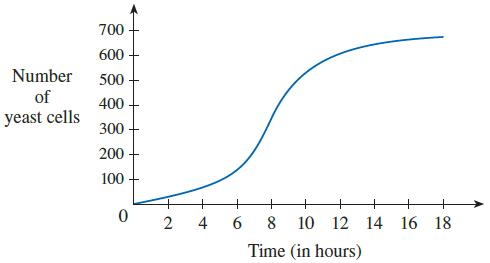
A graph of a population of yeast cells in a new laboratory culture as a function of time is shown.(a) Describe how the rate of population increase varies.(b) When is this rate highest?(c) On what intervals is the population function concave upward or downward?(d) Estimate the coordinates of the
Between 0°C and 30°C, the volume V (in cubic centimeters) of 1 kg of water at a temperature T is given approximately by the formulaV = 999.87 − 0.06426T + 0.0085043T2 − 0.0000679T3Find the temperature at which water has its maximum density.
Prove thatfor any number p > 0. This shows that the logarithmic function approaches infinity more slowly than any power of x. lim In x dx xx 0:
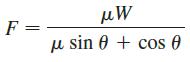
An object with weight W is dragged along a horizontal plane by a force acting along a rope attached to the object. If the rope makes an angle θ with the plane, then the magnitude of the force iswhere μ is a positive constant called the coefficient of friction and where 0 ≤ θ ≤ π/2. Show
Let f(x) = (x3 + 1)/x. Show thatThis shows that the graph of f approaches the graph of y = x2, and we say that the curve y = f(x) is asymptotic to the parabola y = x2. Use this fact to help sketch the graph of f . lim_ [ƒ(x) − x²] = 0 ∞0=
Let f(t) be the temperature at time t where you live and suppose that at time t = 3 you feel uncomfortably hot. How do you feel about the given data in each case?(a) f'(3) = 2, f"(3) = 4(b) f'(3) = 2, f"(3) = 24(c) f'(3) = –2, f"(3) = 4(d) f'(3) = −2, f"(3) = 24
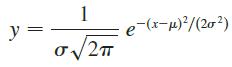
Normal Density Functions The family of bell-shaped curvesoccurs in probability and statistics, where it is called the normal density function. The constant μ is called the mean and the positive constant σ is called the standard deviation. For simplicity, let’s scale the function so as to remove
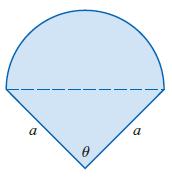
The figure shows an isosceles triangle with equal sides of length a surmounted by a semicircle. What should the measure of angle θ be in order to maximize the total area? D I D
Find functions f and g wherea.b. lim f(x) = x-0 lim g(x) x→0 00
Evaluate the integral by making the given substitution. cos 2x dx, u = 2x
Determine whether the statement is true or false. If it is true, explain why. If it is false, explain why or give an example that disproves the statement.If f and g are continuous on [a, b], then xp x)6 ³] + xp (x)ƒ ƒ = xp [(x)6 + (x)ƒ] «f
Evaluate the integral by making the given substitution. [ xe¯x² dx, u = −x²
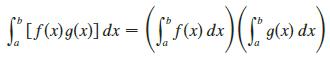
Determine whether the statement is true or false. If it is true, explain why. If it is false, explain why or give an example that disproves the statement.If f and g are continuous on [a, b], then f* (F(x) g(x) dx = (f*F(x) dx ) ( 1*9(x) dx)
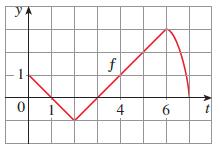
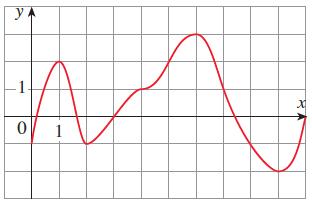
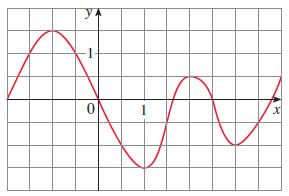
Let g(x) = ∫x0 f (t) dt, where f is the function whose graph is shown.(a) Evaluate g(x) for x = 0, 1, 2, 3, 4, 5, and 6.(b) Estimate g(7).(c) Where does g have a maximum value? Where does it have a minimum value?(d) Sketch a rough graph of g. 0 1 f 4 6
Iff(x) = cos x 0 ≤ x ≤ 3π/4evaluate the Riemann sum with n = 6, taking the sample points to be left endpoints. (Give your answer correct to six decimal places.) What does the Riemann sum represent? Illustrate with a diagram.
Evaluate the integral by making the given substitution. √x²√x³ + 1dx, u = x³ + 1
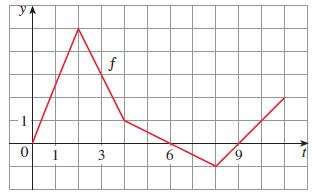
If ∫40 e(x–2)4 dx = k, find the value of ∫40 xe(x–2)4 dx.
Determine whether the statement is true or false. If it is true, explain why. If it is false, explain why or give an example that disproves the statement.If f is continuous on [a, b], then 5° 5f (x) dx = 5 fº f(x) dx Ja
Evaluate the integral by making the given substitution. sin²0 cos 0 de, cos 0 de, u = sin 0
Determine whether the statement is true or false. If it is true, explain why. If it is false, explain why or give an example that disproves the statement.If f is continuous on [a, b], then xf(x) dx = xf(x) dx
Let g(x) = ∫x0 f(t) dt, where f is the function whose graph is shown.(a) Use Part 1 of the Fundamental Theorem of Calculus to graph g'.(b) Find g(3), g'(3), and g"(3).(c) Does t have a local maximum, a local minimum, or neither at x = 6?(d) Does t have a local maximum, a local minimum, or neither
(a) Evaluate the Riemann sum for f(x) = 1/x, 1 ≤ x ≤ 2, with four terms, taking the sample points to be right endpoints. (Give your answer correct to six decimal places.) Explain what the Riemann sum represents with the aid of a sketch.(b) Repeat part (a) with midpoints as the sample points.
Evaluate the integral by making the given substitution. x³ x² - 5 dx, u = x¹ - 5
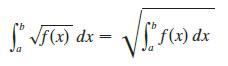
Determine whether the statement is true or false. If it is true, explain why. If it is false, explain why or give an example that disproves the statement.If f is continuous on [a, b] and f(x) ≥ 0, then S√f(x) dx =√√S f(x) dx
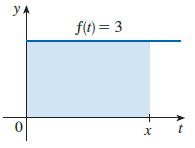
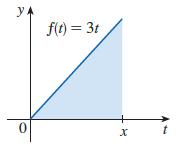
The graph of a function f is shown. Let t be the function that represents the area under the graph of f between 0 and x.(a) Use geometry to find a formula for g(x).(b) Verify that t is an antiderivative of f and explain how this confirms Part 1 of the Fundamental Theorem of Calculus for the
The graph of a function f is given. Estimate ∫100 f(x) dx using five subintervals with(a) Right endpoints(b) Left endpoints(c) Midpoints. y FA 1 0 x
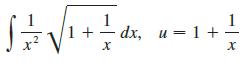
Evaluate the integral by making the given substitution. √ ² √ √²+ = = a X 1 + dx, u = 1 + · X
If f(x) = ∫x0 x2 sin(t2) dt, find f'(x).
Determine whether the statement is true or false. If it is true, explain why. If it is false, explain why or give an example that disproves the statement. fr f(x) dx = f'ƒ(z) dz
The graph of a function f is shown. Let t be the function that represents the area under the graph of f between 0 and x.(a) Use geometry to find a formula for g(x).(b) Verify that t is an antiderivative of f and explain how this confirms Part 1 of the Fundamental Theorem of Calculus for the
(a) Graph the functionf(x) = ex–x2 0 ≤ x ≤ 2(b) Estimate the area under the graph of f using four approximating rectangles and taking the sample points to be (i) right endpoints and (ii) midpoints. In each case sketch the curve and the rectangles.(c) Improve your estimates in
The graph of a function g is shown. Estimate ∫4-2g(x) d(x) with six subintervals using(a) Right endpoints(b) Left endpoints(c) Midpoints. YA 0 1 X
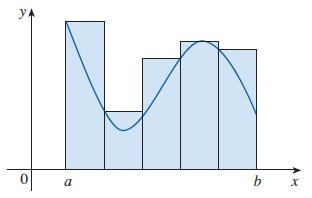
Evaluate the integral by making the given substitution. cos √t √t -dt, u = √t
Determine whether the statement is true or false. If it is true, explain why. If it is false, explain why or give an example that disproves the statement.If f' is continuous on [1, 3], then f", ƒ'(v) dv — ƒ(3) — ƒ(1).
Sketch the area represented by g(x). Then find g'(x) in two ways:(a) By using Part 1 of the Fundamental Theorem(b) By evaluating the integral using Part 2 and then differentiating. g(x) = f* 1² dt JI
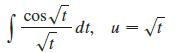
Evaluate the upper and lower sums for f(x) = 6 – x2, –2 ≤ x ≤ 2, with n = 2, 4, and 8. Illustrate with diagrams like Figure 14.(a) Lower sums(b) Upper sums(c) Upper and lower sums у 0 a b X
Sketch the area represented by g(x). Then find g'(x) in two ways:(a) By using Part 1 of the Fundamental Theorem(b) By evaluating the integral using Part 2 and then differentiating. g(x) = f* (2 + sin t) dt
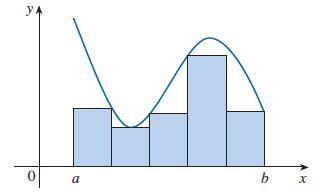
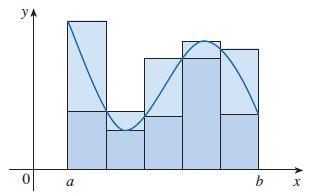
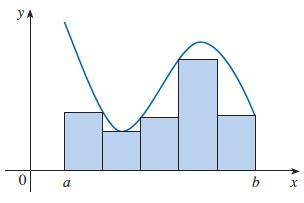
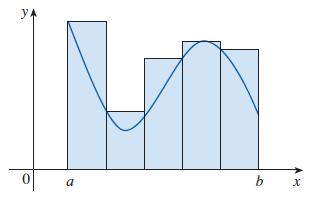
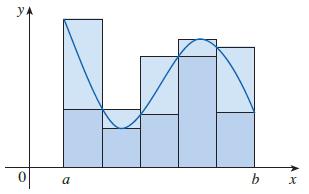
Evaluate the upper and lower sums forf(x) = 1 + cos(x/2) 2π ≤ x ≤ πwith n = 3, 4, and 6. Illustrate with diagrams like Figure 14.(a) Lower sums(b) Upper sums(c) Upper and lower sums y 0 a b X
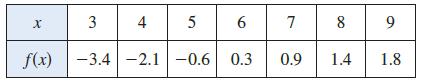
The table gives the values of a function obtained from an experiment. Use them to estimate ∫93f(x) d(x) using three equal subintervals with(a) Right endpoints(b) Left endpoints(c) Midpoints.If the function is known to be an increasing function, can you say whether your estimates are less than or
Determine whether the statement is true or false. If it is true, explain why. If it is false, explain why or give an example that disproves the statement. Ɔ + ç[(x)ƒ]{ = xp ₂[(x)ƒ] (x) f
Evaluate the indefinite integral. √x√1-x² dx
Use Part 1 of the Fundamental Theorem of Calculus to find the derivative of the function. ¹P 1 + 1^ S = (x)6
Use the Midpoint Rule with n = 4 to approximate the integral. xp x 8.
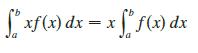
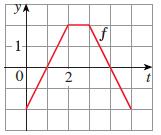
The graph of f consists of the three line segments shown. If g(x) = ∫x0 f(t) dt, find g(4) and g'(4). YA 1 0 2 f
Evaluate the indefinite integral. (5 - 3x)¹⁰ dx
Use Part 1 of the Fundamental Theorem of Calculus to find the derivative of the function. ¹P (21 + 1) = (x)6
Determine whether the statement is true or false. If it is true, explain why. If it is false, explain why or give an example that disproves the statement.If f and g are differentiable and f(x) ≥ g(x) for a < x < b, then f'(x) ≥ g'(x) for a < x < b.
The table shows speedometer readings at 10-second intervals during a 1-minute period for a car racing at the Daytona International Speedway in Florida.(a) Estimate the distance the race car traveled during this time period using the velocities at the beginning of the time intervals.(b) Give another
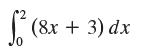
Use the Midpoint Rule with n = 4 to approximate the integral. ² (8x + 3) dx
Evaluate the indefinite integral. 3 St³e-¹ dt
Use Part 1 of the Fundamental Theorem of Calculus to find the derivative of the function. = (m) 6 MR. sin(1 + 1³) dt
Determine whether the statement is true or false. If it is true, explain why. If it is false, explain why or give an example that disproves the statement.If f and t are continuous and f(x) ≥ g(x) for a ≤ x ≤ b, then xp (x)b ²f = xp (x)ƒ ²
Evaluate the integral, if it exists. Sº, (x² + 5x) dx -1
(a) Evaluate ∫n0 [[x]] dx, where n is a positive integer.(b) Evaluate ∫ba [[x]] dx, where a and b are real numbers with 0 ≤ a < b.
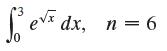
Use the Midpoint Rule with the given value of n to approximate the integral. Round the answer to four decimal places. Sevx dx, dx, n = 6
Evaluate the indefinite integral. sint √1 + cost dt
Determine whether the statement is true or false. If it is true, explain why. If it is false, explain why or give an example that disproves the statement.If ν(t) is the velocity at time t of a particle moving along a line, then ∫ba |ν(t) dt is the distance traveled during the time period a ≤
Determine whether the statement is true or false. If it is true, explain why. If it is false, explain why or give an example that disproves the statement. f³₁ (ax² + bx + c) dx = 25³ (ax² + c) dx
Use Part 1 of the Fundamental Theorem of Calculus to find the derivative of the function. h(u) √t Jo t + 1 +²²9 - - dt
Evaluate the integral, if it exists. f (x² − 8x + 7) dx Jo
Evaluate the indefinite integral. sin (nt/3) dt
Use Part 1 of the Fundamental Theorem of Calculus to find the derivative of the function. F(x)=√1 + sect dt
Determine whether the statement is true or false. If it is true, explain why. If it is false, explain why or give an example that disproves the statement.All continuous functions have derivatives.
Evaluate the integral, if it exists. f' (1-x²) dx Jo
Showing 700 - 800
of 4932
1
2
3
4
5
6
7
8
9
10
11
12
13
14
15
Last
Step by Step Answers