New Semester
Started
Get
50% OFF
Study Help!
--h --m --s
Claim Now
Question Answers
Textbooks
Find textbooks, questions and answers
Oops, something went wrong!
Change your search query and then try again
S
Books
FREE
Study Help
Expert Questions
Accounting
General Management
Mathematics
Finance
Organizational Behaviour
Law
Physics
Operating System
Management Leadership
Sociology
Programming
Marketing
Database
Computer Network
Economics
Textbooks Solutions
Accounting
Managerial Accounting
Management Leadership
Cost Accounting
Statistics
Business Law
Corporate Finance
Finance
Economics
Auditing
Tutors
Online Tutors
Find a Tutor
Hire a Tutor
Become a Tutor
AI Tutor
AI Study Planner
NEW
Sell Books
Search
Search
Sign In
Register
study help
mathematics
calculus with applications
Calculus With Applications 12th Edition Margaret L. Lial - Solutions
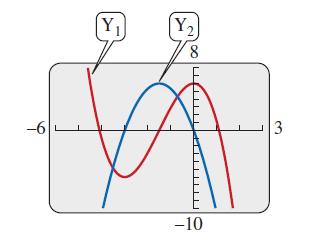
Each graphing calculator window shows the graph of a function f(x) and its derivative function f′(x). Decide which is the graph of the function and which is the graph of the derivative. -6 Y₁ (Y₂) 8 -10 3
Determine whether each of the following statements is true or false, and explain why.The derivative is a function.
Determine whether each of the following statements is true or false, and explain why.The slope of the tangent line gives the average rate of change.
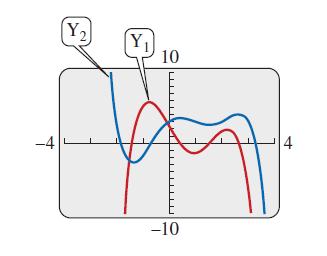
Each graphing calculator window shows the graph of a function f(x) and its derivative function f′(x). Decide which is the graph of the function and which is the graph of the derivative. -4 Y₂ Y₁ 10 -10 4
Determine whether each of the following statements is true or false, and explain why.The derivative of a function exists wherever the function is continuous.
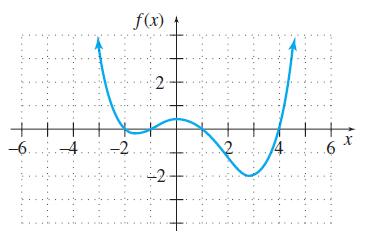
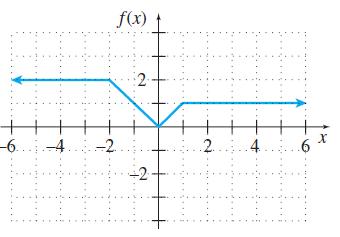
Sketch the graph of the derivative for each function shown. -6.. f(x) 4 -2. 2 A 12 6 X
Is a derivative always a limit? Is a limit always a derivative? Explain.
Is every continuous function differentiable? Is every differentiable function continuous? Explain.
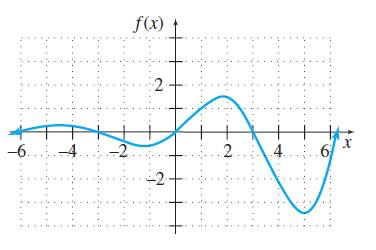
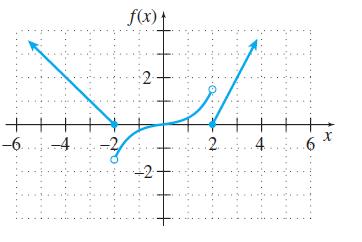
Sketch the graph of the derivative for each function shown. -6. -4 -2 f(x) -2 2 4. 19 X
Give two applications of the derivative f'(x) = lim h→0 f(x +h)-f(x) h
Describe how to tell when a function is discontinuous at the real number x = a.
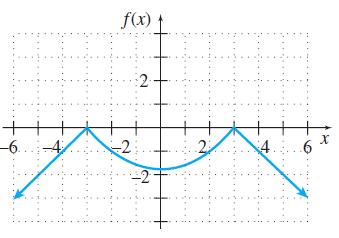
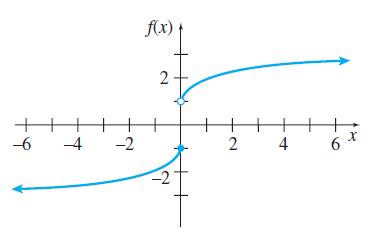
Sketch the graph of the derivative for each function shown. f(x) -6-4. -2. 2 ନ 2 4 6 X
Sketch the graph of the derivative for each function shown. -6-4. अ f(x) 1 2 4 6 X
Decide whether the limits in Exercises exist. If a limit exists, find its value.(a)(b)(c)(d) ƒ(-3) lim f(x) x-3
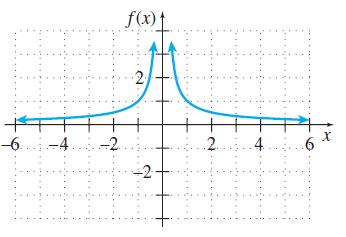
Sketch the graph of the derivative for each function shown. -6-4 f(x) + -2 -2 2; 4.6 X
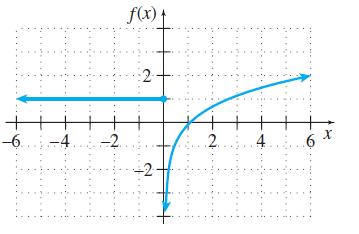
Sketch the graph of the derivative for each function shown. -6 -2 f(x) + 2 ..2. 6 X
Decide whether the limits in Exercises exist. If a limit exists, find its value.(a)(b)(c)(d) g(-1) lim_g(x) x-1
Decide whether the limits in Exercises exist. If a limit exists, find its value.(a)(b)(c)(d) ƒ(4) lim f(x) x-4
Decide whether the limits in Exercises exist. If a limit exists, find its value.(a)(b)(c)(d) h(2) lim h(x) x-2
Sketch the graph of the derivative for each function shown. f(x) ↑ -6 -4 -2. 2 4 6 X
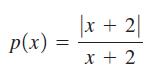
In Exercises, find all values x = a where the function is discontinuous. For each value of x, give the limit of the function as x approaches a. Be sure to note when the limit doesn’t exist. p(x) = |x + 21 x + 2
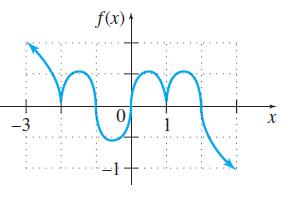
Sketch the graph of the derivative for each function shown. f(x). hm 1 -14 -3 X
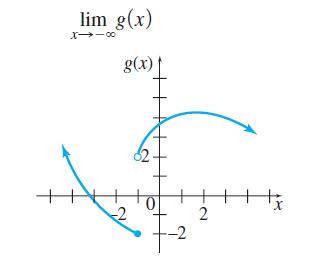
Decide whether the limits in Exercises exist. If a limit exists, find its value. lim_ g(x) X→-∞ g(x) -2 -2 2 X
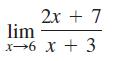
Decide whether the limits in Exercises exist. If a limit exists, find its value. 2x + 7 lim x 6 x + 3
Sketch the graph of the derivative for each function shown. f(x) + -6 -4 -2.. 2 2 4 6 X
Sketch the graph of the derivative for each function shown. 2 f(x) 2 0 the X
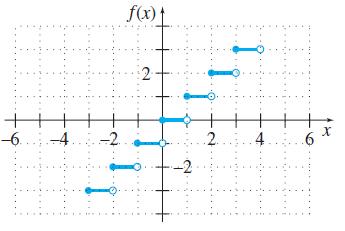
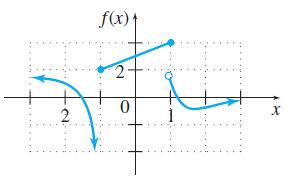
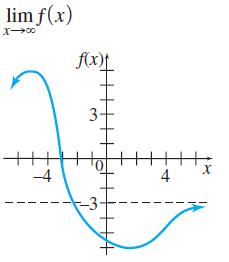
Decide whether the limits in Exercises exist. If a limit exists, find its value. lim f(x) X→∞⁰ -4 f(x) 3- دیا -3- 4 X
Decide whether the limits in Exercises exist. If a limit exists, find its value. 2x lim x 3 x + 5 3
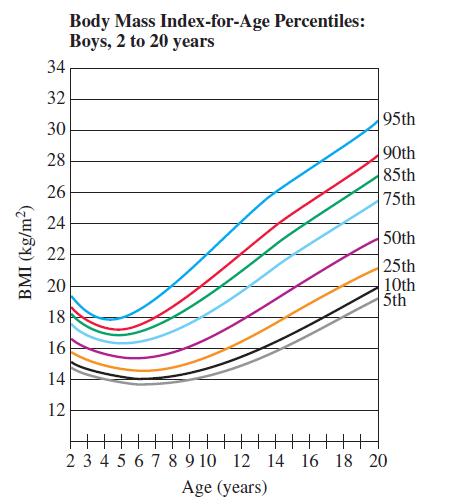
The graph at the top of the next column shows how the body mass index-for-age percentile for boys varies from the age of 2 to 20 years.(a) Sketch a graph of the rate of change of the 95th percentile as a function of age.(b) Sketch a graph of the rate of change of the 50th percentile as a function
Decide whether the limits in Exercises exist. If a limit exists, find its value. lim X-2 x² + 3x - 10 x - 2
Decide whether the limits in Exercises exist. If a limit exists, find its value. x² - 16 4 lim X-4 X -
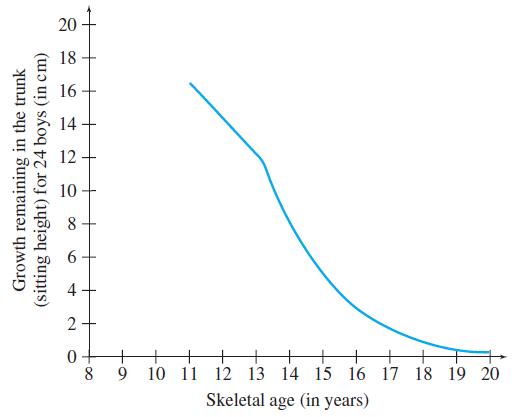
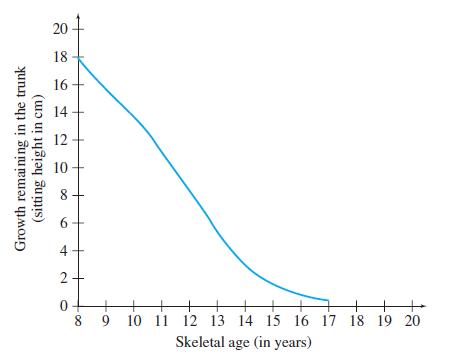
The growth remaining in sitting height at consecutive skeletal age levels is indicated below for boys. Sketch a graph showing the rate of change of growth remaining for the indicated years. Use the graph and your sketch to estimate the remaining growth and the rate of change of remaining growth for
Decide whether the limits in Exercises exist. If a limit exists, find its value. √x - 3 lim X9 X9
Decide whether the limits in Exercises exist. If a limit exists, find its value. lim X-4 2x² + 3x - 20 - x + 4
Decide whether the limits in Exercises exist. If a limit exists, find its value. lim x-3 →3 3x² 2x - 21 x - 3
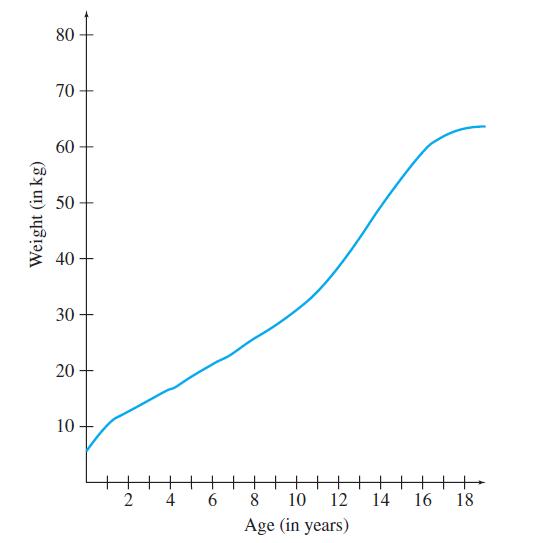
The graph at the top of the next column shows the typical weight (in kilograms) of an English boy for his first 18 years of life.(a) Sketch the graph of the rate of change of weight with respect to time.(b) Based on your graph from part (a), when does the average English boy grow the slowest? Does
Decide whether the limits in Exercises exist. If a limit exists, find its value. √x - 4 lim x 16 x 16 -
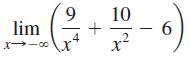
Decide whether the limits in Exercises exist. If a limit exists, find its value. lim 1118 3 m 100 8 + 3 X 6 2 x²
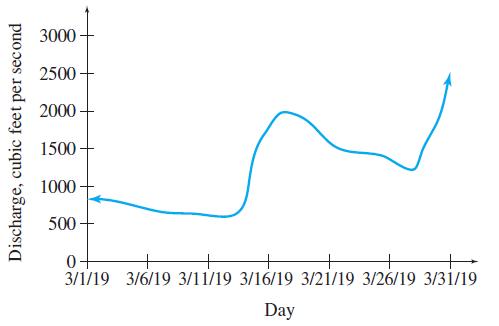
The graph below shows the discharge of water (in cubic feet per second) from the Otter Creek in Middlebury, VT, during March 2019. Sketch a graph of the rate of change in the discharge with respect to time. Discharge, cubic feet per second 3000 2500 2000 1500 1000 500 0- 3/1/19 3/6/19 3/11/19
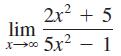
Decide whether the limits in Exercises exist. If a limit exists, find its value. lim X→∞0 2x² + 5 − 1 5x2
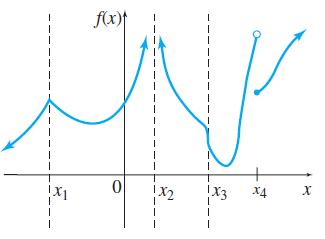
Identify the x-values where f is discontinuous. f(x) pv 3 | 0 | 1X3 x4 X
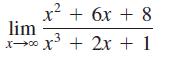
Decide whether the limits in Exercises exist. If a limit exists, find its value. X x² + 6x + 8 lim .3 x x³ + 2x + 1
Decide whether the limits in Exercises exist. If a limit exists, find its value. 9 lim x-00x² 4 10 X 6
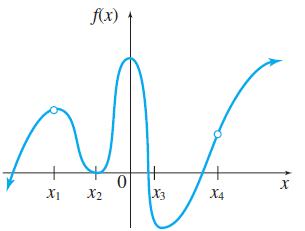
Identify the x-values where f is discontinuous. Xj f(x) क X2 H 0 X3 X4 X
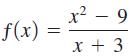
Find all x-values where the function is discontinuous. For each such value, give f (a) and lim x→a f (x) or state that it does not exist. f(x) = x² - 9 x + 3
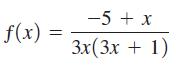
Find all x-values where the function is discontinuous. For each such value, give f (a) and lim x→a f (x) or state that it does not exist. f(x) = -5 + x 3x(3x + 1)
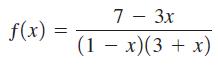
Find all x-values where the function is discontinuous. For each such value, give f (a) and lim x→a f (x) or state that it does not exist. f(x) = 7 - 3x (1-x)(3 + x)
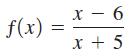
Find all x-values where the function is discontinuous. For each such value, give f (a) and lim x→a f (x) or state that it does not exist. f(x) = 9 x-6 x + 5
In Exercises, (a) Graph the given function, (b) Find all values of x where the function is discontinuous, and (c) Find the limit from the left and from the right at any values of x found Sketch the graph of the derivative for each function shown. in part (b). f(x) = x if x - 2 4 x if
Based on the U.S. Census population projections for 2016 to 2060, the projected Asian population (in millions) can be modeled by the exponential function A(t) = 14.8311.01592t, where t = 0 corresponds to 2000 and 16 ≤ t ≤ 60.(a) Use A to estimate the average rate of change in the Asian
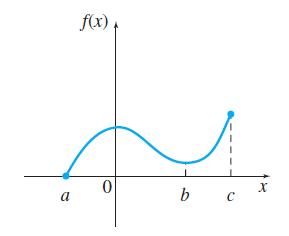
For the function shown in the sketch, give the intervals or points on the x-axis where the rate of change of ƒ(x) with respect to x is(a) positive; (b) negative; (c) zero. a f(x) 0 b c X
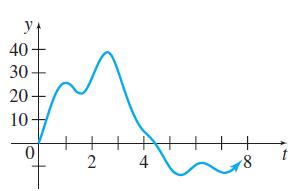
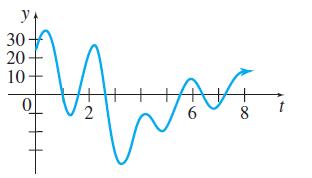
In Exercises, tell which graph, (a) or (b), represents velocity and which represents distance from a starting point.(a)(b) y 40 30 20 10 0 + 2 4 8
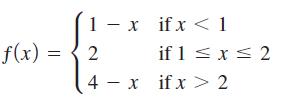
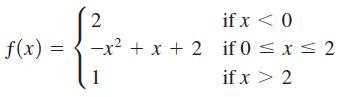
In Exercises, (a) Graph the given function, (b) Find all values of x where the function is discontinuous, and (c) Find the limit from the left and from the right at any values of x found Sketch the graph of the derivative for each function shown. in part (b). f(x) = 2 if x < 0 -x² +
Find all x-values where the function is discontinuous. For each such value, give f (a) and lim x→a f (x) or state that it does not exist.ƒ(x) = x2 + 3x - 4
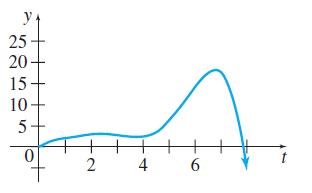
In Exercises, tell which graph, (a) or (b), represents velocity and which represents distance from a starting point.(a)(b) y 25 20 15 10 5 0 2 4 6
The body mass of yearling bighorn sheep on Ram Mountain in Alberta, Canada, can be estimated byM(t) = 27.5 + 0.3t - 0.001t2where M1t2 is measured in kilograms and t is days since May 25.(a) Find the average rate of change of the weight of a bighorn yearling between 105 and 115 days past May 25.(b)
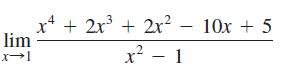
Find each limit (a) By investigating values of the function near the point where the limit is taken and (b) By using a graphing calculator to view the function near the point. lim x-1 x² + 2x³ + 2x² x² - 1 2 10x + 5
Find all x-values where the function is discontinuous. For each such value, give f (a) and lim x→a f (x) or state that it does not exist.ƒ(x) = 2x2 - 5x - 3
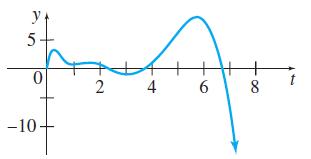
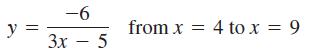
Find the average rate of change for the following on the given interval. Then find the instantaneous rate of change at the first x-value. У -6 3x - 5 from x = 4 to x = 9
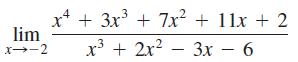
Find each limit (a) By investigating values of the function near the point where the limit is taken and (b) By using a graphing calculator to view the function near the point. lim x--2 x² + 3x³ + 7x² + 11x + 2 x³ + 2x² 3 3x - 6 -
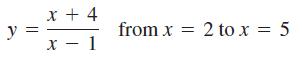
Find the average rate of change for the following on the given interval. Then find the instantaneous rate of change at the first x-value. y x + 4 x - 1 from x = 2 to x = 5
Tell at what values of x the function ƒ(x) in Figure 9 from the previous section is discontinuous. Explain why it is discontinuous at each of these values.
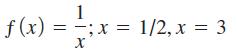
For each function, find (a) The equation of the secant line through the points where x has the given values, and (b) The equation of the tangent line when x has the first value. f(x): = 1 - ; x X = 1/2, x = 3
Find the average rate of change for the following on the given interval. Then find the instantaneous rate of change at the first x-value.y = 6x3 + 2 from x = 1 to x = 4
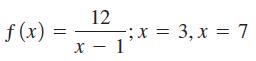
For each function, find (a) The equation of the secant line through the points where x has the given values, and (b) The equation of the tangent line when x has the first value. f(x) = = 12 x - 1 -; X = 3, x = 7
Find the average rate of change for the following on the given interval. Then find the instantaneous rate of change at the first x-value.y = -2x3 - 3x2 + 8 from x = -2 to x = 6
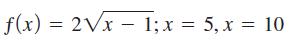
For each function, find (a) The equation of the secant line through the points where x has the given values, and (b) The equation of the tangent line when x has the first value. f(x) = 2√x – 1; x = 5, x = 10 -
For each function, find (a) The equation of the secant line through the points where x has the given values, and (b) The equation of the tangent line when x has the first value.ƒ(x) = 3x2 - 5x + 7; x = 2, x = 4
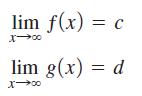
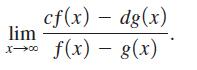
Let ƒ and g be differentiable functions such thatwhere c Z d. Determine(Choose one of the following.) Source: Society of Actuaries.(a) 0(b)(c) ƒ′(0) - g′(0)(d) c - d(e) c + d lim f(x) = c lim g(x) = d
Sketch the graph of the derivative for each function shown. + -6 -4 -2 f(x) 2 จ 2 4 6 x
Sketch the graph of the derivative for each function shown. -6 --4 -2 f(x) 2 -2 + +11 2 4 6 X
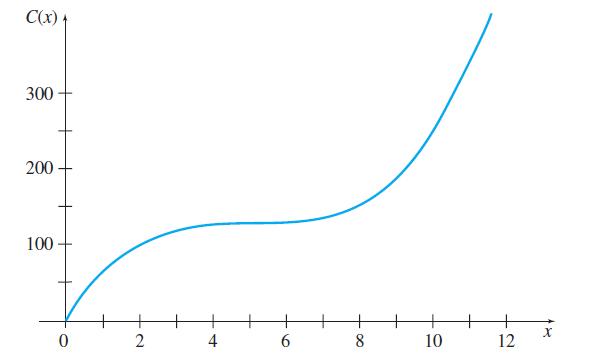
The graph shows the total cost C(x) to produce x tons of cement. (Recall that average cost is given by total cost divided by the number produced, or C(x) = C(x)/x.)(a) Find the value of x for which the average cost is smallest.(b) What can you say about the marginal cost at the point where the
Use the definition of the derivative to find the derivative of the following.ƒ(x) = 4x2 + 3x - 2
Use the definition of the derivative to find the derivative of the following.ƒ(x) = 5x2 - 6x + 7
In Exercises, find the derivative of the function at the given point (a) By approximating the definition of the derivative with small values of h (b) By using a graphing calculator to zoom in on the function until it appears to be a straight line, and then finding the slope of that
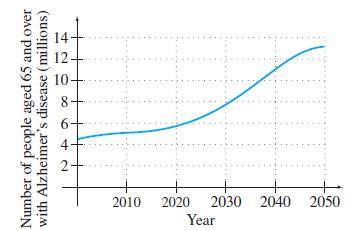
The graph below shows the projected number of people aged 65 and over in the United States with Alzheimer’s disease. Estimate and interpret the derivative in each of the following years.(a) 2000 (b) 2040(c) Find the average rate of change between 2000 and 2040 in the number of people aged 65
In Exercises, find the derivative of the function at the given point (a) By approximating the definition of the derivative with small values of h and (b) By using a graphing calculator to zoom in on the function until it appears to be a straight line, and then finding the slope of that
A simplified income tax considered in the U.S. Senate in 1986 had two tax brackets. Married couples earning $29,300 or less would pay 15% of their income in taxes. Those earning more than $29,300 would pay $4350 plus 27% of the income over $29,300 in taxes. Let T(x) be the amount of taxes paid by
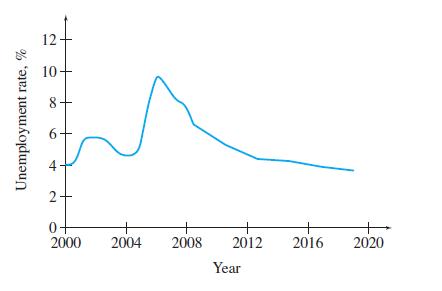
The unemployment rates in the United States for the years 1994–2014 are shown in the graph below. Sketch a graph showing the rate of change in the annual unemployment rates for this period. Use the graph and your sketch to estimate the annual unemployment rate and rate of change of the
The growth remaining in sitting height for girls at consecutive skeletal age levels is indicated on the graph. Sketch a graph showing the rate of change of growth remaining for the indicated years. Use the graph and your skethc to estimate the remaining growth and the rate of change of remaining
Waverly Products has found that its revenue is related to advertising expenditures by the functionR(x) = 5000 + 16x - 3x2, where R(x) is the revenue in dollars when x hundred dollars are spent on advertising.(a) Find the marginal revenue function.(b) Find and interpret the marginal revenue when
Suppose a gram of ice is at a temperature of -100°C. The graph shows the temperature of the ice as increasing numbers of calories of heat are applied. It takes 80 calories to melt one gram of ice at 0°C into water, and 540 calories to boil one gram of water at 100°C into steam.(a) Where is this
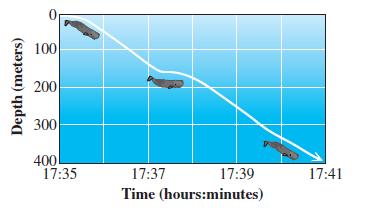
The following figure, already shown in Section 2.1, Properties of Functions, shows the depth of a sperm whale as a function of time, recorded by researchers at the Woods Hole Oceanographic Institution in Massachusetts.(a) Find the rate that the whale was descending at the following times.(i) 17
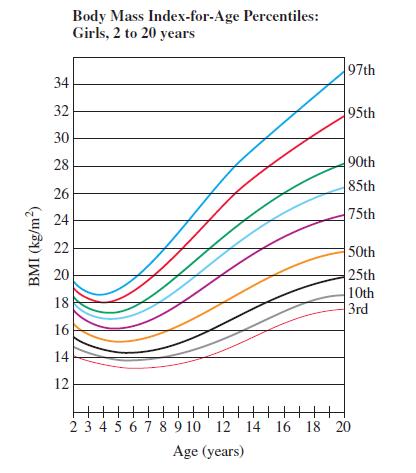
The following graph shows how the body mass index-for-age percentile for girls varies from the age of 2 to 20 years.(a) Sketch a graph of the rate of change of the 95th percentile as a function of age.(b) Sketch a graph of the rate of change of the 50th percentile as a function of age. BMI
A company charges $1.50 per lb when a certain chemical is bought in lots of 125 lb or less, with a price per pound of $1.35 if more than 125 lb are purchased. Let C(x) represent the cost of x lb. Find the cost for the following numbers of pounds.(a) 100 (b) 125 (c) 140 (d) Graph y =
In Chapter 1, we saw that the cost to fly x miles on American Airlines could be approximated by the equation C(x) = 0.00003964x + 191.16. Recall from the previous chapter that the average cost per mile, denoted by C̅(x) is found by dividing C(x) by x. Find and interpret lim T(x). x-x X
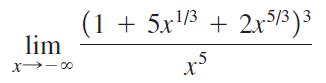
Use a graphing calculator to graph the function. (a) Determine the limit from the graph. (b) Explain how your answer could be determined from the expression for f (x). lim (1 + 5x¹/³ + 2x5/³)³ 5r1/3 x5
The spread of a virus is modeled byV(t) = -t2 + 6t - 4,where V(t) is the number of people (in hundreds) with the virus and t is the number of weeks since the first case was observed.(a) Graph V(t).(b) What is a reasonable domain of t for this problem?(c) When does the number of cases reach a
A company determines that t months after an employee starts working on the assembly line, the employee will be able to assemble Q(t) = 60 - 40e-0.3t products per day.(a) Determine the number of units a new employee can assemble on their first day at work (t = 0).(b) Determine the number of units a
The cost (in dollars) for manufacturing a particular flashdrive isC(x) = 15,000 + 6x,where x is the number of flashdrives produced. Recall from the previous chapter that the average cost per flashdrive, denoted by C̅(x), is found by dividing C(x) by x. Find and interpret lim C(x). X→∞0
A company training program has determined that, on the average, a new employee produces P(s)Citems per day after s days of on-the-job training, whereFind and interpret P(s) = 63s S + 8
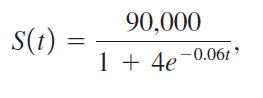
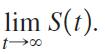
A company expects that sales of a new product can be approximated by the functionwhere S(t) is the number of units sold in month t .(a) Determine the number of units sold in month 1.(b) Determine the number of units sold in month 10.(c) Determine the number of units sold in month 100.(d) Find and
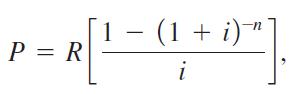
In business finance, an annuity is a series of equal payments received at equal intervals for a finite period of time. The present value of an n-period annuity takes the formwhere R is the amount of the periodic payment and i is the fixed interest rate per period. Many corporations raise money by
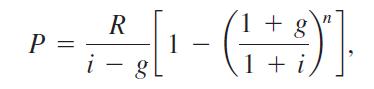
For some annuities encountered in business finance, called growing annuities, the amount of the periodic payment is not constant but grows at a constant periodic rate. Leases with escalation clauses can be examples of growing annuities. The present value of a growing annuity takes the formwhereR =
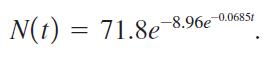
Researchers have developed a mathematical model that can be used to estimate the number of teeth N(t) at time t (days of incubation) for Alligator mississippiensis, where(a) Find N(65), the number of teeth of an alligator that hatched after 65 days.(b) Findand use this value as an estimate of the
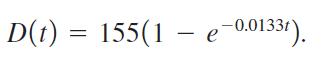
To develop strategies to manage water quality in polluted lakes, biologists must determine the depths of sediments and the rate of sedimentation. It has been determined that the depth of sediment D(t) (in centimeters) with respect to time (in years before 1990) for Lake Coeur d’Alene, Idaho, can
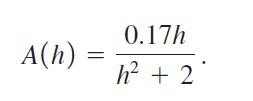
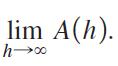
The concentration of a drug in a patient’s bloodstream h hours after it was injected is given byFind and interpret A(h) = 0.17h h² + 2
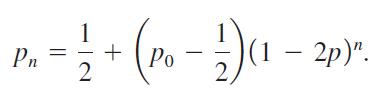
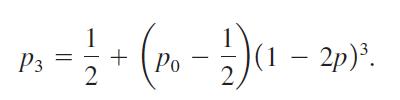
Members of a legislature often must vote repeatedly on the same bill. As time goes on, members may change their votes. Suppose that p0 is the probability that an individual legislator favors an issue before the first roll call vote, and suppose that p is the probability of a change in position from
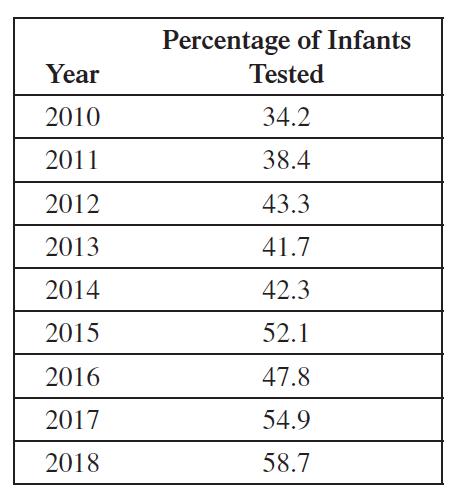
The following table shows global estimated percentages in recent years of infants tested for HIV within two months of being born to women having HIV.(a) Plot the data on a graphing calculator, letting t = 0 correspond to the year 2010.(b) Using the regression feature on your calculator, find a
An article in a medical journal says that a sunscreen with a sun protection factor (SPF) of 2 provides 50% protection against ultraviolet B (UVB) radiation, an SPF of 4 provides 75% protection, and an SPF of 8 provides 87.5% protection (which the article rounds to 87%).(a) 87.5% protection means
Showing 7600 - 7700
of 8662
First
70
71
72
73
74
75
76
77
78
79
80
81
82
83
84
Last
Step by Step Answers