New Semester
Started
Get
50% OFF
Study Help!
--h --m --s
Claim Now
Question Answers
Textbooks
Find textbooks, questions and answers
Oops, something went wrong!
Change your search query and then try again
S
Books
FREE
Study Help
Expert Questions
Accounting
General Management
Mathematics
Finance
Organizational Behaviour
Law
Physics
Operating System
Management Leadership
Sociology
Programming
Marketing
Database
Computer Network
Economics
Textbooks Solutions
Accounting
Managerial Accounting
Management Leadership
Cost Accounting
Statistics
Business Law
Corporate Finance
Finance
Economics
Auditing
Tutors
Online Tutors
Find a Tutor
Hire a Tutor
Become a Tutor
AI Tutor
AI Study Planner
NEW
Sell Books
Search
Search
Sign In
Register
study help
mathematics
college algebra graphs and models
College Algebra With Modeling And Visualization 6th Edition Gary Rockswold - Solutions
In Exercises 21–42, evaluate each expression without using a calculator. log6 V6
In Exercises 21–42, evaluate each expression without using a calculator. log₂ √2
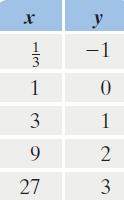
In Exercises 30–33, determine whether the values in each table belong to an exponential function, a logarithmic function, a linear function, or a quadratic function. r alen 3 1 3 9 27 У -1 0 1 2 3
In Exercises 25–34, begin by graphing f(x) = 2x. Then use transformations of this graph to graph the given function. Be sure to graph and give equations of the asymptotes. Use the graphs to determine each function’s domain and range. If applicable, use a graphing utility to confirm your
In Exercises 1–40, use properties of logarithms to expand each logarithmic expression as much as possible. Where possible, evaluate logarithmic expressions without using a calculator. log, X
In Exercises 1–40, use properties of logarithms to expand each logarithmic expression as much as possible. Where possible, evaluate logarithmic expressions without using a calculator. 51 log, X y
Solve each exponential equation in Exercises 23–48. Express the solution set in terms of natural logarithms or common logarithms. Then use a calculator to obtain a decimal approximation, correct to two decimal places, for the solution.9ex = 107
Graph f(x) = 2x and g(x) = log2 x in the same rectangular coordinate system. Use the graphs to determine each function’s domain and range.
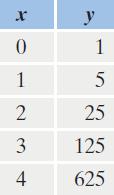
In Exercises 30–33, determine whether the values in each table belong to an exponential function, a logarithmic function, a linear function, or a quadratic function. x 0 1 2 3 4 y 1 5 25 125 625
Use the exponential decay model, A = A0ekt, to solve Exercises 28–31. Round answers to one decimal place.The half-life of aspirin in your bloodstream is 12 hours. How long will it take for the aspirin to decay to 70% of the original dosage?
In Exercises 21–42, evaluate each expression without using a calculator. log33
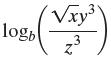
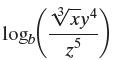
In Exercises 1–40, use properties of logarithms to expand each logarithmic expression as much as possible. Where possible, evaluate logarithmic expressions without using a calculator. logb √xy³ 3 z³
Solve each exponential equation in Exercises 23–48. Express the solution set in terms of natural logarithms or common logarithms. Then use a calculator to obtain a decimal approximation, correct to two decimal places, for the solution.3e5x = 1977
In Exercises 25–34, begin by graphing f(x) = 2x. Then use transformations of this graph to graph the given function. Be sure to graph and give equations of the asymptotes. Use the graphs to determine each function’s domain and range. If applicable, use a graphing utility to confirm your
Graph f(x) = (1/3)x and g(x) = log1/3 x in the same rectangular coordinate system. Use the graphs to determine each function’s domain and range.
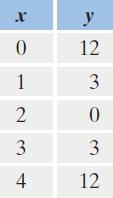
In Exercises 30–33, determine whether the values in each table belong to an exponential function, a logarithmic function, a linear function, or a quadratic function. x 0 1 2 3 4 y 12 3 0 3 12
In Exercises 25–34, begin by graphing f(x) = 2x. Then use transformations of this graph to graph the given function. Be sure to graph and give equations of the asymptotes. Use the graphs to determine each function’s domain and range. If applicable, use a graphing utility to confirm your
Use the exponential decay model, A = A0ekt, to solve Exercises 28–31. Round answers to one decimal place.Xanax is a tranquilizer used in the short-term relief of symptoms of anxiety. Its half-life in the bloodstream is 36 hours. How long will it take for Xanax to decay to 90% of the original
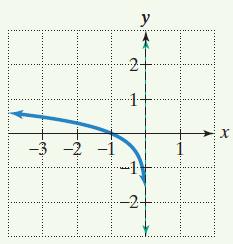
In Exercises 32–35, the graph of a logarithmic function is given. Select the function for each graph from the following options:f(x) = log x, g(x) = log(-x), h(x) = log(2 - x), r(x) = 1 + log(2 - x). -3 -2 -1 у -2+ 18 Bu X
In Exercises 21–42, evaluate each expression without using a calculator. 10g648
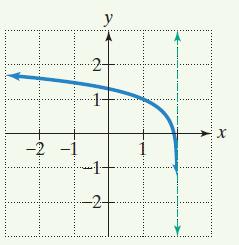
In Exercises 32–35, the graph of a logarithmic function is given. Select the function for each graph from the following options:f(x) = log x, g(x) = log(-x), h(x) = log(2 - x), r(x) = 1 + log(2 - x). -2 Sve У X
Solve each exponential equation in Exercises 23–48. Express the solution set in terms of natural logarithms or common logarithms. Then use a calculator to obtain a decimal approximation, correct to two decimal places, for the solution.4e7x = 10,273
Use the exponential growth model, A = A0ekt, to show that the time it takes a population to double (to grow from A0 to 2A0) is given by t = In 2 k
A bird species in danger of extinction has a population that is decreasing exponentially (A = A0ekt). Five years ago the population was at 1400 and today only 1000 of the birds are alive. Once the population drops below 100, the situation will be irreversible. When will this happen?
Solve each exponential equation in Exercises 23–48. Express the solution set in terms of natural logarithms or common logarithms. Then use a calculator to obtain a decimal approximation, correct to two decimal places, for the solution.e1-5x = 793
Rewrite y = 96(0.38)x in terms of base e. Express the answer in terms of a natural logarithm and then round to three decimal places.
In Exercises 1–40, use properties of logarithms to expand each logarithmic expression as much as possible. Where possible, evaluate logarithmic expressions without using a calculator. logo √xy4 5 ?
Solve each exponential equation in Exercises 23–48. Express the solution set in terms of natural logarithms or common logarithms. Then use a calculator to obtain a decimal approximation, correct to two decimal places, for the solution.e1-8x = 7957
Solve each exponential equation in Exercises 23–48. Express the solution set in terms of natural logarithms or common logarithms. Then use a calculator to obtain a decimal approximation, correct to two decimal places, for the solution.e5x-3 - 2 = 10,476
In Exercises 1–40, use properties of logarithms to expand each logarithmic expression as much as possible. Where possible, evaluate logarithmic expressions without using a calculator. logs x²y 25
In Exercises 21–42, evaluate each expression without using a calculator. log819
In Exercises 32–35, the graph of a logarithmic function is given. Select the function for each graph from the following options:f(x) = log x, g(x) = log(-x), h(x) = log(2 - x), r(x) = 1 + log(2 - x). -2 y -2- x
In Exercises 25–34, begin by graphing f(x) = 2x. Then use transformations of this graph to graph the given function. Be sure to graph and give equations of the asymptotes. Use the graphs to determine each function’s domain and range. If applicable, use a graphing utility to confirm your
Use the exponential growth model, A = A0ekt, to show that the time it takes a population to triple (to grow from A0 to 3A0) is given by In 3 k
In Exercises 21–42, evaluate each expression without using a calculator. log5 5
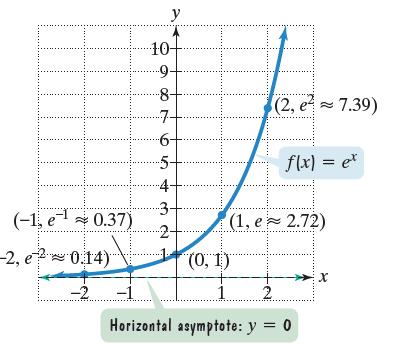
The figure shows the graph of f(x) = ex. In Exercises 35–46, use transformations of this graph to graph each function. Be sure to give equations of the asymptotes. Use the graphs to determine each function’s domain and range. If applicable, use a graphing utility to confirm your hand-drawn
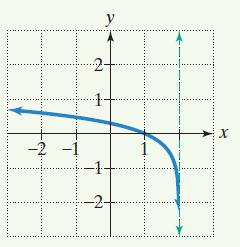
In Exercises 32–35, the graph of a logarithmic function is given. Select the function for each graph from the following options:f(x) = log x, g(x) = log(-x), h(x) = log(2 - x), r(x) = 1 + log(2 - x). -1 ..... y -1- -1 -2+₁ SERY ....... X SOUN
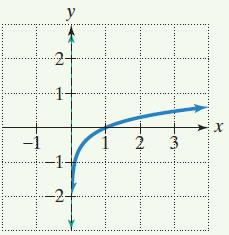
In Exercises 36–38, begin by graphing f(x) = log2 x. Then use transformations of this graph to graph the given function. What is the graph’s x-intercept? What is the vertical asymptote? Use the graphs to determine each function’s domain and range.h(x) = -1 + log2 x
The figure shows the graph of f(x) = ex. In Exercises 35–46, use transformations of this graph to graph each function. Be sure to give equations of the asymptotes. Use the graphs to determine each function’s domain and range. If applicable, use a graphing utility to confirm your hand-drawn
Solve each exponential equation in Exercises 23–48. Express the solution set in terms of natural logarithms or common logarithms. Then use a calculator to obtain a decimal approximation, correct to two decimal places, for the solution. 37 = 0.2
The figure shows the graph of f(x) = ex. In Exercises 35–46, use transformations of this graph to graph each function. Be sure to give equations of the asymptotes. Use the graphs to determine each function’s domain and range. If applicable, use a graphing utility to confirm your hand-drawn
In Exercises 21–42, evaluate each expression without using a calculator. log4 46
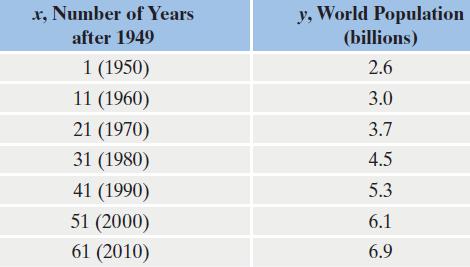
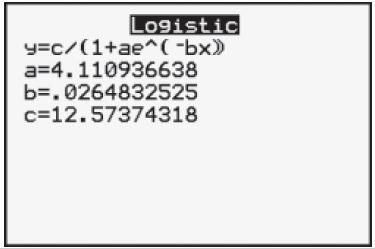
Shown, again, in the following table is world population, in billions, for seven selected years from 1950 through 2010. Using a graphing utility’s logistic regression option, we obtain the equation shown on the screen.We see from the calculator screen at the bottom of the previous page that a
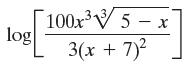
In Exercises 1–40, use properties of logarithms to expand each logarithmic expression as much as possible. Where possible, evaluate logarithmic expressions without using a calculator. log 100x³5x 3(x + 7)²
In Exercises 1–40, use properties of logarithms to expand each logarithmic expression as much as possible. Where possible, evaluate logarithmic expressions without using a calculator. log 10x²1-x 7(x + 1)²
In Exercises 39–40, graph f and g in the same rectangular coordinate system. Use transformations of the graph of f to obtain the graph of g. Graph and give equations of all asymptotes. Use the graphs to determine each function’s domain and range.f(x) = ln x and g(x) = -ln(2x)
Shown, again, in the following table is world population, in billions, for seven selected years from 1950 through 2010. Using a graphing utility’s logistic regression option, we obtain the equation shown on the screen.We see from the calculator screen at the bottom of the previous page that a
The logistic growth functiondescribes the number of people, f(t), who have become ill with influenza t weeks after its initial outbreak in a particular community.a. How many people became ill with the flu when the epidemic began?b. How many people were ill by the end of the fourth week?c. What is
The figure shows the graph of f(x) = ex. In Exercises 35–46, use transformations of this graph to graph each function. Be sure to give equations of the asymptotes. Use the graphs to determine each function’s domain and range. If applicable, use a graphing utility to confirm your hand-drawn
In Exercises 21–42, evaluate each expression without using a calculator. log5 57
The figure shows the graph of f(x) = ex. In Exercises 35–46, use transformations of this graph to graph each function. Be sure to give equations of the asymptotes. Use the graphs to determine each function’s domain and range. If applicable, use a graphing utility to confirm your hand-drawn
In Exercises 39–40, graph f and g in the same rectangular coordinate system. Use transformations of the graph of f to obtain the graph of g. Graph and give equations of all asymptotes. Use the graphs to determine each function’s domain and range.f(x) = log x and g(x) = -log(x + 3)
In Exercises 1–40, use properties of logarithms to expand each logarithmic expression as much as possible. Where possible, evaluate logarithmic expressions without using a calculator. In x²√x² + 3 (x + 3)5
Solve each exponential equation in Exercises 23–48. Express the solution set in terms of natural logarithms or common logarithms. Then use a calculator to obtain a decimal approximation, correct to two decimal places, for the solution.70.3x = 813
In Exercises 21–42, evaluate each expression without using a calculator. log, 1
In Exercises 21–42, evaluate each expression without using a calculator. log4 1
In Exercises 36–38, begin by graphing f(x) = log2 x. Then use transformations of this graph to graph the given function. What is the graph’s x-intercept? What is the vertical asymptote? Use the graphs to determine each function’s domain and range.r(x) = log2(-x)
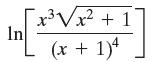
In Exercises 1–40, use properties of logarithms to expand each logarithmic expression as much as possible. Where possible, evaluate logarithmic expressions without using a calculator. In x³√x² + 1 (x + 1)4
The figure shows the graph of f(x) = ex. In Exercises 35–46, use transformations of this graph to graph each function. Be sure to give equations of the asymptotes. Use the graphs to determine each function’s domain and range. If applicable, use a graphing utility to confirm your hand-drawn
Solve each exponential equation in Exercises 23–48. Express the solution set in terms of natural logarithms or common logarithms. Then use a calculator to obtain a decimal approximation, correct to two decimal places, for the solution.5x-3 = 137
In Exercises 1–40, use properties of logarithms to expand each logarithmic expression as much as possible. Where possible, evaluate logarithmic expressions without using a calculator. n log21 xyª 16
In Exercises 21–42, evaluate each expression without using a calculator. log₁1 11
Solve each exponential equation in Exercises 23–48. Express the solution set in terms of natural logarithms or common logarithms. Then use a calculator to obtain a decimal approximation, correct to two decimal places, for the solution.7x+2 = 410
Use the formula t = ln 2/k that gives the time for a population with a growth rate k to double to solve Exercises 35–36. Express each answer to the nearest whole year.The growth model A = 112.5e0.012t describes Mexico’s population, A, in millions, t years after 2010.a. What is Mexico’s growth
In Exercises 36–38, begin by graphing f(x) = log2 x. Then use transformations of this graph to graph the given function. What is the graph’s x-intercept? What is the vertical asymptote? Use the graphs to determine each function’s domain and range.g(x) = log2(x - 2)
Solve each exponential equation in Exercises 23–48. Express the solution set in terms of natural logarithms or common logarithms. Then use a calculator to obtain a decimal approximation, correct to two decimal places, for the solution.e4x-5 - 7 = 11,243
Use the formula t = ln 2/k that gives the time for a population with a growth rate k to double to solve Exercises 35–36. Express each answer to the nearest whole year.The growth model A = 4.3e0.01t describes New Zealand’s population, A, in millions, t years after 2010.a. What is New Zealand’s
Shown, again, in the following table is world population, in billions, for seven selected years from 1950 through 2010. Using a graphing utility’s logistic regression option, we obtain the equation shown on the screen.We see from the calculator screen at the bottom of the previous page that a
In Exercises 21–42, evaluate each expression without using a calculator. glogs 19
Solve each exponential equation in Exercises 23–48. Express the solution set in terms of natural logarithms or common logarithms. Then use a calculator to obtain a decimal approximation, correct to two decimal places, for the solution.52x+3 = 3x-1
In Exercises 41–43, find the domain of each logarithmic function.f(x) = log8(x + 5)
In Exercises 41–70, use properties of logarithms to condense each logarithmic expression. Write the expression as a single logarithm whose coefficient is 1. Where possible, evaluate logarithmic expressions without using a calculator.log 5 + log 2
The figure shows the graph of f(x) = ex. In Exercises 35–46, use transformations of this graph to graph each function. Be sure to give equations of the asymptotes. Use the graphs to determine each function’s domain and range. If applicable, use a graphing utility to confirm your hand-drawn
Shown, again, in the following table is world population, in billions, for seven selected years from 1950 through 2010. Using a graphing utility’s logistic regression option, we obtain the equation shown on the screen.We see from the calculator screen at the bottom of the previous page that a
In Exercises 41–70, use properties of logarithms to condense each logarithmic expression. Write the expression as a single logarithm whose coefficient is 1. Where possible, evaluate logarithmic expressions without using a calculator.log 250 + log 4
Solve each exponential equation in Exercises 23–48. Express the solution set in terms of natural logarithms or common logarithms. Then use a calculator to obtain a decimal approximation, correct to two decimal places, for the solution.72x+1 = 3x+2
In Exercises 21–42, evaluate each expression without using a calculator. 710g7 23
Graph the solution set to the inequality. 2x + y > 4
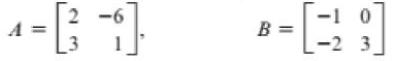
If possible, find each of the following. (a) A + B (b) 3A (c) 2A - 3B 9. 2-6 3 B = -1 0 -2 3
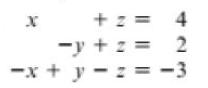
If possible, solve the system. x + 2 = -y + z = -x+y= 4 2 -3
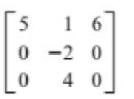
Let A be the given matrix. Find det A by expanding about the first column. State whether A-1 exists. 5 0 0 16 -20 40
Graph the solution set to the inequality. x+y> -3
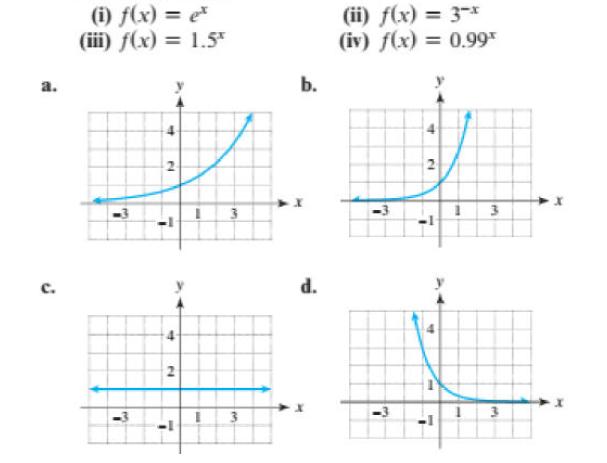
Match the formula for f with its graph (a-d). Do not use a calculator. a. C. (i) f(x) = et (iii) f(x) = 1.5* 7 7 N 7 + 2 7 MAN 3 3 b. d. (ii) f(x) = 3-* (iv) f(x) = 0.99⁰ 3 7 + 2 L 7 1 3 13 ➤X
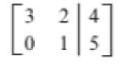
Write the system of linear equations that the augmented matrix represents. 3 5
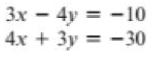
Use the elimination method to solve each system of linear equations, if possible. Identify the system as consistent or inconsistent. 3x - 4y = -10 4x + 3y = -30
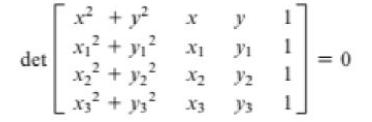
Given three distinct points on a circle (x1, y1), (x2, y2), and (x3, y3), we can find the equation of the circle by using the following 4 x 4 determinant equation.Find the equation of the circle through the given points. det x² + + y² +y₁² x₂² + 1/₂² 2 X3² + y3² X1 y₁ 1 X2 2 1 X3
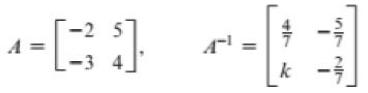
Find the value of the constant k in A-1. -2 5 ^=31 ~[] A™ -3 4 k
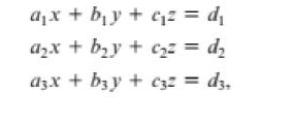
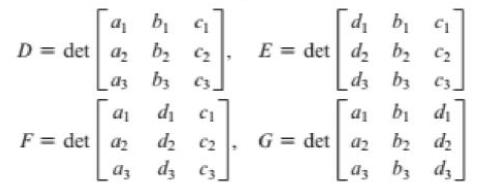
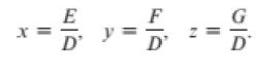
Cramer's rule can be applied to systems of three linear equations in three variables. For the system of equationsthe solution can be written as follows.If D 0 ≠ a unique solution exists and is given byUse Cramer's rule to solve the system of equations. a₁x + b₁y + ₁² = d₁ a₂x + b₂y +
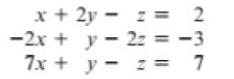
Represent the linear system by mented matrix, and state the dimension of the matrix. x + 2y z = 2 = -2x + y = 2z = -3 - 7x + y = z = 7
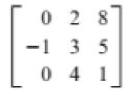
Let A be the given matrix. Find det A by expanding about the first column. State whether A-1 exists. 028 -1 3 5 041
The equations are identities because they are true for all real numbers. Use properties of logarithms to simplify the expression on the left side of the equation so that it equals the expression on the right side, where x is any real number. In|x² − √x4 + 1| + In]x² + √x¹ + 1] = 0 -
Solve each equation. Use the change of base formula to approximate exact answers to the nearest hundredth when appropriate. 4-10 + 1 = 21
If R(x) = 1/2x + 2 calculates the amount of rainfall in inches x hours past midnight, interpret the numbers 1/2 and 2 in the formula for R(x).
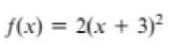
Restrict the domain of f(x) so that f is one-to-one. Then find f-1(x). f(x) = 2(x + 3)²
Write a symbolic representation for f(x, y) if the function f computes the following quantity.The product of x2 and y2
Use the change of base formula to approximate the logarithm to the nearest thousandth. log, 5 + log,7
Solve each equation. Use the change of base formula to approximate exact answers to the nearest hundredth when appropriate. 5(10x) = 65
Determine the x- and y-intercepts on the graph of the equation -2x + 5y = 20.
Determine if the matrix A is invertible by calculating det A. || 43 54
Let scores on a standardized test be modeled by f(x) = 36e-(x-20)2/49. The function f computes the number in thousands of people that received score x. Solve the equation f(x) = 30. Interpret your result.
Showing 5700 - 5800
of 13634
First
51
52
53
54
55
56
57
58
59
60
61
62
63
64
65
Last
Step by Step Answers