New Semester
Started
Get
50% OFF
Study Help!
--h --m --s
Claim Now
Question Answers
Textbooks
Find textbooks, questions and answers
Oops, something went wrong!
Change your search query and then try again
S
Books
FREE
Study Help
Expert Questions
Accounting
General Management
Mathematics
Finance
Organizational Behaviour
Law
Physics
Operating System
Management Leadership
Sociology
Programming
Marketing
Database
Computer Network
Economics
Textbooks Solutions
Accounting
Managerial Accounting
Management Leadership
Cost Accounting
Statistics
Business Law
Corporate Finance
Finance
Economics
Auditing
Tutors
Online Tutors
Find a Tutor
Hire a Tutor
Become a Tutor
AI Tutor
AI Study Planner
NEW
Sell Books
Search
Search
Sign In
Register
study help
mathematics
college algebra graphs and models
College Algebra 7th Edition Robert F Blitzer - Solutions
In Exercises 47–52, graph functions f and g in the same rectangular coordinate system. Graph and give equations of all asymptotes. If applicable, use a graphing utility to confirm your hand-drawn graphs. f(x) = 3* and g(x) = 3.3⁰
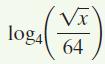
In Exercises 50–53, use properties of logarithms to expand each logarithmic expression as much as possible. Where possible, evaluate logarithmic expressions without using a calculator. log4 Vx 64
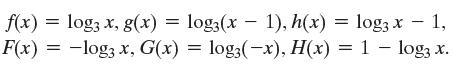
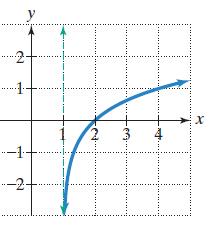
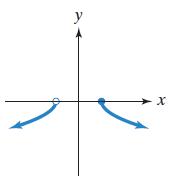
In Exercises 47–52, the graph of a logarithmic function is given. Select the function for each graph from the following options: f(x) = log3 x, g(x) = F(x) = −log3 x, G(x) log3(x - 1), h(x) - 1), h(x) = log3x - 1, = log3(-x), H(x) = 1 - log3 x. = log3(x
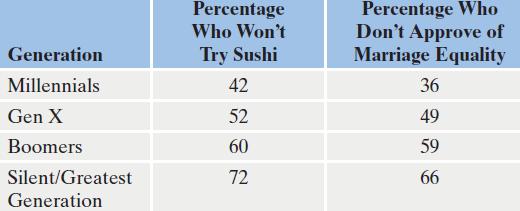
Exercises 47–52 present data in the form of tables. For each data set shown by the table,a. Create a scatter plot for the data.b. Use the scatter plot to determine whether an exponential function, a logarithmic function, or a linear function is the best choice for modeling the data.Hamachiphobia
Solve each logarithmic equation in Exercises 49–92. Be sure to reject any value of x that is not in the domain of the original logarithmic expressions. Give the exact answer. Then, where necessary, use a calculator to obtain a decimal approximation, correct to two decimal places, for the
In Exercises 47–52, graph functions f and g in the same rectangular coordinate system. Graph and give equations of all asymptotes. If applicable, use a graphing utility to confirm your hand-drawn graphs. f(x) = ()* and g(x) = (²)x¹+ 1
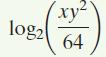
In Exercises 50–53, use properties of logarithms to expand each logarithmic expression as much as possible. Where possible, evaluate logarithmic expressions without using a calculator. log₂ xy² 64
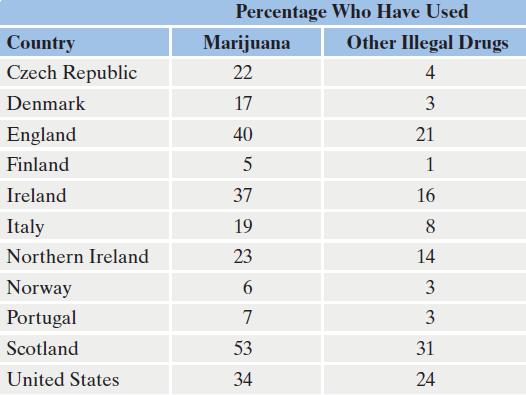
Exercises 47–52 present data in the form of tables. For each data set shown by the table,a. Create a scatter plot for the data.b. Use the scatter plot to determine whether an exponential function, a logarithmic function, or a linear function is the best choice for modeling the data.Teenage Drug
In Exercises 60–63, begin by graphing the standard quadratic function, f(x) = x2. Then use transformations of this graph to graph the given function.y(x) = 1/2(x - 1)2 + 1
In Exercises 64–66, begin by graphing the square root function, f(x) = √x. Then use transformations of this graph to graph the given function. g(x) = √x + 3
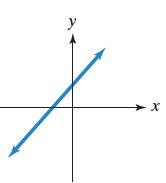
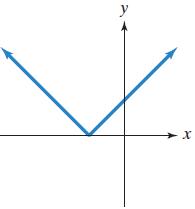
In Exercises 55–64, use the vertical line test to identify graphs in which y is a function of x. y x
In Exercises 53–66, begin by graphing the standard quadratic function, f(x) = x2. Then use transformations of this graph to graph the given function. h(x) = (x - 1)² - 1
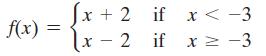
In Exercises 59–70, the domain of each piecewise function is (- ∞, ∞).a. Graph each function.b. Use your graph to determine the function’s range. f(x)= x + 2 (x - 2 2 if if if if x < -3 x ≥-3
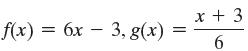
In Exercises 51–66, finda. (f ° g)(x)b. (g ° f)(x)c. (f ° g)(2) f(x) = 6x - 3, g(x) x + 3 6
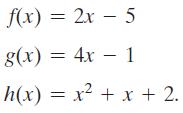
In Exercises 59–64, let Evaluate the indicated function without finding an equation for the function.f(g[h(1)]) f(x) = 2x - 5 g(x) = 4x - 1 h(x) = x² + x + 2.
In Exercises 59–66,a. Rewrite the given equation in slope-intercept form.b. Give the slope and y-intercept.c. Use the slope and y-intercept to graph the linear function.6x - 5y - 20 = 0
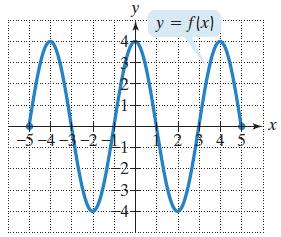
In Exercises 65–70, use the graph of f to find each indicated function value.f(-2) -5-4 30 T y y = f(x) 12 2.H HII A V DIDYFIZIID X
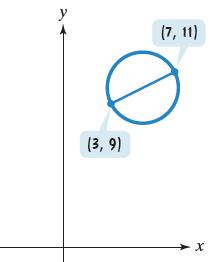
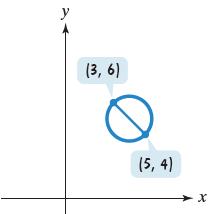
In Exercises 65–66, a line segment through the center of each circle intersects the circle at the points shown.a. Find the coordinates of the circle’s center.b. Find the radius of the circle.c. Use your answers from parts (a) and (b) to write the standard form of the circle’s equation.
In Exercises 64–66, begin by graphing the square root function, f(x) = √x. Then use transformations of this graph to graph the given function. h(x) = √3 - x V3-
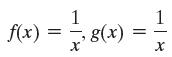
In Exercises 51–66, finda. (f ° g)(x)b. (g ° f)(x)c. (f ° g)(2) 1 f(x)= = g(x) X || 1 X
In Exercises 53–66, begin by graphing the standard quadratic function, f(x) = x2. Then use transformations of this graph to graph the given function. h(x) = -2(x + 1) + 1
In Exercises 65–66, a line segment through the center of each circle intersects the circle at the points shown.a. Find the coordinates of the circle’s center.b. Find the radius of the circle.c. Use your answers from parts (a) and (b) to write the standard form of the circle’s equation.
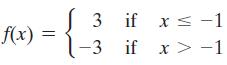
In Exercises 59–70, the domain of each piecewise function is (- ∞, ∞).a. Graph each function.b. Use your graph to determine the function’s range. f(x) = 3 if x-1 -3 if x>-1
In Exercises 64–66, begin by graphing the square root function, f(x) = √x. Then use transformations of this graph to graph the given function. r(x) = 2√x + 2
In Exercises 53–66, begin by graphing the standard quadratic function, f(x) = x2. Then use transformations of this graph to graph the given function. h(x) = -2(x + 2)² + 1
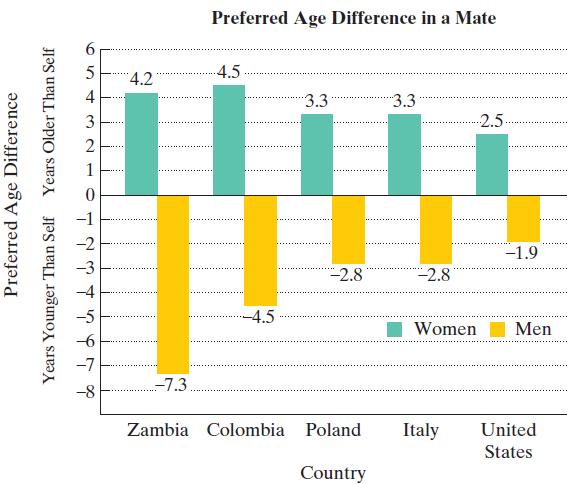
In most societies, women say they prefer to marry men who are older than themselves, whereas men say they prefer women who are younger. The bar graph shows the preferred age difference in a mate in five selected countries. Use this information to solve Exercises 65–66.a. Consider a function, f,
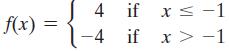
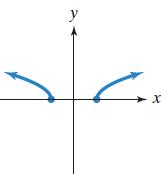
In Exercises 59–70, the domain of each piecewise function is (- ∞, ∞).a. Graph each function.b. Use your graph to determine the function’s range. f(x) = 4 if x < −1 -4 if x>-1
In Exercises 59–66,a. Rewrite the given equation in slope-intercept form.b. Give the slope and y-intercept.c. Use the slope and y-intercept to graph the linear function.3y - 9 = 0
In most societies, women say they prefer to marry men who are older than themselves, whereas men say they prefer women who are younger. The bar graph shows the preferred age difference in a mate in five selected countries. Use this information to solve Exercises 65–66.a. Consider a function, g,
In Exercises 53–64, complete the square and write the equation in standard form. Then give the center and radius of each circle and graph the equation. 0 = + S + x + ₂₁² + ₂x
In Exercises 59–66,a. Rewrite the given equation in slope-intercept form.b. Give the slope and y-intercept.c. Use the slope and y-intercept to graph the linear function.8x - 4y - 12 = 0
In Exercises 51–66, finda. (f ° g)(x)b. (g ° f)(x)c. (f ° g)(2) f(x) = 2x - 3, g(x) x + 3 2
In Exercises 59–64, let Evaluate the indicated function without finding an equation for the function.g(f [h(1)]) f(x) = 2x - 5 g(x) = 4x - 1 h(x) = x² + x + 2.
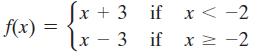
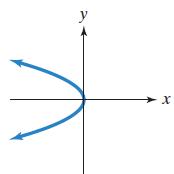
In Exercises 59–70, the domain of each piecewise function is (- ∞, ∞).a. Graph each function.b. Use your graph to determine the function’s range. f(x) = √x + 3 if x < -2 1x -3 if x -2
In Exercises 53–64, complete the square and write the equation in standard form. Then give the center and radius of each circle and graph the equation. x² + y² + 3x - 2y1 = 0
In Exercises 53–66, begin by graphing the standard quadratic function, f(x) = x2. Then use transformations of this graph to graph the given function. h(x) = 2(x - 2)² - 1
In Exercises 55–64, use the vertical line test to identify graphs in which y is a function of x. у Сх
In Exercises 59–66,a. Rewrite the given equation in slope-intercept form.b. Give the slope and y-intercept.c. Use the slope and y-intercept to graph the linear function.4x + 6y + 12 = 0
Solve each exponential equation in Exercises 23–48. Express the solution set in terms of natural logarithms or common logarithms. Then use a calculator to obtain a decimal approximation, correct to two decimal places, for the solution.e4x - 3e2x - 18 = 0
In Exercises 53–66, begin by graphing the standard quadratic function, f(x) = x2. Then use transformations of this graph to graph the given function. g(x) = 2(x - 2)²
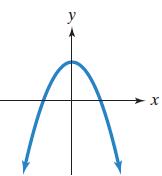
In Exercises 60–63, begin by graphing the standard quadratic function, f(x) = x2. Then use transformations of this graph to graph the given function.r(x) = -(x + 1)2
In Exercises 55–64, use the vertical line test to identify graphs in which y is a function of x. У X
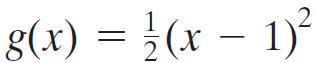
In Exercises 53–66, begin by graphing the standard quadratic function, f(x) = x2. Then use transformations of this graph to graph the given function. 2 g(x) = // (x - 1)² 2
In Exercises 59–64, let Evaluate the indicated function without finding an equation for the function.g-1(7) f(x) = 2x - 5 g(x) = 4x - 1 h(x) = x² + x + 2.
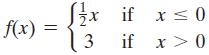
In Exercises 59–70, the domain of each piecewise function is (- ∞, ∞).a. Graph each function.b. Use your graph to determine the function’s range. f(x) 1½x if x ≤ 0 3 if x > 0
In Exercises 53–64, complete the square and write the equation in standard form. Then give the center and radius of each circle and graph the equation. x² + y² + x + y = 1/2 = 0
In Exercises 59–66,a. Rewrite the given equation in slope-intercept form.b. Give the slope and y-intercept.c. Use the slope and y-intercept to graph the linear function.2x + 3y - 18 = 0
In Exercises 51–66, finda. (f ° g)(x)b. (g ° f)(x)c. (f ° g)(2) f(x)=√x, g(x) = x - 1
In Exercises 59–64, let Evaluate the indicated function without finding an equation for the function.f -1(1) f(x) = 2x - 5 g(x) = 4x - 1 h(x) = x² + x + 2.
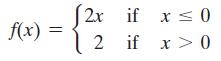
In Exercises 59–70, the domain of each piecewise function is (- ∞, ∞).a. Graph each function.b. Use your graph to determine the function’s range. f(x) = 2x if x ≤0 2 if x > 0
In Exercises 53–64, complete the square and write the equation in standard form. Then give the center and radius of each circle and graph the equation. x² + y² x + 2y + 1 = 0
In Exercises 55–64, use the vertical line test to identify graphs in which y is a function of x. У - Х
In Exercises 60–63, begin by graphing the standard quadratic function, f(x) = x2. Then use transformations of this graph to graph the given function.h(x) = (x + 2)2
In Exercises 59–66,a. Rewrite the given equation in slope-intercept form.b. Give the slope and y-intercept.c. Use the slope and y-intercept to graph the linear function. 4x + y 60
In Exercises 51–66, finda. (f ° g)(x)b. (g ° f)(x)c. (f ° g)(2)f(x) = 5x - 2, g(x) = -x2 + 4x - 1
In Exercises 51–66, finda. (f ° g)(x)b. (g ° f)(x)c. (f ° g)(2)f(x) = 4 - x, g(x) = 2x2 + x + 5
In Exercises 51–66, finda. (f ° g)(x)b. (g ° f)(x)c. (f ° g)(2)f(x) = x2 + 1, g(x) = x2 - 3
In Exercises 51–66, finda. (f ° g)(x)b. (g ° f)(x)c. (f ° g)(2)f(x) = x2 + 2, g(x) = x2 - 2
In Exercises 51–66, finda. (f ° g)(x)b. (g ° f)(x)c. (f ° g)(2)f(x) = 7x + 1, g(x) = 2x2 - 9
In Exercises 55–64, use the vertical line test to identify graphs in which y is a function of x. У X
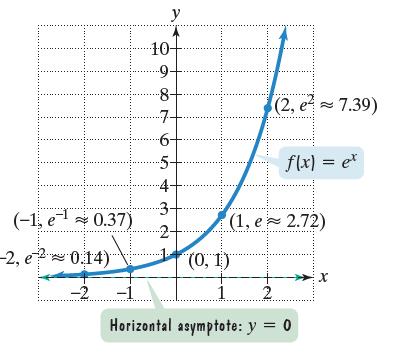
The figure shows the graph of f(x) = ex. In Exercises 35–46, use transformations of this graph to graph each function. Be sure to give equations of the asymptotes. Use the graphs to determine each function’s domain and range. If applicable, use a graphing utility to confirm your hand-drawn
Graph f(x) = (1/2)x and g(x) = log1/2x in the same rectangular coordinate system.
Solve each exponential equation in Exercises 23–48. Express the solution set in terms of natural logarithms or common logarithms. Then use a calculator to obtain a decimal approximation, correct to two decimal places, for the solution.e4x + 5e2x - 24 = 0
In Exercises 41–70, use properties of logarithms to condense each logarithmic expression. Write the expression as a single logarithm whose coefficient is 1. Where possible, evaluate logarithmic expressions without using a calculator.log2 96 - log2 3
In Exercises 51–66, finda. (f ° g)(x)b. (g ° f)(x)c. (f ° g)(2) f(x) = 2 X , g(x) = 2 X
In Exercises 9–16,a. List all possible rational zeros.b. Use synthetic division to test the possible rational zeros and find an actual zero.c. Use the quotient from part (b) to find the remaining zeros of the polynomial function. f(x) = x³ + x² - 4x - 4
Use the four-step procedure for solving variation problems given on page 445 to solve Exercises 1–10.y varies jointly as a and b and inversely as the square root of c. y = 12 when a = 3, b = 2, and c = 25. Find y when a = 5, b = 3, and c = 9.
Fill in each blank so that the resulting statement is true.The Remainder Theorem states that if the polynomial f(x) is divided by x - c, then the remainder is______.
In Exercises 9–16,a. List all possible rational zeros.b. Use synthetic division to test the possible rational zeros and find an actual zero.c. Use the quotient from part (b) to find the remaining zeros of the polynomial function. f(x) = 2x³ 3x² - 11x + 6
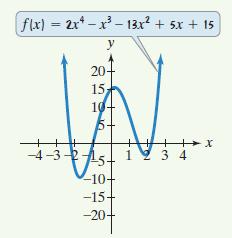
Consider the function whose equation is given by f(x) = 2x4 - x3 - 13x2 + 5x + 15.a. List all possible rational zeros.b. Use the graph of f in the figure shown and synthetic division to find all zeros of the function. f(x) = 2x²-x³-13.x² + 5x + 15 y 20- 15 10+ 5 --3---1--5. 1 -10+ -15- -20+ +
Solve each polynomial inequality in Exercises 1–42 and graph the solution set on a real number line. Express each solution set in interval notation. 3x² + 10x8 ≤0
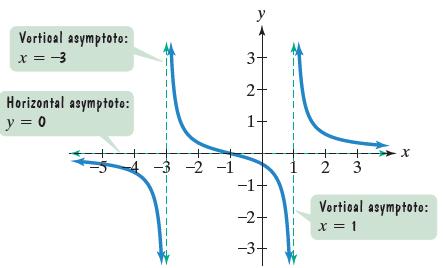
Use the graph of the rational function in the figure shown to complete each statement in Exercises 9–14. Vortical asymptoto: x = -3 Horizontal asymptoto: y = 0 -3 -2 -1 y 3+ 2+ ㅜ -2- -3- 2 3 X Vertical asymptoto: x = 1
In Exercises 5–13, find all zeros of each polynomial function. Then graph the function.f(x) = x3 - 2x2 + 26x
In Exercises 1–16, divide using long division. State the quotient, q(x), and the remainder, r(x). x4 - 81 x - 3
Solve each polynomial inequality in Exercises 1–42 and graph the solution set on a real number line. Express each solution set in interval notation. 9x² + 3x2 ≥ 0
In Exercises 11–20, write an equation that expresses each relationship. Then solve the equation for y.x varies jointly as y and z.
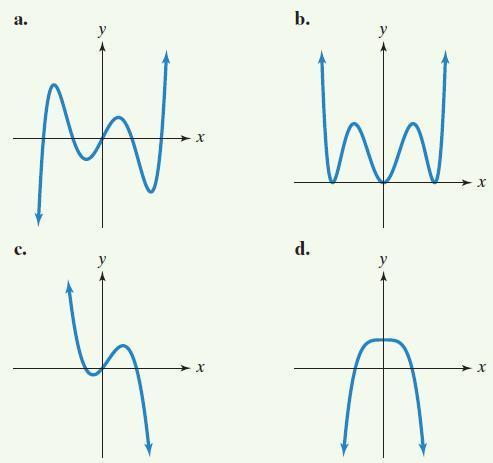
In Exercises 10–13, use the Leading Coefficient Test to determine the end behavior of the graph of the given polynomial function. Then use this end behavior to match the polynomial function with its graph. [The graphs are labeled (a) through (d).]f(x) = x5 - 5x3 + 4x a. b. Art Wal X d. X X
In Exercises 7–12, solve each equation or inequality.|2x - 5|> 3
In Exercises 11–14, identify which graphs are not those of polynomial functions. У - Х
Fill in each blank so that the resulting statement is true.If r is a zero of even multiplicity, then the graph touches the x-axis and________ at r. If r is a zero of odd multiplicity, then the graph________ the x-axis at r.
In Exercises 9–16, find the coordinates of the vertex for the parabola defined by the given quadratic function.f(x) = -2(x + 4)2 - 8
In Exercises 9–16,a. List all possible rational zeros.b. Use synthetic division to test the possible rational zeros and find an actual zero.c. Use the quotient from part (b) to find the remaining zeros of the polynomial function. f(x) = 2x³5x² + x + 2
In Exercises 5–13, find all zeros of each polynomial function. Then graph the function.f(x) = -x3 + 5x2 - 5x - 3
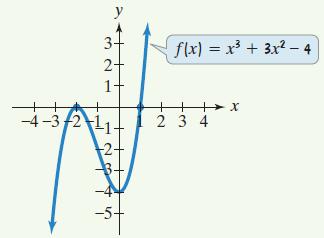
Use the graph of f(x) = x3 + 3x2 - 4 in the figure shown to factor x3 + 3x2 - 4. -4-3-2 y 2- 1- +2+ -st f(x) = x³ + 3x² - 4 + 2 3 4 X
Use the graph of the rational function in the figure shown to complete each statement in Exercises 9–14. Vortical asymptoto: x = -3 Horizontal asymptoto: y = 0 -3 -2 -1 y 3+ 2+ ㅜ -2- -3- 2 3 X Vertical asymptoto: x = 1
In Exercises 11–20, write an equation that expresses each relationship. Then solve the equation for y.x varies jointly as y and the square of z.
In Exercises 7–12, solve each equation or inequality.3x2 > 2x + 5
Fill in each blank so that the resulting statement is true.If f is a polynomial function and f(a) and f(b) have opposite signs, then there must be at least one value of c between a and b for which f(c) =_______ . This result is called the______ Theorem.
In Exercises 9–16, find the coordinates of the vertex for the parabola defined by the given quadratic function.f(x) = 2x2 - 8x + 3
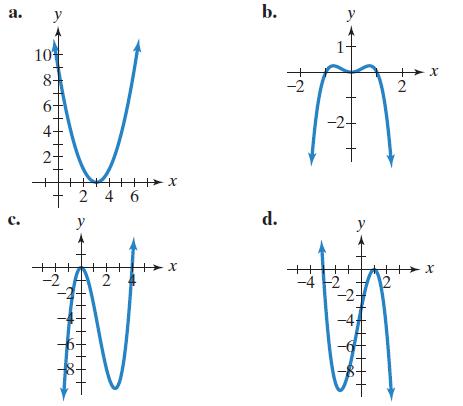
In Exercises 10–13, use the Leading Coefficient Test to determine the end behavior of the graph of the given polynomial function. Then use this end behavior to match the polynomial function with its graph. [The graphs are labeled (a) through (d).]f(x) = -x4 + 1 a. b. Art Wal X d. x= X
In Exercises 11–14, identify which graphs are not those of polynomial functions. У x
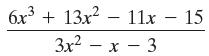
In Exercises 1–16, divide using long division. State the quotient, q(x), and the remainder, r(x). 6x³+ 13x² 11x15 - 3x² - x - 3
Solve each polynomial inequality in Exercises 1–42 and graph the solution set on a real number line. Express each solution set in interval notation. 2x² + x < 15
In Exercises 11–20, write an equation that expresses each relationship. Then solve the equation for y.x varies directly as the cube root of z and inversely as y.
Prove the midpoint formula by using the following procedure.a. Show that the distance between (x1, y1) and is equal to the distance between (x2, y2) and b. Use the procedure from Exercise 94 and the distances from part (a) to show that the points (x1, y1), and (x2, y2) are collinear. (x₁ + x2
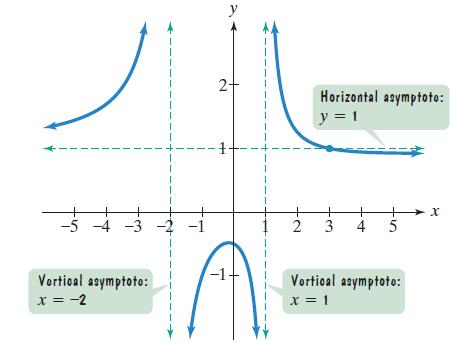
Use the graph of the rational function in the figure shown to complete each statement in Exercises 15–20. 1 -5 -4 -3 -2 -1 Vertical asymptoto: x = -2 y 2+ - 1+ -1+ 1 2 Horizontal asymptoto: y = 1 + 3 w. + 4 5 Vortical asymptoto: x = 1 x
In Exercises 15–18, use the Leading Coefficient Test to determine the end behavior of the graph of the given polynomial function. Then use this end behavior to match the polynomial function with its graph. [The graphs are labeled (a) through (d).]f(x) = (x - 3)2 a. C. 10 8- + ||||| X 4
In Exercises 17–32, divide using synthetic division. (2x2 + x - 10) ÷ (x - 2)
In Exercises 17–24,a. List all possible rational roots.b. Use synthetic division to test the possible rational roots and find an actual root.c. Use the quotient from part (b) to find the remaining roots and solve the equation. x³2x²7x - 4 = 0
Solve each polynomial inequality in Exercises 1–42 and graph the solution set on a real number line. Express each solution set in interval notation. 5x ≤ 2 - 3x²
Showing 5900 - 6000
of 13634
First
53
54
55
56
57
58
59
60
61
62
63
64
65
66
67
Last
Step by Step Answers