New Semester
Started
Get
50% OFF
Study Help!
--h --m --s
Claim Now
Question Answers
Textbooks
Find textbooks, questions and answers
Oops, something went wrong!
Change your search query and then try again
S
Books
FREE
Study Help
Expert Questions
Accounting
General Management
Mathematics
Finance
Organizational Behaviour
Law
Physics
Operating System
Management Leadership
Sociology
Programming
Marketing
Database
Computer Network
Economics
Textbooks Solutions
Accounting
Managerial Accounting
Management Leadership
Cost Accounting
Statistics
Business Law
Corporate Finance
Finance
Economics
Auditing
Tutors
Online Tutors
Find a Tutor
Hire a Tutor
Become a Tutor
AI Tutor
AI Study Planner
NEW
Sell Books
Search
Search
Sign In
Register
study help
mathematics
college algebra graphs and models
College Algebra 7th Edition Robert F Blitzer - Solutions
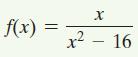
In Exercises 16–21, find the domain of each rational function and graph the function. f(x) = x² 2 X 16
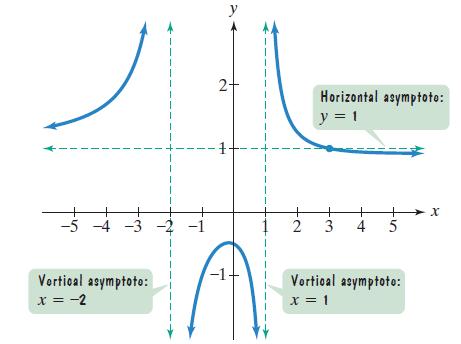
Use the graph of the rational function in the figure shown to complete each statement in Exercises 15–20. 1 -5 -4 -3 -2 -1 Vertical asymptoto: x = -2 y 2+ - 1+ -1+ 1 2 Horizontal asymptoto: y = 1 + 3 w. + 4 5 Vortical asymptoto: x = 1 x
Solve each polynomial inequality in Exercises 1–42 and graph the solution set on a real number line. Express each solution set in interval notation. 4x² + 1 = 4x
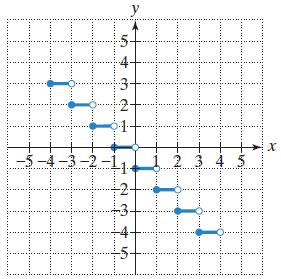
n Exercises 93–94, let f be defined by the following graph: H -5-4-3-2 NWU y LI III II H H 2 3 4 5 III X
In Exercises 17–32, divide using synthetic division. (x²+x-2)(x - 1)
In Exercises 14–19, solve each polynomial equation.x4 - x3 - 11x2 = x + 12
In Exercises 16–17, find the zeros for each polynomial function and give the multiplicity of each zero. State whether the graph crosses the x-axis, or touches the x-axis and turns around, at each zero.f(x) = x3 - 5x2 - 25x + 125
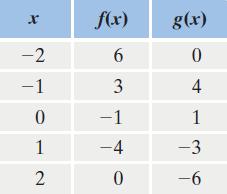
In Exercises 95–96, let f and g be defined by the following table: x -2 -1 0 1 2 f(x) 6 3 -1 -4 0 g(x) 0 4 1 -3 -6
The polynomial function f(x) = -0.87x3 + 0.35x2 + 81.62x + 7684.94 model the number of thefts, f(x), in thousands in the United States x years after 1987. Will this function be useful in modeling the number of thefts over an extended period of time? Explain your answer.
In Exercises 14–19, solve each polynomial equation.2x4 + x3 - 17x2 - 4x + 6 = 0
In Exercises 11–20, write an equation that expresses each relationship. Then solve the equation for y.x varies jointly as z and the sum of y and w.
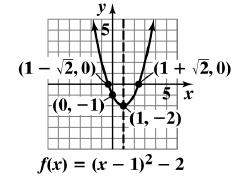
In Exercises 17–38, use the vertex and intercepts to sketch the graph of each quadratic function. Give the equation of the parabola’s axis of symmetry. Use the graph to determine the function’s domain and range.f(x) = (x - 1)2 - 2
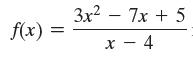
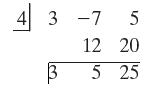
Fill in each blank so that the resulting statement is true.Based on the synthetic division shown below, the equation of the slant asymptote ofis___________ . f(x) 3x² - 7x + 5 x - 4
In Exercises 1–8, find the domain of each rational function. h(x) x + 8 +²64
Show that f(x) = x3 - 2x - 1 has a real zero between 1 and 2.
In Exercises 11–20, write an equation that expresses each relationship. Then solve the equation for y.x varies jointly as z and the difference between y and w.
In Exercises 13–18, graph each equation in a rectangular coordinate system. If two functions are given, graph both in the same system.x2 + y2 - 2x + 4y - 4 = 0
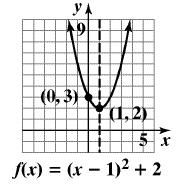
In Exercises 17–38, use the vertex and intercepts to sketch the graph of each quadratic function. Give the equation of the parabola’s axis of symmetry. Use the graph to determine the function’s domain and range.f(x) = (x - 1)2 + 2
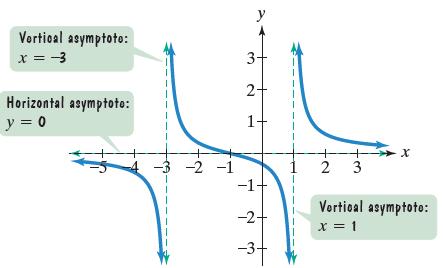
Use the graph of the rational function in the figure shown to complete each statement in Exercises 9–14. Vortical asymptoto: x = -3 Horizontal asymptoto: y = 0 -3 -2 -1 y 3+ 2+ ㅜ -2- -3- 2 3 X Vertical asymptoto: x = 1
In Exercises 95–96, find all values of x satisfying the given conditions.f(x) = 2x - 5, g(x) = x2 - 3x + 8, and (f ° g)(x) = 7.
If f(x) = 3x and g(x) = x + 5, find (f ° g)-1(x) and (g-1 ° f -1)(x).
In Exercises 5–13, find all zeros of each polynomial function. Then graph the function.f(x) = -(x + 1)6
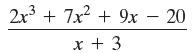
In Exercises 1–16, divide using long division. State the quotient, q(x), and the remainder, r(x). 2x³ + 7x² + 9x - 20 x + 3
Solve each polynomial inequality in Exercises 1–42 and graph the solution set on a real number line. Express each solution set in interval notation. x² - 6x + 9
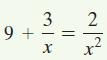
In Exercises 7–12, solve each equation or inequality. 9 + 3 X 2 2 X
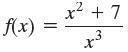
In Exercises 1–10, determine which functions are polynomial functions. For those that are, identify the degree. f(x) = x² + 7 x3 X
In Exercises 9–16,a. List all possible rational zeros.b. Use synthetic division to test the possible rational zeros and find an actual zero.c. Use the quotient from part (b) to find the remaining zeros of the polynomial function. f(x) = x³ 2x² - 11x + 12
a. Use a graphing utility to graph f(x) = x2 + 1.b. Graph f(x) = x2 + 1, g(x) = f(2x), h(x) = f(3x), and k(x) = f(4x) in the same viewing rectangle.c. Describe the relationship among the graphs of f, g, h, and k, with emphasis on different values of x for points on all four graphs that give the
In Exercises 9–16, find the coordinates of the vertex for the parabola defined by the given quadratic function.f(x) = 2(x - 3)2 + 1
a. Use a graphing utility to graph f(x) = x2 + 1.b. Graph f(x) = x2 + 1, g(x) = f(1/2x), and h(x) = f(1/4x) in the same viewing rectangle.c. Describe the relationship among the graphs of f, g, and h, with emphasis on different values of x for points on all three graphs that give the same
In Exercises 5–13, find all zeros of each polynomial function. Then graph the function.f(x) = -6x3 + 7x2 - 1
Use the Rational Zero Theorem to list all possible rational zeros of f(x) = 2x3 + 11x2 - 7x - 6.
Among all pairs of numbers whose difference is 14, find a pair whose product is as small as possible. What is the minimum product?
Fill in each blank so that the resulting statement is true.A polynomial function with one sign change must have one positive real zero._______
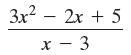
In Exercises 1–16, divide using long division. State the quotient, q(x), and the remainder, r(x). 3x² - 2x + 5 x-3
Use the graph of the rational function in the figure shown to complete each statement in Exercises 9–14. Vortical asymptoto: x = -3 Horizontal asymptoto: y = 0 -3 -2 -1 y 3+ 2+ ㅜ -2- -3- 2 3 X Vertical asymptoto: x = 1
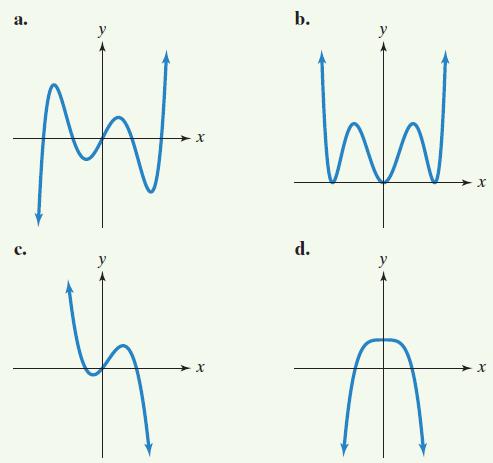
In Exercises 10–13, use the Leading Coefficient Test to determine the end behavior of the graph of the given polynomial function. Then use this end behavior to match the polynomial function with its graph. [The graphs are labeled (a) through (d).]f(x) = -x3 + x2 + 2x MT. AND X d. X X
Solve each polynomial inequality in Exercises 1–42 and graph the solution set on a real number line. Express each solution set in interval notation. 2x + 1 > 0
Fill in each blank so that the resulting statement is true.True or false: Even-degree polynomial functions have graphs with the same behavior at each end________.
In Exercises 1–10, determine which functions are polynomial functions. For those that are, identify the degree. f(x) x² + 7 3
Use the graph of the rational function in the figure shown to complete each statement in Exercises 9–14. Vortical asymptoto: x = -3 Horizontal asymptoto: y = 0 -3 -2 -1 y 3+ 2+ ㅜ -2- -3- 2 3 X Vertical asymptoto: x = 1
In Exercises 9–16, find the coordinates of the vertex for the parabola defined by the given quadratic function.f(x) = -3(x - 2)2 + 12
Use Descartes’s Rule of Signs to determine the possible number of positive and negative real zeros of f(x) = 3x5 - 2x4 - 2x2 + x - 1.
Fill in each blank so that the resulting statement is true.A polynomial function with seven sign changes can have one, three, five, or seven positive real zeros.______
In Exercises 5–13, find all zeros of each polynomial function. Then graph the function.f(x) = 2x3 - 2x
Use the four-step procedure for solving variation problems given on page 445 to solve Exercises 1–10.y varies jointly as m and the square of n and inversely as p. y = 15 when m = 2, n = 1, and p = 6. Find y when m = 3, n = 4, and p = 10.
In Exercises 7–12, solve each equation or inequality.x3 + 2x2 - 5x - 6 = 0
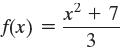
In Exercises 10–13, use the Leading Coefficient Test to determine the end behavior of the graph of the given polynomial function. Then use this end behavior to match the polynomial function with its graph. [The graphs are labeled (a) through (d).]f(x) = x6 - 6x4 + 9x2 a. b. Art Wal X d. X X
Fill in each blank so that the resulting statement is true.Every real zero of a polynomial function appears as a/an_________ of the graph.
In Exercises 9–16, find the coordinates of the vertex for the parabola defined by the given quadratic function.f(x) = -2(x + 1)2 + 5
In Exercises 11–14, identify which graphs are not those of polynomial functions. У X
Solve: x3 + 9x2 + 16x - 6 = 0.
Fill in each blank so that the resulting statement is true.The Factor Theorem states that if f is a polynomial function and f(c) = 0, then______. is a factor of f(x).
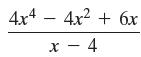
In Exercises 1–16, divide using long division. State the quotient, q(x), and the remainder, r(x). 4x4 - 4x² + 6x x - 4 X
In Exercises 17–24,a. List all possible rational roots.b. Use synthetic division to test the possible rational roots and find an actual root.c. Use the quotient from part (b) to find the remaining roots and solve the equation. x³10x 12 = 0 -
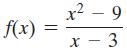
In Exercises 16–21, find the domain of each rational function and graph the function. f(x) x² - 9 2 X x - 2
Use the graph of the rational function in the figure shown to complete each statement in Exercises 15–20. 1 -5 -4 -3 -2 -1 Vertical asymptoto: x = -2 y 2+ - 1+ -1+ 1 2 Horizontal asymptoto: y = 1 + 3 w. + 4 5 Vortical asymptoto: x = 1 x
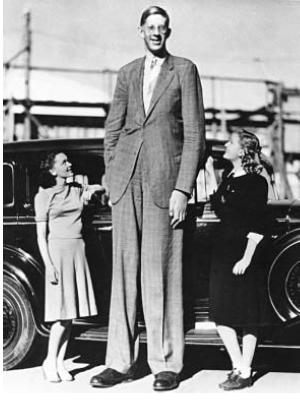
Use the four-step procedure for solving variation problems given on page 445 to solve Exercises 21–36.If all men had identical body types, their weight would vary directly as the cube of their height. Shown below is Robert Wadlow, who reached a record height of 8 feet 11 inches (107 inches)
In Exercises 17–32, divide using synthetic division. (3x² + 7x 20)+ (x + 5) -
Solve each polynomial inequality in Exercises 1–42 and graph the solution set on a real number line. Express each solution set in interval notation. x² - 4x ≥ 0
In Exercises 17–32, divide using synthetic division. x4 - 256 x - 4
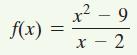
In Exercises 21–36, find the vertical asymptotes, if any, and the values of x corresponding to holes, if any, of the graph of each rational function. f(x) x²-9 x - 3
Solve each polynomial inequality in Exercises 1–42 and graph the solution set on a real number line. Express each solution set in interval notation. (x - 1)(x-2)(x − 3) ≥ 0
In Exercises 19–24,a. Use the Leading Coefficient Test to determine the graph’s end behavior.b. Determine whether the graph has y-axis symmetry, origin symmetry, or neither.c. Graph the function.f(x) = x3 - x2 - 9x + 9
In Exercises 25–32, find an nth-degree polynomial function with real coefficients satisfying the given conditions. If you are using a graphing utility, use it to graph the function and verify the real zeros and the given function value. n = 4; i and 3i are zeros; f(-1) = 20
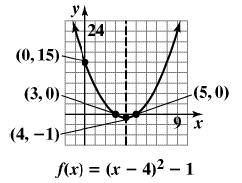
Use a graphing utility to verify any five of your hand-drawn graphs in Exercises 17–38.17.18.19.20.21. (0, 15). (3,0). (4, -1)- YA 24 -(5,0) f(x) = (x-4)²-1
In Exercises 17–38, use the vertex and intercepts to sketch the graph of each quadratic function. Give the equation of the parabola’s axis of symmetry. Use the graph to determine the function’s domain and range.f(x) = 2x2 - 7x - 4
In Exercises 30–31, divide using synthetic division. (3x4 + 11x³ - 20x² + 7x + 35). ÷ - (x + 5)
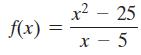
In Exercises 21–36, find the vertical asymptotes, if any, and the values of x corresponding to holes, if any, of the graph of each rational function. f(x) x² - 25 x - 5
Solve each polynomial inequality in Exercises 1–42 and graph the solution set on a real number line. Express each solution set in interval notation. (x + 1)(x + 2)(x + 3) ≥ 0
In Exercises 17–32, divide using synthetic division. 7 x² - 128 x-2
In Exercises 19–24, use the Leading Coefficient Test to determine the end behavior of the graph of the polynomial function.f(x) = 5x3 + 7x2 - x + 9
In Exercises 21–36, find the vertical asymptotes, if any, and the values of x corresponding to holes, if any, of the graph of each rational function. g(x) = x - 3 2-9
In Exercises 25–26, find an nth-degree polynomial function with real coefficients satisfying the given conditions.n = 4; 2 (with multiplicity 2) and 3i are zeros; f(0) = 36
In Exercises 25–32, find the zeros for each polynomial function and give the multiplicity for each zero. State whether the graph crosses the x-axis, or touches the x-axis and turns around, at each zero.f(x) = x3 - 2x2 + x
In Exercises 25–32, find an nth-degree polynomial function with real coefficients satisfying the given conditions. If you are using a graphing utility, use it to graph the function and verify the real zeros and the given function value. n = 4; −2, – 1⁄, and i are zeros; f(1) = 18
In Exercises 17–32, divide using synthetic division. 2x53x4+x³x² + 2x - 1 x + 2
In Exercises 27–29, divide using long division.(4x4 + 6x3 + 3x - 1) , (2x2 + 1)
Solve each polynomial inequality in Exercises 1–42 and graph the solution set on a real number line. Express each solution set in interval notation. x(3x)(x - 5) ≤ 0
In Exercises 30–31, divide using synthetic division. (3x42x²10x) = (x - 2)
In Exercises 25–32, find the zeros for each polynomial function and give the multiplicity for each zero. State whether the graph crosses the x-axis, or touches the x-axis and turns around, at each zero.f(x) = x3 + 4x2 + 4x
In Exercises 17–38, use the vertex and intercepts to sketch the graph of each quadratic function. Give the equation of the parabola’s axis of symmetry. Use the graph to determine the function’s domain and range.f(x) = 2x - x2 + 3
In Exercises 25–32, find an nth-degree polynomial function with real coefficients satisfying the given conditions. If you are using a graphing utility, use it to graph the function and verify the real zeros and the given function value. n = 4; -2, 5, and 3 + 2i are zeros; f(1) = -96
In Exercises 33–38, use Descartes’s Rule of Signs to determine the possible number of positive and negative real zeros for each given function. f(x) = 2x³ + x² = x + 7
Use the four-step procedure for solving variation problems given on page 445 to solve Exercises 21–36.The illumination provided by a car’s headlight varies inversely as the square of the distance from the headlight. A car’s headlight produces an illumination of 3.75 foot-candles at a distance
In Exercises 25–32, find the zeros for each polynomial function and give the multiplicity for each zero. State whether the graph crosses the x-axis, or touches the x-axis and turns around, at each zero.f(x) = x3 + 7x2 - 4x - 28
In Exercises 17–38, use the vertex and intercepts to sketch the graph of each quadratic function. Give the equation of the parabola’s axis of symmetry. Use the graph to determine the function’s domain and range.f(x) = 5 - 4x - x2
Use the four-step procedure for solving variation problems given on page 445 to solve Exercises 21–36.Body-mass index, or BMI, takes both weight and height into account when assessing whether an individual is underweight or overweight. BMI varies directly as one’s weight, in pounds, and
In your own words, state the Division Algorithm.
What is a polynomial inequality?
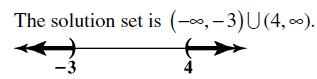
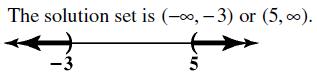
Use a graphing utility to verify your solution sets to any three of the rational inequalities that you solved algebraically in Exercises 43–60.Data from Exercise 43-6043.44.45. The solution set is (-, -3)U(4,0). -3
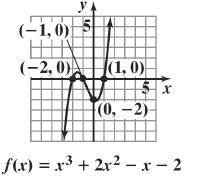
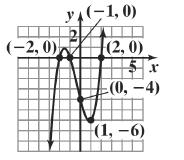
Use a graphing utility to verify any five of the graphs that you drew by hand in Exercises 41–64.Data from Exercise 41-6441.42.43.44.45. 少年 (-1,0) 5 出 (-2,0) (1, 0) 5x (0, -2) f(x) = x² + 2x2-x-2
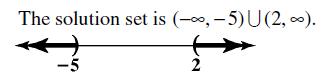
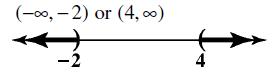
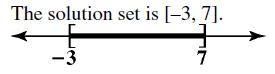
Use a graphing utility to verify your solution sets to any three of the polynomial inequalities that you solved algebraically in Exercises 1–42.Data from Exercise 1-421.2.3. (-, -2) or (4,00) -2
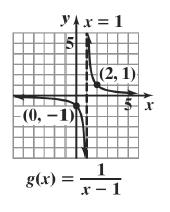
Use a graphing utility to verify any five of your hand-drawn graphs in Exercises 45–88.Data from Exercise 45-8845.46.47.48.49. YAx=1 - 10,-1) A g(x) = (2, 1) 1 x-] 1
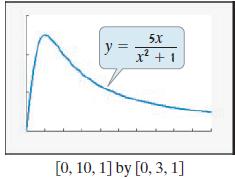
A drug is injected into a patient and the concentration of the drug in the bloodstream is monitored. The drug’s concentration, C(t), in milligrams per liter, after t hours is modeled byThe graph of this rational function, obtained with a graphing utility, is shown in the figure.a. Use the graph
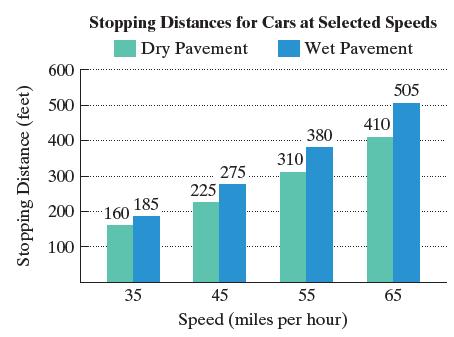
In Exercises 94–97, determine whether each statement makes sense or does not make sense, and explain your reasoning.Because it takes me longer to come to a stop on a wet road than on a dry road, graph (a) for Exercises 77–78 is the model for stopping distances on wet pavement and graph (b) is
In Exercises 1–5, graph f and g in the same rectangular coordinate system. Graph and give equations of all asymptotes. Give each function’s domain and range. f(x) = log₁ x and g(x) = −2 log₁ x
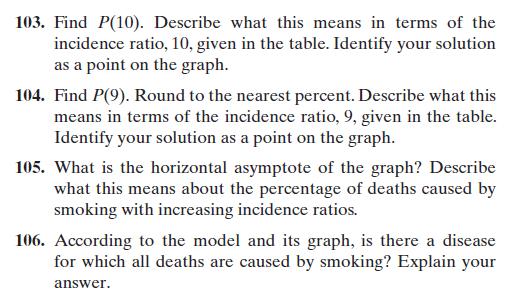
Although your friend has a family history of heart disease, he smokes, on average, 25 cigarettes per day. He sees the table showing incidence ratios for heart disease (see Exercises 103–106) and feels comfortable that they are less than 2, compared to 9 and 10 for lung cancer. He claims that all
What is a rational inequality?
In Exercises 98–99, use a graphing utility to graph f and g in the same viewing rectangle. Then use the Zoom out feature to show that f and g have identical end behavior.f(x) = x3 - 6x + 1, g(x) = x3
Showing 6000 - 6100
of 13634
First
54
55
56
57
58
59
60
61
62
63
64
65
66
67
68
Last
Step by Step Answers