New Semester
Started
Get
50% OFF
Study Help!
--h --m --s
Claim Now
Question Answers
Textbooks
Find textbooks, questions and answers
Oops, something went wrong!
Change your search query and then try again
S
Books
FREE
Study Help
Expert Questions
Accounting
General Management
Mathematics
Finance
Organizational Behaviour
Law
Physics
Operating System
Management Leadership
Sociology
Programming
Marketing
Database
Computer Network
Economics
Textbooks Solutions
Accounting
Managerial Accounting
Management Leadership
Cost Accounting
Statistics
Business Law
Corporate Finance
Finance
Economics
Auditing
Tutors
Online Tutors
Find a Tutor
Hire a Tutor
Become a Tutor
AI Tutor
AI Study Planner
NEW
Sell Books
Search
Search
Sign In
Register
study help
mathematics
college algebra graphs and models
College Algebra With Modeling And Visualization 6th Edition Gary Rockswold - Solutions
The length of a rectangle exceeds the width by 13 yards. If the perimeter of the rectangle is 82 yards, what are its dimensions?
For Exercises 149–152, assume that (a, b) is a point on the graph of f. What is the corresponding point on the graph of each of the following functions?y = f(-x)
Multiply and write the product in standard form: (3 - 7i)(5 + 2i).
For Exercises 149–152, assume that (a, b) is a point on the graph of f. What is the corresponding point on the graph of each of the following functions?y = 2f(x)
For Exercises 149–152, assume that (a, b) is a point on the graph of f. What is the corresponding point on the graph of each of the following functions?y = f(x - 3)
Exercises 156–158 will help you prepare for the material covered in the next section.In Exercises 156–157, perform the indicated operation or operations.(2x - 1)(x2 + x - 2)
For Exercises 149–152, assume that (a, b) is a point on the graph of f. What is the corresponding point on the graph of each of the following functions?y = f(x) - 3
Exercises 156–158 will help you prepare for the material covered in the next section.In Exercises 156–157, perform the indicated operation or operations.(f(x))2 - 2f(x) + 6, where f(x) = 3x - 4
Graph y1 = x2 - 2x, y2 = x, and y3 = y1 , y2 in the same [-10, 10, 1] by [-10, 10, 1] viewing rectangle. Then use the TRACE feature to trace along y3. What happens at x = 0? Explain why this occurs.
In Exercises 107–118, begin by graphing the cube root function, f(x) = 3√x. Then use transformations of this graph to graph the given function. g(x) = √√x - 2 X
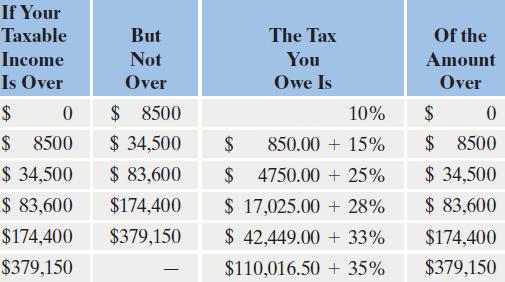
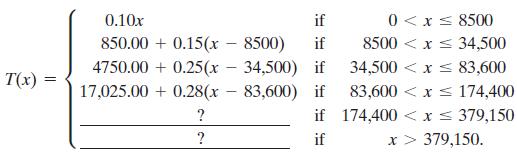
In Exercises 109–110, refer to the preceding tax table.Here is the Federal Tax Rate Schedule X that specifies the tax owed by a single taxpayer for a recent year.The preceding tax table can be modeled by a piecewise function, where x represents the taxable income of a single taxpayer and T(x) is
In Exercises 105–108, you will be developing functions that model given conditions.A chemist working on a flu vaccine needs to mix a 10% sodium-iodine solution with a 60% sodium-iodine solution to obtain a 50-milliliter mixture. Write the amount of sodium iodine in the mixture, S, in milliliters,
In Exercises 107–108, write the standard form of the equation of the circle with the given center and radius.Center (-2, 4), r = 6
In Exercises 105–108, determine whether each statement makes sense or does not make sense, and explain your reasoning.The federal minimum wage was $5.15 per hour from 1997 through 2006, so f(x) = 5.15 models the minimum wage, f(x), in dollars, for the domain {1997, 1998, 1999,c, 2006}.
Graph y1 = √2 - x, y2 = √x, and y3 = √2 - y2 in the same [-4, 4, 1] by [0, 2, 1] viewing rectangle. If y1 represents f and y2 represents g, use the graph of y3 to find the domain of f ° g. Then verify your observation algebraically.
In Exercises 109–111, give the center and radius of each circle and graph its equation. Use the graph to identify the relation’s domain and range. x² + y² = 1
What is a relation? Describe what is meant by its domain and its range.
In Exercises 107–118, begin by graphing the cube root function, f(x) = 3√x. Then use transformations of this graph to graph the given function. g(x) = نیا √x + 2
In Exercises 109–112, determine whether each statement is true or false. If the statement is false, make the necessary change(s) to produce a true statement.The equation y = mx + b shows that no line can have a y-intercept that is numerically equal to its slope.
In Exercises 109–110, refer to the preceding tax table. Here is the Federal Tax Rate Schedule X that specifies the tax owed by a single taxpayer for a recent year.The preceding tax table can be modeled by a piecewise function, where x represents the taxable income of a single taxpayer and T(x) is
Explain how to determine whether a relation is a function. What is a function?
You invested $80,000 in two accounts paying 5% and 7% annual interest. If the total interest earned for the year was $5200, how much was invested at each rate?
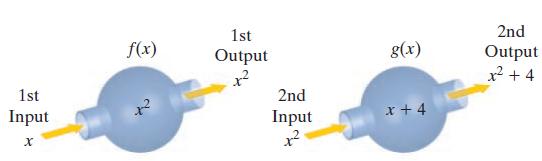
In Exercises 110–113, determine whether each statement makes sense or does not make sense, and explain your reasoning.This diagram illustrates that f(g(x)) = x2 + 4. 1st Input X f(x) 1st Output x² 2nd Input 1² g(x) x + 4 2nd Output x²+4
How do you determine if an equation in x and y defines y as a function of x?
In Exercises 110–113, determine whether each statement makes sense or does not make sense, and explain your reasoning.I have two functions. Function f models total world population x years after 2000 and function g models population of the world’s more-developed regions x years after 2000. I
In Exercises 109–112, determine whether each statement is true or false. If the statement is false, make the necessary change(s) to produce a true statement. The graph of the linear function 5x + 6y 30 = 0 is a line passing through the point (6, 0) with slope -/. 5
In Exercises 109–111, give the center and radius of each circle and graph its equation. Use the graph to identify the relation’s domain and range. x² + y² - 4x + 2y = 4 = 0 -
In Exercises 107–118, begin by graphing the cube root function, f(x) = 3√x. Then use transformations of this graph to graph the given function. 2 + x^² = (x)y x,
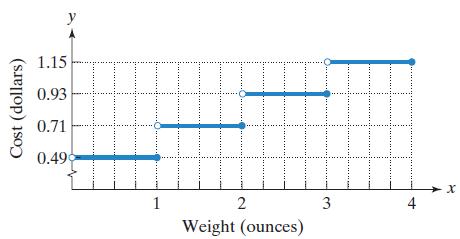
The figure shows the cost of mailing a first-class letter, f(x), as a function of its weight, x, in ounces, for a recent year. Use the graph to solve Exercises 111–114.Find f(3.5). What does this mean in terms of the variables in this situation? Cost (dollars) y 1.15 0.93 0.71 0.49 1 2 Weight
In Exercises 110–113, determine whether each statement makes sense or does not make sense, and explain your reasoning.I must have made a mistake in finding the composite functions f ° g and g ° f, because I notice that f ° g is not the same function as g ° f.
Does f (x) mean f times x when referring to a function f ? If not, what does f (x) mean? Provide an example with your explanation.
In Exercises 109–112, determine whether each statement is true or false. If the statement is false, make the necessary change(s) to produce a true statement.The graph of x = 7 in the rectangular coordinate system is the single point (7, 0).
In Exercises 107–118, begin by graphing the cube root function, f(x) = 3√x. Then use transformations of this graph to graph the given function. Z-XAi = (x)
The figure shows the cost of mailing a first-class letter, f(x), as a function of its weight, x, in ounces, for a recent year. Use the graph to solve Exercises 111–114.What is the cost of mailing a letter that weighs 1.5 ounces? Cost (dollars) y 1.15 0.93 0.71 0.49 1 2 Weight (ounces) 3 4 X
In Exercises 107–118, begin by graphing the cube root function, f(x) = 3√x. Then use transformations of this graph to graph the given function. r(x) = x2 + 2
In Exercises 113–114, find the coefficients that must be placed in each shaded area so that the function’s graph will be a line satisfying the specified conditions.x + y - 12 = 0; y-intercept = -6; slope =1/2
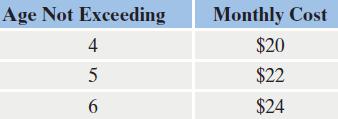
A pet insurance policy has a monthly rate that is a function of the age of the insured dog or cat. For pets whose age does not exceed 4, the monthly cost is $20. The cost then increases by $2 for each successive year of the pet’s age.The cost schedule continues in this manner for ages not
In Exercises 114–117, determine whether each statement is true or false. If the statement is false, make the necessary change(s) to produce a true statement.There can never be two functions f and g, where f ° g, for which (f ° g)(x) = (g ° f)(x).
Sharks may be scary, but they are responsible for only three deaths worldwide in 2014. The world’s deadliest creatures, ranked by the number of human deaths per year, are mosquitoes, snails, and snakes. The number of deaths by mosquitoes exceeds the number of deaths by snakes by 661 thousand. The
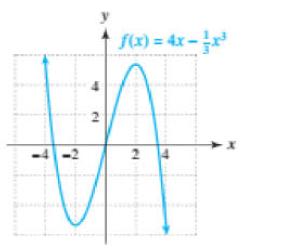
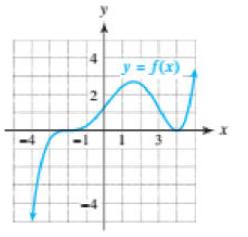
Use the graph of f(x) = 4x - 1/3x3 and translations of graphs to sketch the graph of the equation.
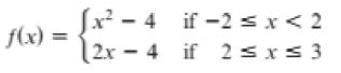
Complete the following. (a) Sketch a graph of f. (b) Determine if f is continuous on its domain. (c) Solve f(x) = 0. f(x) = [x²-4 (2x - 4 if-2 ≤ x < 2 if 2 ≤x≤3
Use synthetic division to divide the first polynomial by the second. x43x³5x² + 2x - 16 x-3
Determine any (a) Local extrema and (b) Absolute extrema. g(x) = -x³
Complete the following. (a) State the degree and leading coefficient of f. (b) State the end behavior of the graph of f. f(x) = x² - 4x³ + 3x² - 3
Determine graphically any (a) Local extrema and (b) Absolute extrema. f(x) = x² = 2x² + 1 x4 -
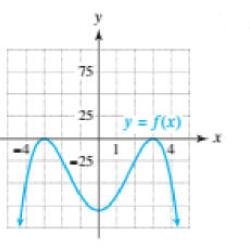
The graph of either a cubic, quartic, or quintic polynomial f(x) with integer zeros is shown. Write the complete factored form of f(x). 75 25 y = f(x) I
Use the remainder theorem to find the remainder when f(x) is divided by the given x - k. f(x) = 5x²-3x + 1 x-1
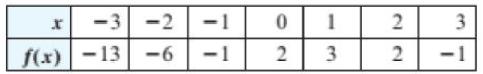
The data on the next page are modeled exactly by a linear, quadratic, cubic, or quartic function f with leading coefficient a. All zeros of f are real numbers located in the interval [-3,3]. (a) Make a line graph of the data. (b) State the minimum degree of f. (c) Is a > 0 or is a (d) Find a
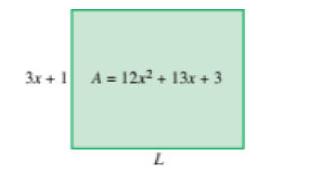
Use the figure to find the length L of the rectangle from its width and area A. Determine the value of L when x = 10 feet. 3x + 1 A = 12x² + 13x + 3 L
For each f(x), complete the following. (a) Find the x- and y-intercepts. (b) Determine the multiplicity of each zero of f. (c) Sketch a graph of y = f(x) by hand. f(x) = (x - 1)(x + 2)
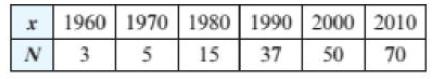
The table lists the number N (in thousands) of Americans over 100 years old for selected years x.(a) Use regression to find a polynomial of degree 3 that models the data. Let x = 0 correspond to 1960. (b) Graph f and the data. (c) Estimate N in 1994 and in 2020. (d) Did your estimates in part
Estimate the intervals where the graph of f is concave upward and where the graph is concave downward. Use interval notation. t 2 9
Solve the equation graphically. Round your answers to the nearest hundredth. x³1.1x² 5.9x + 0.7 = 0
Solve the equation. Find all real solutions. x6 = 7x³ + 8
Describe ways to determine if a polynomial function is odd, even, or neither. Give examples.
Solve the equation graphically. Round your answers to the nearest hundredth. -0.7x³2x² + 4x + 2.5 = 0
Solve the equation graphically. Round your answers to the nearest hundredth. 3x³ 46x² + 180x - 99 = 0
Solve the equation graphically. Round your answers to the nearest hundredth. 2x1.5x³+13= 24x² + 10x
Solve the equation graphically. Round your answers to the nearest hundredth. -x4 + 2x³ + 20x² = 22x + 41
Discuss possible local extrema and absolute extrema on the graph of f. Assume that a > 0. f(x) = ax² + bx + c
Discuss possible local extrema and absolute extrema on the graph of f. Assume that a > 0. f(x) = ax³ + bx² + cx + d
Determine any (a) Local extrema and (b) Absolute extrema. g(x) = -2(x + 3)² + 4
Determine any (a) Local extrema and (b) Absolute extrema. g(x)=(x-1²-2
Use the factor theorem to decide if x - k is a factor of f(x) for the given k. f(x) = x³ + x² - 14x - 24 k = -3
Use the factor theorem to decide if x - k is a factor of f(x) for the given k. f(x) = x² - 2x³ - 13x² - 10x k = 3
Use division to express the (Dividend) as (Divisor)(Quotient) + (Remainder). 2x³ + x² = x +4 x² + x
Determine any (a) Local extrema and (b) Absolute extrema. g(x) = 2x²-3x + 1
Complete the following. (a) State the degree and leading coefficient of f. (b) State the end behavior of the graph of f. f(x)=-4+x-5x²
Use synthetic division to divide the first polynomial by the second. x³ + 2x² - 17x - 10 x+5
Complete the following. (a) State the degree and leading coefficient of f. (b) State the end behavior of the graph of f. f(x) = 3x² - 4x + 7
Complete the following. (a) State the degree and leading coefficient of f. (b) State the end behavior of the graph of f. f(x) = 2x³x² + 4x
Use the factor theorem to decide if x - k is a factor of f(x) for the given k. f(x) = 2x4 - 11x³ + 9x² + 14x k = 1/2
Determine any (a) Local extrema and (b) Absolute extrema. g(x) = 3x² + 4x = 1 -
Use synthetic division to divide the first polynomial by the second. x³ - 2x + 1 x +4
Determine any (a) Local extrema and (b) Absolute extrema. g(x) = |x + 3|
Complete the following. (a) State the degree and leading coefficient of f. (b) State the end behavior of the graph of f. f(x) = 9x³ - 2x + 4
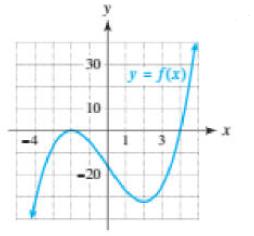
The graph of a polynomial f(x) is shown in the figure. Estimate the integer zeros and state whether their multiplicities are odd or even. State the minimum degree of f(x). 2 7 _y=f(x) 1 3 X
Use synthetic division to divide the first polynomial by the second. 3x³-11x² 20x + 3 x-5
Determine any (a) Local extrema and (b) Absolute extrema. g(x) = -x + 2
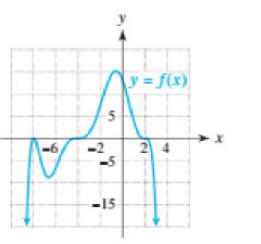
The graph of a polynomial f(x) is shown in the figure. Estimate the integer zeros and state whether their multiplicities are odd or even. State the minimum degree of f(x). -6 -2 -5 -15 y = f(x) 24
Determine any (a) Local extrema and (b) Absolute extrema. XA = (x)8
Complete the following. (a) State the degree and leading coefficient of f. (b) State the end behavior of the graph of f. f(x) = -x² - 3x² + 5
Complete the following. (a) State the degree and leading coefficient of f. (b) State the end behavior of the graph of f. f(x) = 7x + x² - 5
Use synthetic division to divide the first polynomial by the second. x²-3x³-4x² + 12x x-2
Use synthetic division to divide the first polynomial by the second. x² + 2x²x³ = 2x² + 2x +4 x+2
Use synthetic division to divide the first polynomial by the second. x³ + x² + 2x + 2 x+1
Determine graphically any (a) Local extrema and (b) Absolute extrema. g(x) = 3x-x
Complete the following. (a) State the degree and leading coefficient of f. (b) State the end behavior of the graph of f. f(x)=x²-x²³-4
Determine graphically any (a) Local extrema and (b) Absolute extrema. f(x) = −3x² + 8x³ + 6x² - 24x
Write a polynomial f(x) in complete factored form that satisfies the conditions. Let the leading coefficient be 1.Degree 3; zeros: -1 with multiplicity 2, and 6 with multiplicity 1
Determine graphically any (a) Local extrema and (b) Absolute extrema. g(x) = 1 1 + |x|
Use synthetic division to divide the first polynomial by the second. x² - 2x³ + 2x² - 5x x-2
Determine graphically any (a) Local extrema and (b) Absolute extrema. f(x) = -x + 4x² - 4x²
Use synthetic division to divide the first polynomial by the second. 4 − x³ + 4x + 3 2x³ - - x² x + 1/{
Write a polynomial f(x) in complete factored form that satisfies the conditions. Let the leading coefficient be 1.Degree 4; zeros: 5 and 7, both with multiplicity 2
Complete the following. (a) State the degree and leading coefficient of f. (b) State the end behavior of the graph of f. f(x) = 0.1x52x² - 3x + 4
The graph of either a cubic, quartic, or quintic polynomial f(x) with integer zeros is shown. Write the complete factored form of f(x). -30 10 -20 y = f(x) 1 3
Write a polynomial f(x) in complete factored form that satisfies the conditions. Let the leading coefficient be 1.Degree 4; zeros: 2 with multiplicity 3, and 6 with multiplicity 1
Complete the following. (a) State the degree and leading coefficient of f. (b) State the end behavior of the graph of f. f(x) = 3x³-2-x²
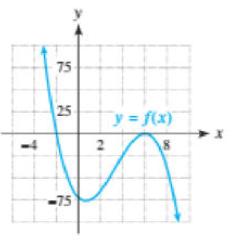
The graph of either a cubic, quartic, or quintic polynomial f(x) with integer zeros is shown. Write the complete factored form of f(x). L 75 25 -75 2 y = f(x) 18 X
Showing 9500 - 9600
of 13634
First
89
90
91
92
93
94
95
96
97
98
99
100
101
102
103
Last
Step by Step Answers