New Semester
Started
Get
50% OFF
Study Help!
--h --m --s
Claim Now
Question Answers
Textbooks
Find textbooks, questions and answers
Oops, something went wrong!
Change your search query and then try again
S
Books
FREE
Study Help
Expert Questions
Accounting
General Management
Mathematics
Finance
Organizational Behaviour
Law
Physics
Operating System
Management Leadership
Sociology
Programming
Marketing
Database
Computer Network
Economics
Textbooks Solutions
Accounting
Managerial Accounting
Management Leadership
Cost Accounting
Statistics
Business Law
Corporate Finance
Finance
Economics
Auditing
Tutors
Online Tutors
Find a Tutor
Hire a Tutor
Become a Tutor
AI Tutor
AI Study Planner
NEW
Sell Books
Search
Search
Sign In
Register
study help
mathematics
college algebra graphs and models
College Algebra 7th Edition Robert F Blitzer - Solutions
In Exercises 109–111, give the center and radius of each circle and graph its equation. Use the graph to identify the relation’s domain and range. (x + 2) + (y - 3) = 9
In Exercises 107–118, begin by graphing the cube root function, f(x) = 3√x. Then use transformations of this graph to graph the given function. r(x) = √x + 22
In Exercises 107–108, write the standard form of the equation of the circle with the given center and radius.Center (0, 0), r = 3
In Exercises 113–114, find the coefficients that must be placed in each shaded area so that the function’s graph will be a line satisfying the specified conditions.x + y - 12 = 0; x-intercept = -2; y-intercept = 4
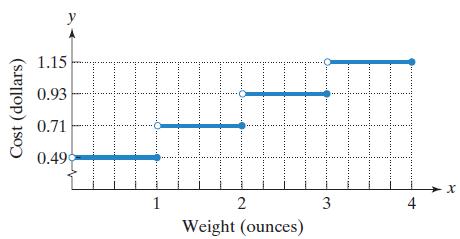
The figure shows the cost of mailing a first-class letter, f(x), as a function of its weight, x, in ounces, for a recent year. Use the graph to solve Exercises 111–114.What is the cost of mailing a letter that weighs 1.8 ounces? Cost (dollars) y 1.15 0.93 0.71 0.49 1 2 Weight (ounces) 3 4 X
Describe the values of x that must be excluded from the domain of (f ° g)(x).
The figure shows the cost of mailing a first-class letter, f(x), as a function of its weight, x, in ounces, for a recent year. Use the graph to solve Exercises 111–114.Find f(3). What does this mean in terms of the variables in this situation? Cost (dollars) y 1.15 0.93 0.71 0.49 1 2 Weight
In Exercises 105–108, determine whether each statement makes sense or does not make sense, and explain your reasoning.Because the variable m does not appear in Ax + By + C = 0, equations in this form make it impossible to determine the line’s slope.
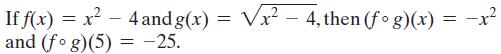
In Exercises 114–117, determine whether each statement is true or false. If the statement is false, make the necessary change(s) to produce a true statement. If f(x)=x²-4 and (fog)(5) = -25. and g(x) = √x²-4, then (fog)(x) = -x²
Prove that the equation of a line passing through (a, 0) and (0, b) (a ∙ 0, b ∙ 0) can be written in the formWhy is this called the intercept form of a line? x y a + = 1. b
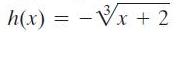
In Exercises 107–118, begin by graphing the cube root function, f(x) = 3√x. Then use transformations of this graph to graph the given function. h(x) = -√x + 2
In Exercises 110–113, determine whether each statement makes sense or does not make sense, and explain your reasoning.I used a function to model data from 1990 through 2015. The independent variable in my model represented the number of years after 1990, so the function’s domain was {x x = 0,
In Exercises 107–118, begin by graphing the cube root function, f(x) = 3√x. Then use transformations of this graph to graph the given function. g(x) = √-x-2
In Exercises 109–112, determine whether each statement is true or false. If the statement is false, make the necessary change(s) to produce a true statement.Every line in the rectangular coordinate system has an equation that can be expressed in slope-intercept form.
In Exercises 107–118, begin by graphing the cube root function, f(x) = 3√x. Then use transformations of this graph to graph the given function. h(x) = -√x - 2
In Exercises 107–118, begin by graphing the cube root function, f(x) = 3√x. Then use transformations of this graph to graph the given function. 2 + X-A = (x)8
Explain how the vertical line test is used to determine whether a graph represents a function.
In Exercises 114–117, determine whether each statement is true or false. If the statement is false, make the necessary change(s) to produce a true statement.If f(7) = 5 and g(4) = 7, then (f ° g)(4) = 35.
Excited about the success of celebrity stamps, post office officials were rumored to have put forth a plan to institute two new types of thermometers. On these new scales, °E represents degrees Elvis and °M represents degrees Madonna. If it is known that 40°E = 25°M, 280°E = 125°M, and
What does it mean if a function f is increasing on an interval?
Suppose that a function f whose graph contains no breaks or gaps on (a, c) is increasing on (a, b), decreasing on (b, c), and defined at b. Describe what occurs at x = b. What does the function value f(b) represent?
Prove that if f and g are even functions, then fg is also an even function.
In Exercises 114–117, determine whether each statement is true or false. If the statement is false, make the necessary change(s) to produce a true statement.If f(x) = √x and g(x) = 2x - 1, then (f ° g)(5) = g(2).
Given an equation in x and y, how do you determine if its graph is symmetric with respect to the y-axis?
In 1994, there were 714 violent crime incidents per 100,000 Americans. For the period from 1994 through 2014, this number decreased by approximately 17 incidents per 100,000 people each year. If this trend continues, by which year will violent crime incidents decrease to 289 per 100,000 people?
In Exercises 118–121, determine whether each statement makes sense or does not make sense, and explain your reasoning.My body temperature is a function of the time of day.
Given an equation in x and y, how do you determine if its graph is symmetric with respect to the x-axis?
Define two functions f and g so that f ° g = g ° f.
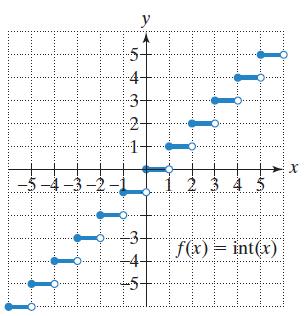
In Exercises 119–122, use transformations of the graph of the greatest integer function, f(x) = int(x), to graph each function. (The graph of f(x) = int(x) is shown in Figure 2.27Figure 2.27 -5-4-3-2-1 10 543 1 y 2 3 4 |||| f(x) = int(x) X
In Exercises 119–122, use transformations of the graph of the greatest integer function, f(x) = int(x), to graph each function. (The graph of f(x) = int(x) is shown in Figure 2.27 -5-4-3-2-1 10 543 1 y 2 3 4 |||| f(x) = int(x) X
Solve and check: x 1 5 x + 3 2 = 1- X
In Exercises 119–120, solve and graph the solution set on a number line. x + 3 4 > x-2 = 3 +1
In Exercises 119–120, solve and graph the solution set on a number line. 3|2x + 6-9 < 15
In Exercises 119–122, use transformations of the graph of the greatest integer function, f(x) = int(x), to graph each function. (The graph of f(x) = int(x) is shown in Figure 2.27 -5-4-3-2-1 10 543 1 y 2 3 4 |||| f(x) = int(x) X
In Exercises 119–122, use transformations of the graph of the greatest integer function, f(x) = int(x), to graph each function. (The graph of f(x) = int(x) is shown in Figure 2.27 -5-4-3-2-1 10 543 1 y 2 3 4 |||| f(x) = int(x) X
In Exercises 118–121, determine whether each statement makes sense or does not make sense, and explain your reasoning.Using f (x) = 3x + 2, I found f (50) by applying the distributive property to (3x + 2)50.
Given an equation in x and y, how do you determine if its graph is symmetric with respect to the origin?
Exercises 121–123 will help you prepare for the material covered in the next section.Write the slope-intercept form of the equation of the line passing through (-3, 1) whose slope is the same as the line whose equation is y = 2x + 1.
In Exercises 118–121, determine whether each statement makes sense or does not make sense, and explain your reasoning.I graphed a function showing how paid vacation days depend on the number of years a person works for a company. The domain was the number of paid vacation days.
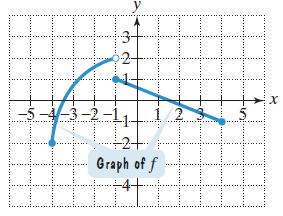
Use the graph of f to determine whether each statement in Exercises 122–125 is true or false.The domain of f is [-4, -1) ∪ (-1, 4]. -5-4-3-2. 32 y 2 3 +2+ Graph of f H HTT HE X
The toll to a bridge costs $6.00. Commuters who frequently use the bridge have the option of purchasing a monthly discount pass for $30.00. With the discount pass, the toll is reduced to $4.00. For how many bridge crossings per month will the cost without the discount pass be the same as the cost
If you are given a function’s graph, how do you determine if the function is even, odd, or neither?
Exercises 121–123 will help you prepare for the material covered in the next section.Write an equation in general form of the line passing through (3, -5) whose slope is the negative reciprocal (the reciprocal with the opposite sign) of - 1/4.
In Exercises 118–121, determine whether each statement makes sense or does not make sense, and explain your reasoning.I graphed a function showing how the average number of annual physician visits depends on a person’s age. The domain was the average number of annual physician visits.
Solve for y: Ax + By = Cy + D.
If you are given a function’s equation, how do you determine if the function is even, odd, or neither?
Exercises 121–123 will help you prepare for the material covered in the next section.If f(x) = x2, findwhere x1 = 1 and x2 = 4. f(x₂) - f(x₁) 1x - 7x
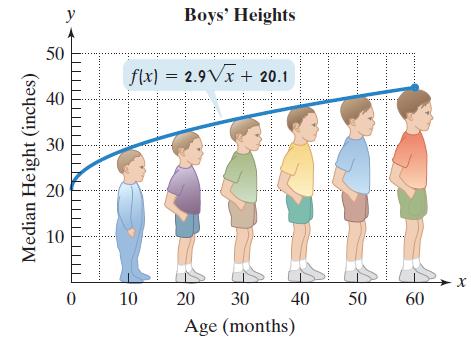
The function f(x) = 2.9√x + 20.1 models the median height, f(x), in inches, of boys who are x months of age. The graph of f is shown.a. Describe how the graph can be obtained using transformations of the square root function f(x) = √x.b. According to the model, what is the median height of boys
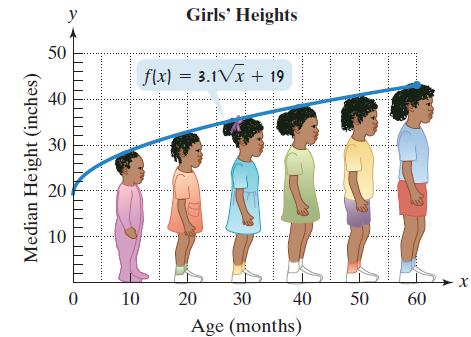
The function f(x) = 3.1√x + 19 models the median height, f(x), in inches, of girls who are x months of age. The graph of f is shown.a. Describe how the graph can be obtained using transformations of the square root function f(x) = √x.b. According to the model, what is the median height of girls
Exercises 123–125 will help you prepare for the material covered in the next section. 5 Solve for y: x = = + 4. y
Use the graph of f to determine whether each statement in Exercises 122–125 is true or false.The range of f is [-2, 2]. -5-4-3-2. 32 y 2 3 +2+ Graph of f H HTT HE X
Use the graph of f to determine whether each statement in Exercises 122–125 is true or false.f (-1) - f (4) = 2 -5-4-3-2. 32 y 2 3 +2+ Graph of f H HTT HE X
Exercises 123–125 will help you prepare for the material covered in the next section. Solve for y: x = y² - 1, y = 0.
In Exercises 126–131, use a graphing utility to graph each function. Use a [-5, 5, 1] by [-5, 5, 1] viewing rectangle. Then find the intervals on which the function is increasing, decreasing, or constant. f(x) = x³ 6x² + 9x + 1
In Exercises 126–131, use a graphing utility to graph each function. Use a [-5, 5, 1] by [-5, 5, 1] viewing rectangle. Then find the intervals on which the function is increasing, decreasing, or constant. g(x) = 4x²
Use the graph of f to determine whether each statement in Exercises 122–125 is true or false.f (0) = 2.1 -5-4-3-2. 32 y 2 3 +2+ Graph of f H HTT HE X
In Exercises 126–131, use a graphing utility to graph each function. Use a [-5, 5, 1] by [-5, 5, 1] viewing rectangle. Then find the intervals on which the function is increasing, decreasing, or constant. h(x) = x 2 + x + 2]
In Exercises 126–131, use a graphing utility to graph each function. Use a [-5, 5, 1] by [-5, 5, 1] viewing rectangle. Then find the intervals on which the function is increasing, decreasing, or constant. x = N g(x)
In Exercises 126–131, use a graphing utility to graph each function. Use a [-5, 5, 1] by [-5, 5, 1] viewing rectangle. Then find the intervals on which the function is increasing, decreasing, or constant. f(x) = x²(x - 4)
The function f(x) = -0.00002x3 + 0.008x2 - 0.3x + 6.95 models the number of annual physician visits, f(x), by a person of age x. Graph the function in a [0, 100, 5] by [0, 40, 2] viewing rectangle. What does the shape of the graph indicate about the relationship between one’s age and the number
Exercises 123–125 will help you prepare for the material covered in the next section.Consider the function defined by {(-2, 4), (-1, 1), (1, 1), (2, 4)}. Reverse the components of each ordered pair and write the resulting relation. Is this relation a function?
In Exercises 126–131, use a graphing utility to graph each function. Use a [-5, 5, 1] by [-5, 5, 1] viewing rectangle. Then find the intervals on which the function is increasing, decreasing, or constant. h(x) = 2.
a. Graph the functions f(x) = xn for n = 2, 4, and 6 in a [-2, 2, 1] by [-1, 3, 1] viewing rectangle.b. Graph the functions f(x) = xn for n = 1, 3, and 5 in a [-2, 2, 1] by [-2, 2, 1] viewing rectangle.c. If n is positive and even, where is the graph of f(x) = xn increasing and where is it
If f (x + y) = f (x) + f (y) and f(1) = 3, find f (2), f (3), and f (4). Is f (x + y) = f (x) + f (y) for all functions?
Give an example of a relation with the following characteristics: The relation is a function containing two ordered pairs. Reversing the components in each ordered pair results in a relation that is not a function.
Solve and check: -1 + 3 (x - 4) = 2x.
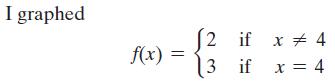
In Exercises 133–136, determine whether each statement makes sense or does not make sense, and explain your reasoning.and one piece of my graph is a single point. I graphed f(x) = 2 if if 3 if x 4 x = 4
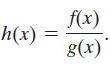
Suppose that The function f can be even, odd, or neither. The same is true for the function g.a. Under what conditions is h definitely an even function?b. Under what conditions is h definitely an odd function? h(x) = f(x) g(x)
What must be done to a function’s equation so that its graph is shifted vertically upward?
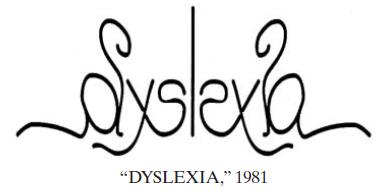
In Exercises 133–136, determine whether each statement makes sense or does not make sense, and explain your reasoning.This work by artist Scott Kim (1955–) has the same kind of symmetry as an even function. Qysh "DYSLEXIA," 1981
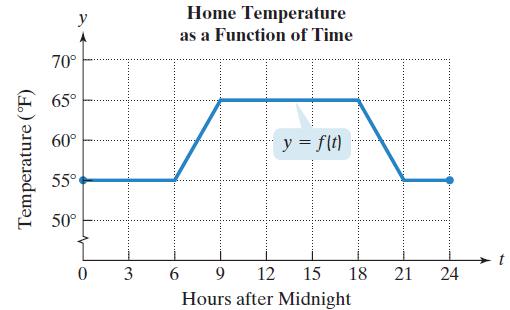
The graph illustrates home temperature, f(t), as a function of hours after midnight, t.In Exercises 137–140, determine whether each statement makes sense or does not make sense, and explain your reasoning. If the statement makes sense, graph the new function on the domain [0, 24]. If the
Exercises 132–134 will help you prepare for the material covered in the next section.The function C(t) = 20 + 0.40 (t - 60) describes the monthly cost, C(t), in dollars, for a cellphone plan for t calling minutes, where t > 60. Find and interpret C(100).
What must be done to a function’s equation so that its graph is shifted horizontally to the right?
What must be done to a function’s equation so that its graph is reflected about the x-axis?
Exercises 132–134 will help you prepare for the material covered in the next section.Use point plotting to graph f (x) = x + 2 if x ≤ 1.
The graph illustrates home temperature, f(t), as a function of hours after midnight, t.In Exercises 137–140, determine whether each statement makes sense or does not make sense, and explain your reasoning. If the statement makes sense, graph the new function on the domain [0, 24]. If the
Exercises 132–134 will help you prepare for the material covered in the next section.Simplify: 2(x + h)2 + 3(x + h) + 5 - (2x2 + 3x + 5).
What must be done to a function’s equation so that its graph is reflected about the y-axis?
The graph illustrates home temperature, f(t), as a function of hours after midnight, t.In Exercises 137–140, determine whether each statement makes sense or does not make sense, and explain your reasoning. If the statement makes sense, graph the new function on the domain [0, 24]. If the
In Exercises 133–136, determine whether each statement makes sense or does not make sense, and explain your reasoning.My graph is decreasing on (- ∞, a) and increasing on (a, ∞), so f(a) must be a relative maximum.
The graph illustrates home temperature, f(t), as a function of hours after midnight, t.In Exercises 137–140, determine whether each statement makes sense or does not make sense, and explain your reasoning. If the statement makes sense, graph the new function on the domain [0, 24]. If the
What must be done to a function’s equation so that its graph is stretched vertically?
Exercises 143–145 will help you prepare for the material covered in the next section. If (x₁, y₁) = (-3, 1) and (x2, y2) = (-2, 4), find Y2Y1 X2X1
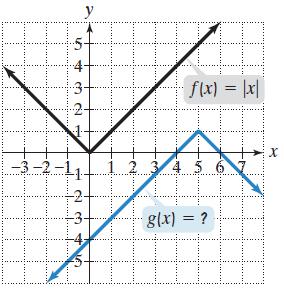
In Exercises 145–148, functions f and g are graphed in the same rectangular coordinate system. If g is obtained from f through a sequence of transformations, find an equation for g. 7 3-2-1-1 f(x) = |x| H 4 5 6 g(x) = ? LII TI X
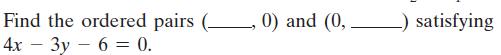
Exercises 143–145 will help you prepare for the material covered in the next section. Find the ordered pairs 4x3y6 = 0. , 0) and (0, -) satisfying
What must be done to a function’s equation so that its graph is shrunk horizontally?
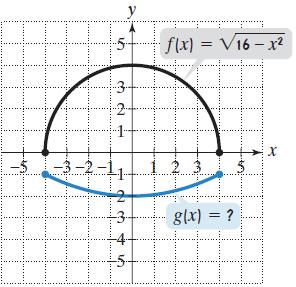
In Exercises 145–148, functions f and g are graphed in the same rectangular coordinate system. If g is obtained from f through a sequence of transformations, find an equation for g. y - flx) = V16 – x2 g(x) = ? X
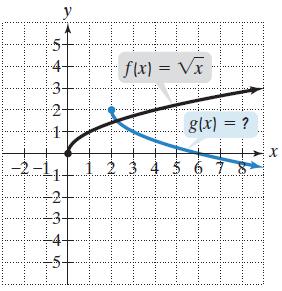
In Exercises 141–144, determine whether each statement is true or false. If the statement is false, make the necessary change(s) to produce a true statement. If f(x) = -√x and g(x) = V-x, then f and g have identical graphs.
In Exercises 133–136, determine whether each statement makes sense or does not make sense, and explain your reasoning.I noticed that the difference quotient is always zero if f(x) = c, where c is any constant.
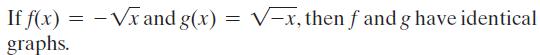
In Exercises 145–148, functions f and g are graphed in the same rectangular coordinate system. If g is obtained from f through a sequence of transformations, find an equation for g. 00000 I 00 8 15 -7-6-5-4-3-2-11- g(x) = ? y 4- 3- دن f(x) = x² X
Sketch the graph of f using the following properties. (More than one correct graph is possible.) f is a piecewise function that is decreasing on (- ∞, 2), f(2) = 0, f is increasing on (2, ∞), and the range of f is [0, ∞).
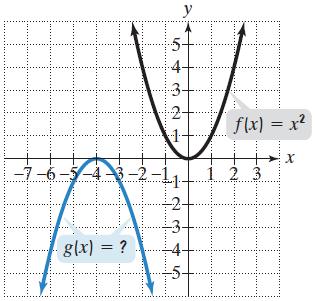
In Exercises 145–148, functions f and g are graphed in the same rectangular coordinate system. If g is obtained from f through a sequence of transformations, find an equation for g. 6.000 ننا لا V y [III] f(x)=√x LI g(x) = ? X
Solve for A: C = A + Ar.
Define a piecewise function on the intervals (- ∞, 2], (2, 5), and [5, ∞) that does not “jump” at 2 or 5 such that one piece is a constant function, another piece is an increasing function, and the third piece is a decreasing function.
Solve by the quadratic formula: 5x2 - 7x + 3 = 0.
In Exercises 141–144, determine whether each statement is true or false. If the statement is false, make the necessary change(s) to produce a true statement.If f(x) = |x| and g(x) = |x + 3| + 3, then the graph of g is a translation of the graph of f three units to the right and three units upward.
Exercises 143–145 will help you prepare for the material covered in the next section.Solve for y: 3x + 2y - 4 = 0.
In Exercises 141–144, determine whether each statement is true or false. If the statement is false, make the necessary change(s) to produce a true statement.If f(x) = x2 and g(x) = 5(x2 - 2), then the graph of g can be obtained from the graph of f by stretching f five units followed by a
In Exercises 141–144, determine whether each statement is true or false. If the statement is false, make the necessary change(s) to produce a true statement.If f(x) = x3 and g(x) = -(x - 3)3 - 4, then the graph of g can be obtained from the graph of f by moving f three units to the right,
Exercises 156–158 will help you prepare for the material covered in the next section. Simplify: 3 X 2 1
Showing 9400 - 9500
of 13634
First
88
89
90
91
92
93
94
95
96
97
98
99
100
101
102
Last
Step by Step Answers