New Semester
Started
Get
50% OFF
Study Help!
--h --m --s
Claim Now
Question Answers
Textbooks
Find textbooks, questions and answers
Oops, something went wrong!
Change your search query and then try again
S
Books
FREE
Study Help
Expert Questions
Accounting
General Management
Mathematics
Finance
Organizational Behaviour
Law
Physics
Operating System
Management Leadership
Sociology
Programming
Marketing
Database
Computer Network
Economics
Textbooks Solutions
Accounting
Managerial Accounting
Management Leadership
Cost Accounting
Statistics
Business Law
Corporate Finance
Finance
Economics
Auditing
Tutors
Online Tutors
Find a Tutor
Hire a Tutor
Become a Tutor
AI Tutor
AI Study Planner
NEW
Sell Books
Search
Search
Sign In
Register
study help
mathematics
college algebra graphs and models
College Algebra With Modeling And Visualization 6th Edition Gary Rockswold - Solutions
In Exercises 81–88,a. Find the slant asymptote of the graph of each rational function.b. Follow the seven-step strategy and use the slant asymptote to graph each rational function. f(x) = x² + 4 X
In Exercises 83–86, determine whether each statement makes sense or does not make sense, and explain your reasoning.By using the quadratic formula, I do not need to bother with synthetic division when solving polynomial equations of degree 3 or higher.
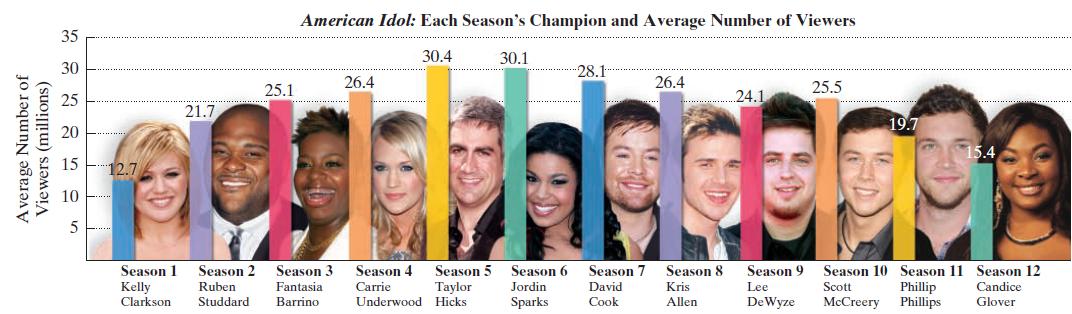
The bar graph shows the ratings of American Idol from season 1 (2002) through season 12 (2013).a. Let x represent American Idol’s season number and let y represent the average number of viewers, in millions. Use a graphing utility to draw a scatter plot of the data. Explain why a quadratic
In Exercises 81–88,a. Find the slant asymptote of the graph of each rational function.b. Follow the seven-step strategy and use the slant asymptote to graph each rational function. f(x) = x² = x + 1 x-1
Solve each inequality in Exercises 86–91 using a graphing utility. x² + 3x - 100
In Exercises 81–88,a. Find the slant asymptote of the graph of each rational function.b. Follow the seven-step strategy and use the slant asymptote to graph each rational function. f(x) = x³ +1 x² + 2x
In Exercises 83–86, determine whether each statement makes sense or does not make sense, and explain your reasoning.I’m working with the polynomial function f(x) = x4 + 3x2 + 2 that has four possible rational zeros but no actual rational zeros.
Solve each inequality in Exercises 86–91 using a graphing utility. 2x² + 5x - 30
Can the graph of a polynomial function have no x-intercepts? Explain.
In Exercises 87–90, determine whether each statement makes sense or does not make sense, and explain your reasoning.I must have made an error when graphing this parabola because its axis of symmetry is the y-axis.
In Exercises 87–90, determine whether each statement is true or false. If the statement is false, make the necessary change(s) to produce a true statement.The equation x3 + 5x2 + 6x + 1 = 0 has one positive real root.
Can the graph of a polynomial function have no y-intercept? Explain.
In Exercises 87–90, determine whether each statement makes sense or does not make sense, and explain your reasoning.I like to think of a parabola’s vertex as the point where it intersects its axis of symmetry.
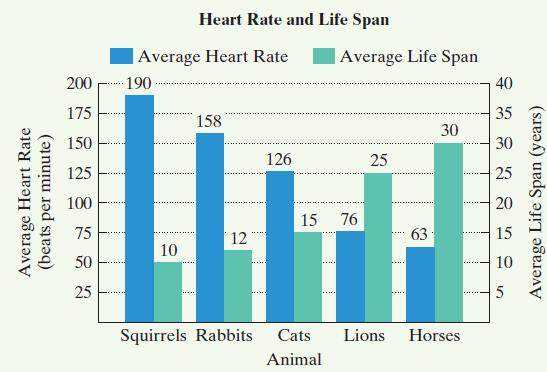
Heart rates and life spans of most mammals can be modeled using inverse variation. The bar graph shows the average heart rate and the average life span of five mammals.a. A mammal’s average life span, L, in years, varies inversely as its average heart rate, R, in beats per minute. Use the data
In Exercises 81–88,a. Find the slant asymptote of the graph of each rational function.b. Follow the seven-step strategy and use the slant asymptote to graph each rational function. f(x) = x² + 1 X X
In Exercises 81–88,a. Find the slant asymptote of the graph of each rational function.b. Follow the seven-step strategy and use the slant asymptote to graph each rational function. f(x) = x²+x-6 x - 3
The volume of a pyramid varies jointly as its height and the area of its base. A pyramid with a height of 15 feet and a base with an area of 35 square feet has a volume of 175 cubic feet. Find the volume of a pyramid with a height of 20 feet and a base with an area of 120 square feet.
Exercises 82–84 will help you prepare for the material covered in the next section.Solve: x2 + 4x + 6 = 0.
In Exercises 82–85, find the vertex for each parabola. Then determine a reasonable viewing rectangle on your graphing utility and use it to graph the quadratic function.y = 5x2 + 40x + 600
Exercises 82–84 will help you prepare for the material covered in the next section.Let f(x) = an (x4 - 3x2 - 4). If f(3) = -150, determine the value of an.
Explain the relationship between the multiplicity of a zero and whether or not the graph crosses or touches the x-axis and turns around at that zero.
In Exercises 81–88,a. Find the slant asymptote of the graph of each rational function.b. Follow the seven-step strategy and use the slant asymptote to graph each rational function. f(x) = x³ - 1 x² - 9
In Exercises 82–85, find the vertex for each parabola. Then determine a reasonable viewing rectangle on your graphing utility and use it to graph the quadratic function.y = 0.01x2 + 0.6x + 100
If f is a polynomial function, and f(a) and f(b) have opposite signs, what must occur between a and b? If f(a) and f(b) have the same sign, does it necessarily mean that this will not occur? Explain your answer.
In Exercises 83–86, determine whether each statement makes sense or does not make sense, and explain your reasoning.I’m working with a fourth-degree polynomial function with integer coefficients and zeros at 1 and 3 + √5. I’m certain that 3 + √2 cannot also be a zero of this
Explain the relationship between the degree of a polynomial function and the number of turning points on its graph.
Solve each inequality in Exercises 86–91 using a graphing utility. x³ + x² - 4x4>0 X
In Exercises 87–90, determine whether each statement is true or false. If the statement is false, make the necessary change(s) to produce a true statement.Descartes’s Rule of Signs gives the exact number of positive and negative real roots for a polynomial equation.
In Exercises 87–90, determine whether each statement makes sense or does not make sense, and explain your reasoning.I threw a baseball vertically upward and its path was a parabola.
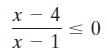
Solve each inequality in Exercises 86–91 using a graphing utility. x - 4 x-1 ≤0
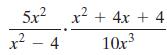
In Exercises 89–94, the equation for f is given by the simplified expression that results after performing the indicated operation. Write the equation for f and then graph the function. 5x² x² + 4x + 4 1²-4 10x³ 3
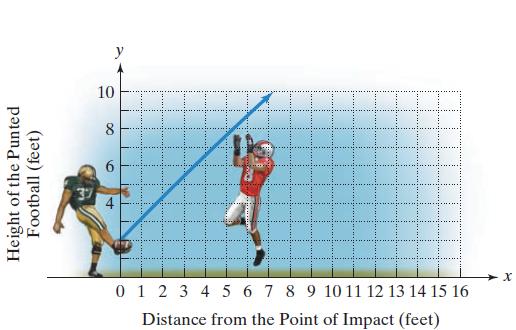
In Exercises 87–90, determine whether each statement makes sense or does not make sense, and explain your reasoning.Figure 3.7 shows that a linear function provides a better description of the football’s path than a quadratic function.Figure 3.7 (feet) Height of the Punted Football 10 8 6 + J 0
Describe a strategy for graphing a polynomial function. In your description, mention intercepts, the polynomial’s degree, and turning points.
In Exercises 87–90, determine whether each statement is true or false. If the statement is false, make the necessary change(s) to produce a true statement.Every polynomial equation of degree 3 with real coefficients has at least one real root.
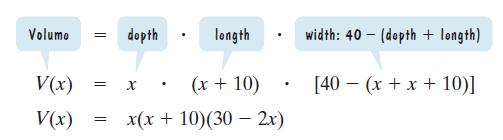
A popular model of carry-on luggage has a length that is 10 inches greater than its depth. Airline regulations require that the sum of the length, width, and depth cannot exceed 40 inches. These conditions, with the assumption that this sum is 40 inches, can be modeled by a function that gives the
Exercises 61–63 will help you prepare for the material covered in the first section of the next chapter.Use point plotting to graph f(x) = 2x. Begin by setting up a partial table of coordinates, selecting integers from -3 to 3, inclusive, for x. Because y = 0 is a horizontal asymptote, your graph
In Exercises 61–64, find the domain of each function. f(x) = √2x²5x + 2
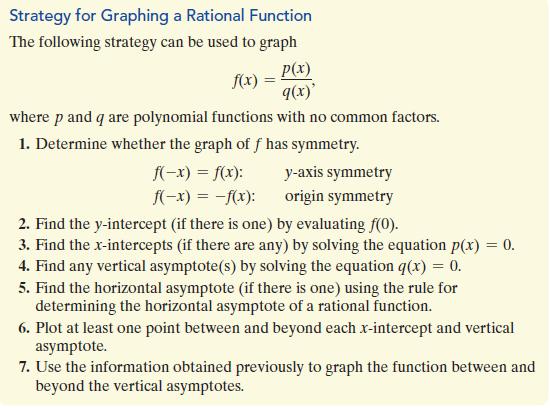
In Exercises 57–80, follow the seven steps to graph each rational function.Seven Steps are given below Strategy for Graphing a Rational Function The following strategy can be used to graph p(x) f(x) q(x)' where p and q are polynomial functions with no common factors. 1. Determine whether the
A ball is thrown upward and outward from a height of 6 feet. The height of the ball, f(x), in feet, can be modeled bywhere x is the ball’s horizontal distance, in feet, from where it was thrown.a. What is the maximum height of the ball and how far from where it was thrown does this occur?b. How
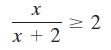
Solve each rational inequality in Exercises 43–60 and graph the solution set on a real number line. Express each solution set in interval notation. X x + 2 IV 2
In Exercises 57–80, follow the seven steps to graph each rational function.Seven Steps are given below Strategy for Graphing a Rational Function The following strategy can be used to graph p(x) f(x) q(x)' where p and q are polynomial functions with no common factors. 1. Determine whether the
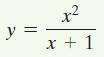
In Exercises 57–64, find the vertical asymptotes, if any, the horizontal asymptote, if one exists, and the slant asymptote, if there is one, of the graph of each rational function. Then graph the rational function. y = x² x + 1
A popular model of carry-on luggage has a length that is 10 inches greater than its depth. Airline regulations require that the sum of the length, width, and depth cannot exceed 40 inches. These conditions, with the assumption that this sum is 40 inches, can be modeled by a function that gives the
In Exercises 41–64,a. Use the Leading Coefficient Test to determine the graph’s end behavior.b. Find the x-intercepts. State whether the graph crosses the x-axis, or touches the x-axis and turns around, at each intercept.c. Find the y-intercept.d. Determine whether the graph has y-axis
In Exercises 57–80, follow the seven steps to graph each rational function.Seven Steps are given below Strategy for Graphing a Rational Function The following strategy can be used to graph p(x) f(x) q(x)' where p and q are polynomial functions with no common factors. 1. Determine whether the
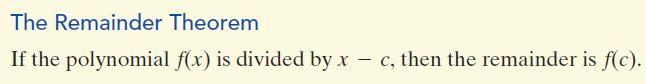
State the Remainder Theorem. The Remainder Theorem If the polynomial f(x) is divided by x - c, then the remainder is f(c).
Find the inverse of f(x) = x3 + 2.
Among all pairs of numbers whose sum is 16, find a pair whose product is as large as possible. What is the maximum product?
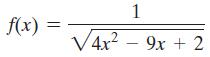
In Exercises 61–64, find the domain of each function. f(x) = √4x² 1 9x + 2
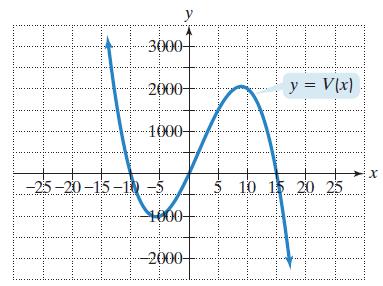
In Exercises 57–64, find the vertical asymptotes, if any, the horizontal asymptote, if one exists, and the slant asymptote, if there is one, of the graph of each rational function. Then graph the rational function. f(x) = 3 -2x-³ x² + 1
Among all pairs of numbers whose sum is 20, find a pair whose product is as large as possible. What is the maximum product?
Use the graph of the function modeling the volume of the carry-on luggage to solve Exercises 63–64.a. Identify your answers from Exercise 61 as points on the graph.b. Use the graph to describe a realistic domain, x, for the volume function, where x represents the depth of the carry-on luggage.
In Exercises 61–64, find the domain of each function. f(x) = 2x √x + 1 1
A rectangular playground is to be fenced off and divided in two by another fence parallel to one side of the playground. Four hundred feet of fencing is used. Find the dimensions of the playground that maximize the total enclosed area. What is the maximum area?
In Exercises 69–74, solve each inequality and graph the solution set on a real number line.2x2 + 9x + 4 ≥ 0
In Exercises 57–80, follow the seven steps to graph each rational function.Seven Steps are given below Strategy for Graphing a Rational Function The following strategy can be used to graph p(x) f(x) q(x)' where p and q are polynomial functions with no common factors. 1. Determine whether the
A rectangular playground is to be fenced off and divided in two by another fence parallel to one side of the playground. Six hundred feet of fencing is used. Find the dimensions of the playground that maximize the total enclosed area. What is the maximum area?
A company is planning to manufacture affordable graphing calculators. The fixed monthly cost will be $50,000 and it will cost $25 to produce each calculator.a. Write the cost function, C, of producing x graphing calculators.b. Write the average cost function, C, of producing x graphing
In Exercises 69–74, solve each inequality and graph the solution set on a real number line.2x2 + 5x - 3 < 0
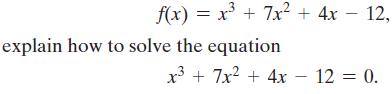
If you know that -2 is a zero of f(x) = x³ + 7x² + 4x - 12, explain how to solve the equation x³ + 7x² + 4x 12 = 0.
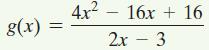
In Exercises 57–64, find the vertical asymptotes, if any, the horizontal asymptote, if one exists, and the slant asymptote, if there is one, of the graph of each rational function. Then graph the rational function. g(x) = 4x² 16x + 16 2x - 3
Exercises 61–63 will help you prepare for the material covered in the first section of the next chapter.Use point plotting to graph f(x) = 2x. Begin by setting up a partial table of coordinates, selecting integers from -3 to 3, inclusive, for x. Because y = 0 is a horizontal asymptote, your graph
Describe how to find the possible rational zeros of a polynomial function.
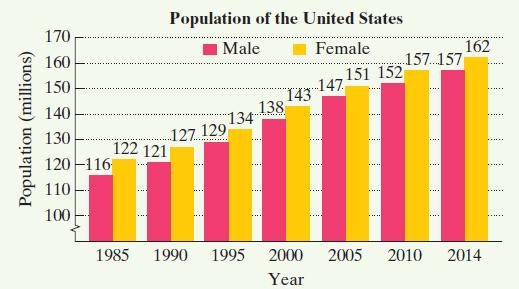
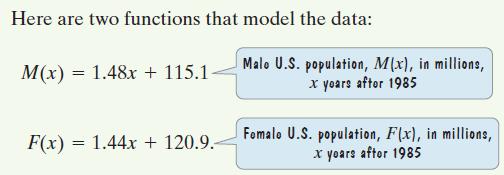
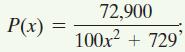
The bar graph shows the population of the United States, in millions, for six selected years.a. Write a function that models the total U.S. population, P(x), in millions, x years after 1985.b. Write a rational function that models the fraction of men in the U.S. population, R(x), x years after
Exercises 66–67 involve rational functions that model the given situations. In each case, find the horizontal asymptote as x → ∞ and then describe what this means in practical terms.the percentage, P(x), of people in the United States with x years of education who are unemployed
In Exercises 66–69, determine whether each statement makes sense or does not make sense, and explain your reasoning.Every time I divide polynomials using synthetic division, I am using a highly condensed form of the long division procedure where omitting the variables and exponents does not
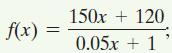
Exercises 66–67 involve rational functions that model the given situations. In each case, find the horizontal asymptote as x → ∞ and then describe what this means in practical terms.the number of bass, f(x), after x months in a lake that was stocked with 120 bass f(x) = 150x + 120 0.05x + 1
Solve the equation. Check your answers. √x + 1 = √2x - 1
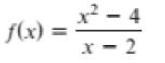
Complete the following. (a) Find the domain of f. (b) Graph f in an appropriate viewing rectangle. (c) Find any horizontal or vertical asymptotes. (d) Sketch a graph of f that includes any asymptotes. f(x) x² - 4 x-2
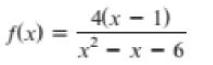
Complete the following. (a) Find the domain of f. (b) Graph f in an appropriate viewing rectangle. (c) Find any horizontal or vertical asymptotes. (d) Sketch a graph of f that includes any asymptotes. 4(x - 1) f(x) = -x-6
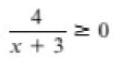
Solve the rational inequality (a) Symbolically and (b) Graphically. 4 x + 3 ≥0
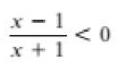
Solve the rational inequality (a) Symbolically and (b) Graphically. x-1 x+1 0
Complete each of the following for f(x). (a) If possible, evaluate f(0) and f(-2). (b) Sketch a graph of f. Give the domain and range. (c) Over what interval(s) is the graph of y = f(x) increasing? Decreasing? (d) As x→ -∞ f(x) (e) As x→ ∞ f(x) (f) Does f(x) = f(-x)? Is function f odd
Complete each of the following for f(x). (a) If possible, evaluate f(0) and f(-2). (b) Sketch a graph of f. Give the domain and range. (c) Over what interval(s) is the graph of y = f(x) increasing? Decreasing? (d) As x→ -∞ f(x) (e) As x→ ∞ f(x) (f) Does f(x) = f(-x)? Is function f odd
Complete each of the following for f(x). (a) If possible, evaluate f(0) and f(-2). (b) Sketch a graph of f. Give the domain and range. (c) Over what interval(s) is the graph of y = f(x) increasing? Decreasing? (d) As x→ -∞ f(x) (e) As x→ ∞ f(x) (f) Does f(x) = f(-x)? Is function f odd
Give the domain of the power function. Approximate f(3) to the nearest hundredth. 2x¹/4+3=6
Solve the equation. Check your answers. * = S + ZA
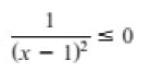
Solve the rational inequality 1 (x - 1)² ≤0
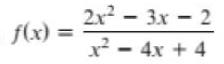
Graph y = f(x). You may want to use division, factoring, or transformations as an aid. Show all asymptotes and "holes." f(x) = 2x²-3x - 2 x² - 4x + 4
Give the domain of the power function. Approximate f(3) to the nearest hundredth. 1³/2 = 27
Give the domain of the power function. Approximate f(3) to the nearest hundredth. 2n-² - 5n-¹
Evaluate each f(x) at the given x. Approximate each result to the nearest hundredth. f(x) = x-³/4 x-3/4, x = 7
Give the domain of the power function. Approximate f(3) to the nearest hundredth. m³ + 2m² + m²¹ = 0
Graph y = f(x). You may want to use division, factoring, or transformations as an aid. Show all asymptotes and "holes." f(x) = x²-x-2 x²-2x-3
Use translations to graph f. f(x) = (x - 1)¹/4
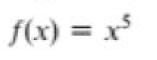
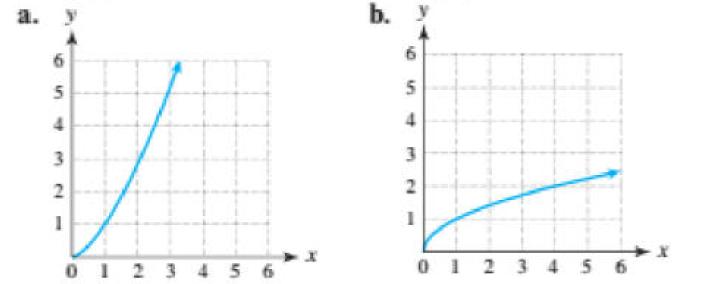
Match f(x) with its graph. Assume that a and b are constants with 0 f(x) = xª
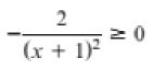
Solve the rational inequality 2 (x + 1)² ≥0
The formulaapproximates the ocean temperature in degrees Fahrenheit at Naples, Florida. In this formula m is the month, with m = 1 corresponding to January. (a) What is the average ocean temperature in May? (b) Estimate the absolute maximum of T on the closed interval [1, 12] and interpret the
Use translations to graph f. f(x) = (x + 1)2/3 - 2
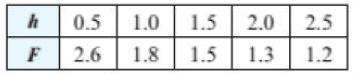
Taller animals tend to take longer, but fewer, steps per second than shorter animals. The relationship between the shoulder height / in meters of an animal and an animal's stepping frequency F in steps per second, while trotting, is shown in the table.(a) Find values for constants a and b so that
Use translations to graph f. f(x) = (x - 1)²/3
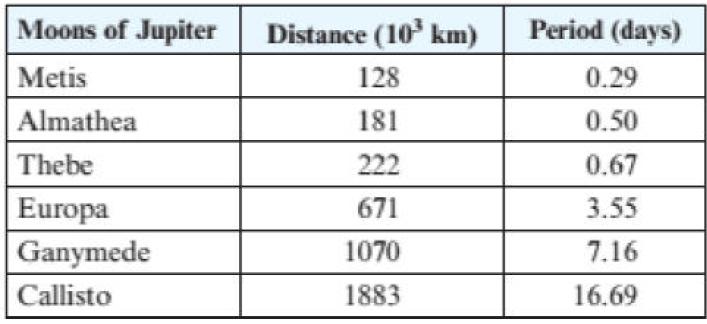
Use the data in the table to complete the following.(a) Make a scatterplot of the data. Estimate a value for b so that f(x) = 0.0002xb models the data. (b) Check the accuracy of f(x). (c) The moon lo is 422 thousand kilometers from Jupiter. Estimate its period and compare the estimate to the
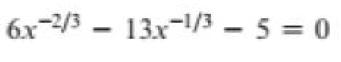
Solve the equation. Check your answers. 6x-2/3-13x-1/3 - 5 = 0
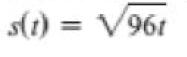
Let the distance from home in miles of a person after t hours on a straight path be given by s(t). Approximate the average rate of change of s from t1 = 1/2 to t2 = 9/2 to the nearest tenth and interpret the result. s(t) = V96t
Find possible dimensions that minimize the surface area of a box with no top that has a volume of 96 cubic inches and a length that is three times the width.
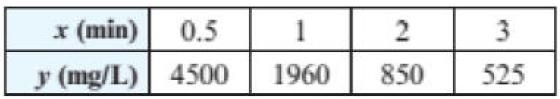
Rainbow trout are sensitive to zinc ions in the water. High concentrations are lethal. The average survival times x in minutes for trout in various concentrations of zinc ions y in mil- ligrams per liter (mg/L) are listed in the table.(a) These data can be modeled by f(x) = axb, where a and b are
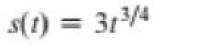
Let the distance from home in miles of a person after t hours on a straight path be given by s(t). Approximate the average rate of change of s from t1 = 1/2 to t2 = 9/2 to the nearest tenth and interpret the result. s(t) = 313/4
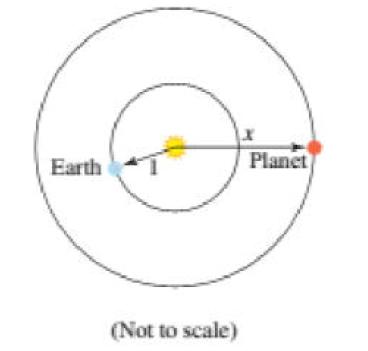
If there were a planet that took 200 years to orbit the sun, what would be its average distance x from the sun compared to that of Earth? Earth (Not to scale) Planet
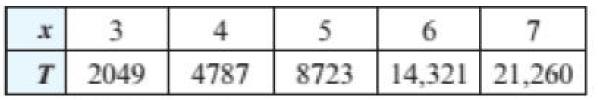
The table lists numbers of titles T released for DVD rentals x years after 1995.(a) Find a power function f that models the data in the table. (b) Use to estimate the number of titles released in 2006. Did your answer involve interpolation or extrapolation? (c) When did the number of releases
If an object is dropped from a height h, then the time t required for the object to strike the ground is directly proportional to the square root of h. If it requires 1 second for an object to fall 16 feet, how long does it take for an object to fall 256 feet?
Showing 8800 - 8900
of 13634
First
82
83
84
85
86
87
88
89
90
91
92
93
94
95
96
Last
Step by Step Answers