New Semester
Started
Get
50% OFF
Study Help!
--h --m --s
Claim Now
Question Answers
Textbooks
Find textbooks, questions and answers
Oops, something went wrong!
Change your search query and then try again
S
Books
FREE
Study Help
Expert Questions
Accounting
General Management
Mathematics
Finance
Organizational Behaviour
Law
Physics
Operating System
Management Leadership
Sociology
Programming
Marketing
Database
Computer Network
Economics
Textbooks Solutions
Accounting
Managerial Accounting
Management Leadership
Cost Accounting
Statistics
Business Law
Corporate Finance
Finance
Economics
Auditing
Tutors
Online Tutors
Find a Tutor
Hire a Tutor
Become a Tutor
AI Tutor
AI Study Planner
NEW
Sell Books
Search
Search
Sign In
Register
study help
mathematics
college algebra
College Algebra 12th edition Margaret L. Lial, John Hornsby, David I. Schneider, Callie Daniels - Solutions
Give a rule for each piecewise-defined function. Also give the domain and range. 10
Decide whether or not each equation has a circle as its graph. If it does, give the center and radius. If it does not, describe the graph.x2 + y2 - 6x - 6y + 18 = 0
Decide whether each relation defines y as a function of x. Give the domain and range.x = y6
Graph the line passing through the given point and having the indicated slope. Plot two points on the line.Through (- 5/2, 3), undefined slope.
Given functions f and g, find (a) (ƒ ° g)(x) and its domain, and (b) (g ° ƒ)(x) and its domain.ƒ(x) = √x - 2, g(x) = 2x
Graph each function.ƒ(x) = x2 - 2
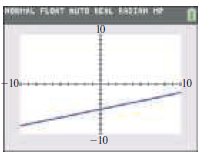
Use a graphing calculator to graph each equation in the standard viewing window.y = -2x + 3
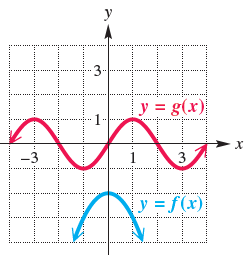
Use the graph to evaluate each expression.(a) (ƒ + g)(1) (b) (ƒ - g)(0)(c) (ƒg)(-1) (d) (ƒ/g)(1) 3. y = g(x) y = f(x)}
Suppose the point (8, 12) is on the graph of y = ƒ(x).Find a point on the graph of(a) y = 1/4 ƒ(x) (b) y = 4ƒ(x).
Find the slope and y-intercept of each line, and graph it.y = -2x + 7
Let ƒ(x) = -2x2 + 3x - 6. Find each of the following.ƒ(k)
Find the coordinates of the other endpoint of each line segment, given its midpoint and one endpoint.Midpoint (-7, 6), endpoint (-9, 9)
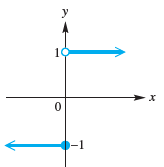
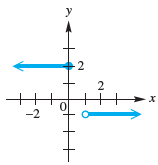
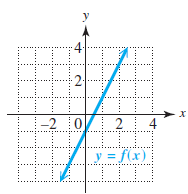
Give a rule for each piecewise-defined function. Also give the domain and range. y х
Decide whether or not each equation has a circle as its graph. If it does, give the center and radius. If it does not, describe the graph.x2 + y2 + 4x + 4y + 8 = 0
Decide whether each relation defines y as a function of x. Give the domain and range.x = y4
Use a graphing calculator to graph each equation in the standard viewing window.3x + 4y = 6
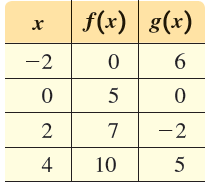
Use the table to evaluate each expression in parts (a)–(d), if possible.(a) (ƒ + g)(2) (b) (ƒ - g)(4) (c) (ƒg)(-2) (d) (ƒ/g)(0) f(x) g(x) -2 6. -2 4 10
Suppose the point (8, 12) is on the graph of y = ƒ(x).Find a point on the graph of(a) y = ƒ(4x) (b) y = ƒ (1/4 x).
Find the slope and y-intercept of each line, and graph it.4x - y = 7
Graph each equation.2x - 5y = 5
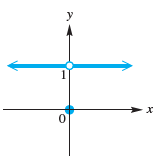
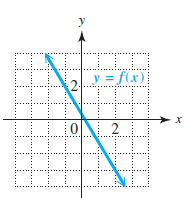
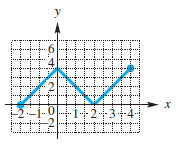
Give a rule for each piecewise-defined function. Also give the domain and range. 2 -2 2.
Find the coordinates of the other endpoint of each line segment, given its midpoint and one endpoint.Midpoint (12, 6), endpoint (19, 16)
Decide whether or not each equation has a circle as its graph. If it does, give the center and radius. If it does not, describe the graph.9x2 + 9y2 - 6x + 6y - 23 = 0
Decide whether each relation defines y as a function of x. Give the domain and range.y = 2x - 5
Use a graphing calculator to graph each equation in the standard viewing window.-2x + 5y = 10
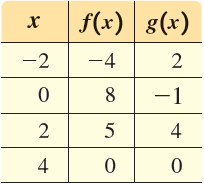
Use the table to evaluate each expression in parts (a)–(d), if possible.(a) (ƒ + g)(2) (b) (ƒ - g)(4) (c) (ƒg)(-2) (d) (ƒ/g)(0) f(x) g(x) х -4 -2 -1 4 4 2.
For each line, (a) find the slope and (b) sketch the graph.2y = -3x
For each equation, (a) give a table with at least three ordered pairs that are solutions, and (b) graph the equation. y = Vx - 3
The distance formula, midpoint formula, and center radius form of the equation of a circle are closely related in the following problem.A circle has a diameter with endpoints (-1, 3) and (5, -9). Find the center-radius form of the equation of this circle.Using the center found in Exercise 53 and
Let ƒ(x) = 2x - 3 and g(x) = -x + 3.(ƒ ° g)(4)
The distance formula, midpoint formula, and center radius form of the equation of a circle are closely related in the following problem.A circle has a diameter with endpoints (-1, 3) and (5, -9). Find the center-radius form of the equation of this circle.Use the method described in Exercises
Let ƒ(x) = 2x - 3 and g(x) = -x + 3. Find each function value.(ƒ ° g)(2)
Graph each function.ƒ(x) = x2 - 1
Let ƒ(x) = 2x - 3 and g(x) = -x + 3. Find each function value.(ƒ ° g)(-2)
Graph the line passing through the given point and having the indicated slope. Plot two points on the line.Through (-2, -3), m = - 3/4
Let ƒ(x) = 2x - 3 and g(x) = -x + 3. Find each function value.(g º ƒ)(3)
Answer the following.If the point (a, b) is in the second quadrant, then in what quadrant is (a, -b)? (-a, b)? (-a, -b)? (b, a)?
Graph each function.ƒ(x) = x2 + 2
Let ƒ(x) = 2x - 3 and g(x) = -x + 3. Find each function value.(g º ƒ)(0)
Graph each function.ƒ(x) = x2 + 3
Let ƒ(x) = 2x - 3 and g(x) = -x + 3. Find each function value.(g º ƒ)(-2)
Let ƒ(x) = 2x - 3 and g(x) = -x + 3. Find each function value.(ƒ ° ƒ)(2)
Let ƒ(x) = -3x + 4 and g(x) = -x2 + 4x + 1. Find each of the following. Simplify if necessary.ƒ (a + 4)
For each line described, write an equation in (a) slope-intercept form, if possible, and (b) standard form.x-intercept (-3, 0), y-intercept (0, 5)
Answer the following.Find the coordinates of the points that divide the line segment joining (4, 5) and (10, 14) into three equal parts.
Graph the line passing through the given point and having the indicated slope. Plot two points on the line.Through (9/4, 2), undefined slope
Graph each function.g(x) = (x - 2)2
Let ƒ(x) = 2x - 3 and g(x) = -x + 3. Find each function value.(g ° g)(-2)
When the Celsius temperature is 0°, the corresponding Fahrenheit temperature is 32°. When the Celsius temperature is 100°, the corresponding Fahrenheit temperature is 212°. Let C represent the Celsius temperature and F the Fahrenheit temperature.(a) Express F as an exact linear function of
Let ƒ(x) = -3x + 4 and g(x) = -x2 + 4x + 1. Find each of the following. Simplify if necessary.f (2m - 3)
For each line described, write an equation in (a) slope-intercept form, if possible, and (b) standard form.Through (2, -10), perpendicular to a line with undefined slope
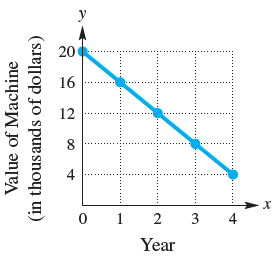
Find and interpret the average rate of change illustrated in each graph. 16 12 4 2 3 Year Value of Machine (in thousands of dollars)
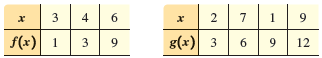
The tables give some selected ordered pairs for functions ƒ and g.Find each of the following.(ƒ ° g)(2) 3 4 1 f(x) 1 g(x) 3 12 3 6. 2. 3.
Graph each function.g(x) = (x + 2)2
The pressure P of water on a diver’s body is a linear function of the diver’s depth, x. At the water’s surface, the pressure is 1 atmosphere. At a depth of 100 ft, the pressure is about 3.92 atmospheres.(a) Find a linear function that relates P to x.(b) Compute the pressure, to the nearest
Let ƒ(x) = -3x + 4 and g(x) = -x2 + 4x + 1. Find each of the following. Simplify if necessary.f (3t - 2)
For each line described, write an equation in (a) slope-intercept form, if possible, and (b) standard form.Through (0, 5), perpendicular to 8x + 5y = 3
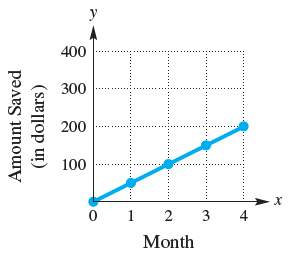
Find and interpret the average rate of change illustrated in each graph. y х 3 4 Month Amount Saved (in dollars) 2.
The tables give some selected ordered pairs for functions ƒ and g.Find each of the following.(ƒ ° g)(7) 3 4 1 f(x) 1 g(x) 3 12 3 6. 2. 3.
Graph each function.g(x) = (x + 3)2
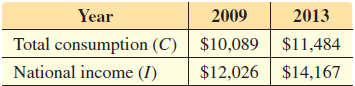
In Keynesian macroeconomic theory, total consumption expenditure on goods and services, C, is assumed to be a linear function of national personal income, I. The table gives the values of C and I for 2009 and 2013 in the United States (in billions of dollars).(a) Find a formula for C as a function
For each function, find (a) ƒ(2) and (b) ƒ(-1).ƒ = {(-1, 3), (4, 7), (0, 6), (2, 2)}
For each line described, write an equation in (a) slope-intercept form, if possible, and (b) standard form.Through (-7, 4), perpendicular to y = 8
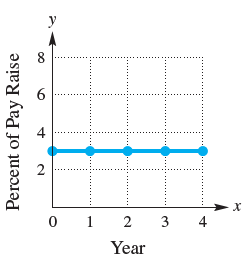
Find and interpret the average rate of change illustrated in each graph. 4 Year 3. 2. 4- 2. Percent of Pay Raise
The tables give some selected ordered pairs for functions ƒ and g.Find each of the following.(g ° ƒ)(3) 3 4 1 f(x) 1 g(x) 3 12 3 6. 2. 3.
Graph each function.g(x) = |x| - 1
A graph of y = ƒ(x) is shown in the standard viewing window. Which is the only value of x that could possibly be the solution of the equation ƒ(x) = 0?A. -15 B. 0 C. 5 D. 15 HORTAL FLONT NUTE IEIL TAH H T0 -10- +10 -10
For each function, find (a) ƒ(2) and (b) ƒ(-1).f = {(2, 5), (3, 9), (-1, 11), (5, 3)}
For each line described, write an equation in (a) slope-intercept form, if possible, and (b) standard form.Through (3, -5), parallel to y = 4
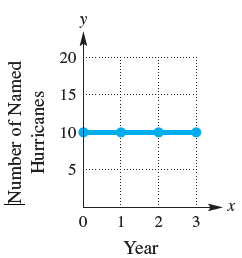
Find and interpret the average rate of change illustrated in each graph. 20 15 10 5 3 Year Number of Named Hurricanes 2.
The tables give some selected ordered pairs for functions ƒ and g.Find each of the following.(g ° ƒ)(6) 3 4 1 f(x) 1 g(x) 3 12 3 6. 2. 3.
Graph each function.g(x) = |x + 3| + 2
Use a graphing calculator to solve each linear equation.2x + 7 - x = 4x - 2
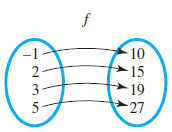
For each function, find (a) ƒ(2) and (b) ƒ(-1). -1 -10 2- -15 19 27 5-
Graph each function.ƒ(x) = |x| - 3
Solve each problem.In 1980, the number of high school dropouts in the United States was 5085 thousand. By 2012, this number had decreased to 2562 thousand. Find and interpret the average rate of change per year in the number of high school dropouts. Round the answer to the nearest tenth.
The tables give some selected ordered pairs for functions ƒ and g.Find each of the following.(ƒ ° ƒ)(4) 3 4 1 f(x) 1 g(x) 3 12 3 6. 2. 3.
Graph each function.h(x) = -(x + 1)3
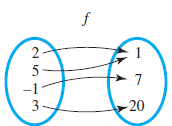
For each function, find (a) ƒ(2) and (b) ƒ(-1). 2- -1 3- -20
Graph each function.ƒ(x) = - |x|
Solve each problem.The total amount spent on plasma flat-panel TVs in the United States changed from $5302 million in 2006 to $1709 million in 2013. Find and interpret the average rate of change in sales, in millions of dollars per year. Round the answer to the nearest hundredth. (Source: Consumer
The tables give some selected ordered pairs for functions ƒ and g.Find each of the following.(g ° g)(1) 3 4 1 f(x) 1 g(x) 3 12 3 6. 2. 3.
Graph each function.h(x) = -(x - 1)3
Use a graphing calculator to solve each linear equation.3(2x + 1) - 2(x - 2) = 5
For each function, find (a) ƒ(2) and (b) ƒ(-1). .4 2 |-2 0 2. = f(x).
Graph each function.ƒ(x) = -(x + 1)2 + 3
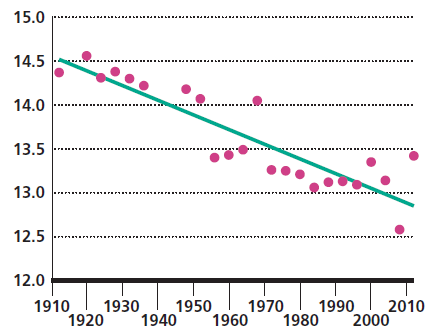
The graph shows the winning times (in minutes) at the Olympic Games for the men’s 5000-m run, together with a linear approximation of the data.Olympic Times for 5000-Meter Run (in minutes)(a) An equation for a linear model, based on data from 1912–2012 (where x represents the year), is y =
Why can we not determine (ƒ ° g)(1) given the information in the tables for Exercises
Graph each function.h(x) = 2x2 - 1
Use a graphing calculator to solve each linear equation.4x - 3(4 - 2x) = 2(x - 3) + 6x + 2
For each function, find (a) ƒ(2) and (b) ƒ(-1). y = f(x)
Graph each function.ƒ(x) = -√x - 2
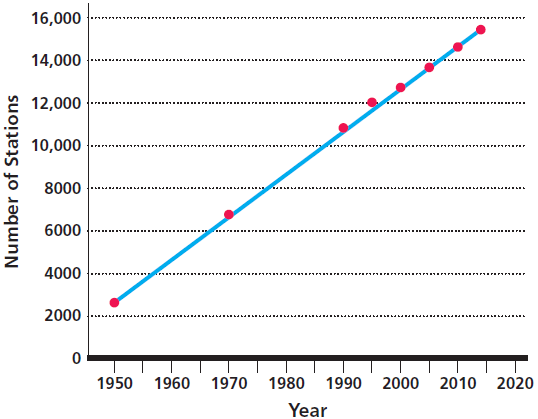
The graph shows the number of U.S. radio stations on the air, along with the graph of a linear function that models the data.U.S. Radio Stations(a) An equation for a linear model, based on data from 1950–2014 (where x = 0 represents 1950, x = 10 represents 1960, and so on) is y = 200.02x +
Extend the concept of composition of functions to evaluate (g ° (ƒ ° g))(7) using the tables for Exercises
Graph each function.h(x) = 3x2 - 2
Use the graph of y = ƒ(x) to find each function value: (a) ƒ(-2), (b) ƒ(0), (c) ƒ(1), and (d) ƒ(4). II 12+3-4 -2–1-0 ttt2 IN
Use a graphing calculator to solve each linear equation.(a) Solve -21x - 52 = -x - 2 using traditional paper-and-pencil methods.(b) Explain why the standard viewing window of a graphing calculator cannot graphically support the solution found in part (a). What minimum and maximum x-values would
Graph each function.ƒ(x) = [[x - 3]]
The table gives the number of cellular telephone subscribers in the U.S. (in thousands) from 2008 through 2013. Find the average annual rate of change during this time period. Round to the nearest unit.Year........................................ Subscribers (in
Given functions f and g, find (a) (ƒ ° g)(x) and its domain, and (b) (g ° ƒ)(x) and its domain.ƒ(x) = -6x + 9, g(x) = 5x + 7
Showing 14900 - 15000
of 16373
First
143
144
145
146
147
148
149
150
151
152
153
154
155
156
157
Last
Step by Step Answers