New Semester
Started
Get
50% OFF
Study Help!
--h --m --s
Claim Now
Question Answers
Textbooks
Find textbooks, questions and answers
Oops, something went wrong!
Change your search query and then try again
S
Books
FREE
Study Help
Expert Questions
Accounting
General Management
Mathematics
Finance
Organizational Behaviour
Law
Physics
Operating System
Management Leadership
Sociology
Programming
Marketing
Database
Computer Network
Economics
Textbooks Solutions
Accounting
Managerial Accounting
Management Leadership
Cost Accounting
Statistics
Business Law
Corporate Finance
Finance
Economics
Auditing
Tutors
Online Tutors
Find a Tutor
Hire a Tutor
Become a Tutor
AI Tutor
AI Study Planner
NEW
Sell Books
Search
Search
Sign In
Register
study help
mathematics
statistics engineers scientists
Statistics For Engineers And Scientists 4th Edition William Navidi - Solutions
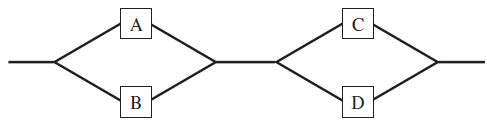
A system consists of two subsystems connected in series, as shown in the following schematic illustration. Each subsystem consists of two components connected in parallel. The AB subsystem fails when both A and B have failed. The CD subsystem fails when both C and D have failed. The system fails as
In a certain university, math SAT scores for the entering freshman class averaged 650 and had a standard deviation of 100. The maximum possible score is 800. Is it possible that the scores of these freshmen are normally distributed? Explain.
A chemist wishes to estimate the concentration of particles in a certain suspension. She withdraws 3 mL of the suspension and counts 48 particles. Estimate the concentration in particles per mL and find the uncertainty in the estimate.
Let X1, . . . , Xn be a random sample from a N(μ, σ2) population. Find the MLEs of μ and of σ. The likelihood function is a function of two parameters, μ and σ. Compute partial derivatives with respect to μ and σ and set them equal to 0 to find the values μ̂ and σ̂ that maximize the
A quality engineer takes a random sample of 100 steel rods from a day’s production, and finds that 92 of them meet specifications.a. Estimate the proportion of that day’s production that meets specifications, and find the uncertainty in the estimate.b. Estimate the number of rods that must be
The stiffness of a certain type of steel beam used in building construction has mean 30 kN/mm and standard deviation 2 kN/mm. a. Is it possible to compute the probability that the stiffness of a randomly chosen beam is greater than 32 kN/mm? If so, compute the probability. If not, explain why
Among the adults in a large city, 30% have a college degree. A simple random sample of 100 adults is chosen. What is the probability that more than 35 of them have a college degree?
Let X1, . . . , Xn be independent log normal random variables and let a1, . . . , an be constants. Show that the product P = Xa11· · · Xann is lognormal. ln P = a1 ln X1 +· · ·+an ln Xn.
In a process that manufactures bearings, 90% of the bearings meet a thickness specification. A shipment contains 500 bearings. A shipment is acceptable if at least 440 of the 500 bearings meet the specification. Assume that each shipment contains a random sample of bearings.a. What is the
A lot of parts contains 500 items, 100 of which are defective. Suppose that 20 items are selected at random. Let X be the number of selected items that are defective.a. Express the quantity P(X = 5) using factorials.b. Use the binomial approximation to compute an approximation to P(X = 5).
Someone suggests that the lifetime T (in days) of a certain component can be modeled with the Weibull distribution with parameters α = 3 and β = 0.01.a. If this model is correct, what is P(T ≤ 1)?b. Based on the answer to part (a), if the model is correct, would one day be an unusually short
Refer to Exercise 8.a. Assume that P = 224.51 ± 0.04 kPa and V = 11.237 ± 0.002 L. Estimate T, and find the relative uncertainty in the estimate.b. Assume that P = 224.51 ± 0.04 kPa and T = 289.33±0.02 K. Estimate V, and find the relative uncertainty in the estimate.c. Assume that V = 11.203 ±
Refer to Exercise 5. Assume that P1 = 15.3 ± 0.2 MPa and P2 = 25.8 ± 0.1 MPa. Estimate P3, and find the relative uncertainty in the estimate.Refer to Exercise 5.When air enters a compressor at pressure P1 and leaves at pressure P2, the intermediate pressure is given by P3 = √P1P2.
If X is an unbiased measurement of a true value μX, and U(X) is a nonlinear function of X, then in most cases U is a biased estimate of the true value U(μX ). In most cases this bias is ignored. If it is important to reduce this bias, however, a bias-corrected estimate is U(X) −
Estimate U, and find the relative uncertainty in the estimate, assuming that X = 5.0 ± 0.2, Y = 10.0 ± 0.5, anda. U = X√Yb. U = 2Y/√Xc. U = X2 + Y2
The lengths of two components will be measured several times. The uncertainty in each measurement of the length of the first component is σ1 = 0.02 cm, and the uncertainty in each measurement of the length of the second component is σ2 = 0.08 cm. Let X̅ denote the average of the measurements of
Two students want to measure the acceleration a of a cart rolling down an inclined plane. The cart starts at rest and travels a distance s down the plane. The first student estimates the acceleration by measuring the instantaneous velocity v just as the cart has traveled s meters, and uses the
The vertical displacement v of a cracked slurry infiltrated fiber concrete member at maximum shear stress is given by v = a + bw, where w is the crack width, and a and b are estimated from data to be a = 2.5 ± 0.1 mm and b = 0.05 ± 0.01. Assume that w = 1.2 ± 0.1 mm.a. Estimate v, and find the
According to Newton€™s law of cooling, the time t needed for an object at an initial temperature T0to cool to a temperature T in an environment with ambient temperature Ta is given by where k is a constant.Assume that for a certain type of container, k = 0.025 minˆ’1. Let t be
Refer to Exercise 6. Assume that c = 448 J/kg◦C and ΔQ = 1210 J are known with negligible uncertainty. Assume the mass is m = 0.75 ± 0.01 kg. Estimate ΔT , and find the relative uncertainty in the estimate.Refer to Exercise 6.The change in temperature of an iron bar brought about by a transfer
A certain scale has an uncertainty of 3 g and a bias of 2 g.a. A single measurement is made on this scale. What are the bias and uncertainty in this measurement?b. Four independent measurements are made on this scale. What are the bias and uncertainty in the average of these measurements?c. Four
A cable is made up of several parallel strands of wire. The strength of the cable can be estimated from the strengths of the individual wires by either of two methods. In the ductile wire method, the strength of the cable is estimated to be the sum of the strengths of the wires. In the brittle wire
Nine independent measurements are made of the length of a rod. The average of the nine measurements is X̅ = 5.238 cm, and the standard deviation is s = 0.081 cm.a. Is the uncertainty in the value 5.238 cm closest to 0.009, 0.027, or 0.081 cm? Explain.b. Another rod is measured once by the same
According to Snell’s law, the angle of refraction θ2 of a light ray traveling in a medium of index of refraction n is related to the angle of incidence θ1 of a ray traveling in a vacuum through the equation sin θ1 = n sin θ2. Assume that θ1 = 0.3672 ± 0.005 radians and θ2 = 0.2943 ± 0.004
Convert the following relative uncertainties to absolute uncertainties.a. 48.41 ± 0.3%b. 991.7 ± 0.6%c. 0.011 ± 9%d. 7.86 ± 1%
In the article “Influence of Crack Width on Shear Behaviour of SIFCON” (C. Fritz and H. Reinhardt, High Performance Fiber Reinforced Cement Composites: Proceedings of the International RILEM/ACI Workshop, 1992), the maximum shear stress τ of a cracked concrete member is given to be τ = τ0(1
A piece of plywood is composed of five layers. The two outer layers are veneers with thickness 0.50 ± 0.02 mm, and the three inner layers each have thickness 6.25 ± 0.05 mm. Assume the thicknesses of the layers are independent. Estimate the thickness of the plywood and its uncertainty.
In the article “Temperature-Dependent Optical Constants of Water Ice in the Near Infrared: New Results and Critical Review of the Available Measurements” (B. Rajaram, D. Glandorf, et al., Applied Optics, 2001:4449–4462), the imaginary index of refraction of water ice is presented for various
The conversion of ammonium cyanide to urea is a second-order reaction. This means that the concentration C of ammonium cyanide at time t is given by 1/C = kt+1/C0, where C0 is the initial concentration and k is the rate constant. Assume the initial concentration is known to be 0.1 mol/L exactly.
If two gases have molar masses M1 and M2, Graham’s law states that the ratio R of their rates of effusion through a small opening is given by R = √M1/M2. The effusion rate of an unknown gas through a small opening is measured to be 1.66 ± 0.03 times greater than the effusion rate of carbon
The article “Calibration of an FTIR Spectrometer” (P. Pankratz, Statistical Case Studies for Industrial and Process Improvement, SIAM-ASA, 1997: 19–38) describes the use of a spectrometer to make five measurements of the carbon content (in ppm) of a certain silicon wafer whose true carbon
A new and unknown weight is weighed on the same scale that was used in Exercise 8, and the measurement is 127 μg above 1 kg. Using the information in Exercise 8, is it possible to come up with a more accurate measurement? If so, what is it? If not, explain why not.Exercise 8.The Kilogram is now
The pressure P, temperature T, and volume V of one mole of an ideal gas are related by the equation PV = 8.31T, when P is measured in kilopascals, T is measured in kelvins, and V is measured in liters.a. Assume that P = 242.52 ± 0.03 kPa and V = 10.103 ± 0.002 L. Estimate T , and find the
The refractive index n of a piece of glass is related to the critical angle θ by n = 1/ sin θ. Assume that the critical angle is measured to be 0.70 ± 0.02 rad. Estimate the refractive index, and find the uncertainty in the estimate.
In a Couette flow, two large flat plates lie one on top of another, separated by a thin layer of fluid. If a shear stress is applied to the top plate, the viscosity of the fluid produces motion in the bottom plate as well. The velocity V in the top plate relative to the bottom plate is given by V =
The period T of a simple pendulum is given by T = 2π√L/g where L is the length of the pendulum and g is the acceleration due to gravity. Thus if L and T are measured, we can estimate g with g = 4π2L/T2. Assume that the period is known to be T = 1.5 s with negligible uncertainty, and that L is
Sixteen independent measurements were made of the resistance of a resistor. The average was 52.37 and the standard deviation was 0.12 Ω.a. Estimate the resistance of this resistor, and find the uncertainty in the estimate.b. A single measurement is made of the resistance of another resistor. This
The Kilogram is now weighed five times on a different scale. The measurements are as follows, in units of micrograms above 1 kg: 25.6, 26.8, 26.2, 26.8, 25.4.a. Is it possible to estimate the uncertainty in these measurements? If so, estimate it. If not, explain why not.b. Is it possible to
In a hypothetical scenario, the National Institute of Standards and Technology has received a new replica of The Kilogram. It is weighed five times. The measurements are as follows, in units of micrograms above 1 kg: 114.3, 82.6, 136.4, 126.8, 100.7.a. Is it possible to estimate the uncertainty in
One way to measure the water content of a soil is to weigh the soil both before and after drying it in an oven. The water content is W = (M1 − M2)/M1, where M1 is the mass before drying and M2 is the mass after drying. Assume that M1 = 1.32 ± 0.01 kg and M2 = 1.04 ± 0.01 kg.a. Estimate W, and
The change in temperature of an iron bar brought about by a transfer of heat is given by ΔT = ΔQ/mc, where ΔQ is the amount of heat transferred, m is the mass of the bar, and c is the specific heat of iron. Assume that c = 448 J/kg◦C and ΔQ = 1210 J are known with negligible uncertainty.
A cylindrical hole is bored through a steel block, and a cylindrical piston is machined to fit into the hole. The diameter of the hole is 20.00 ± 0.01 cm, and the diameter of the piston is 19.90 ± 0.02 cm. The clearance is one-half the difference between the diameters. Estimate the clearance and
Let A and B represent two variants (alleles) of the DNA at a certain locus on the genome. Let p represent the proportion of alleles in a population that are of type A, and let q represent the proportion of alleles that are of type B. The Hardy–Weinberg equilibrium principle states that the
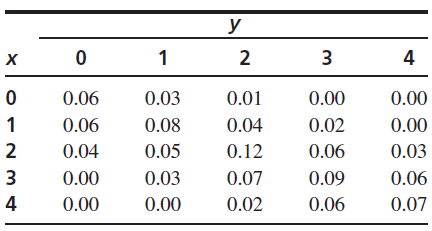
Refer to Exercise 9.a. Find the mean of the total number of unacceptable bolts (those that are classified as either downgraded or scrap).b. Find the variance of the total number of unacceptable bolts.c. Find the probability that the total number of unacceptable bolts is exactly 5.Refer to Exercise
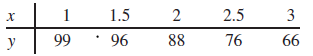
Curing times in days (x) and compressive strengths in MPa (y) were recorded for several concrete specimens. The means and standard deviations of the x and y values were x̄ = 5, sx = 2, ȳ = 1350, sy = 100. The correlation between curing time and compressive strength was computed to be r = 0.7.
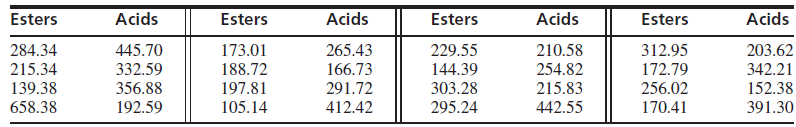
The article €œThe Selection of Yeast Strains for the Production of Premium Quality South African Brandy Base Products€ (C. Steger and M. Lambrechts, Journal of Industrial Microbiology and Biotechnology, 2000:431€“440) presents detailed information on the volatile
In a study of copper bars, the relationship between shear stress in ksi (x) and shear strain in % (y) was summarized by the least-squares line y = −20.00 + 2.56x. There were a total of n = 17 observations, and the coefficient of determination was r2 = 0.9111. If the total sum of squares was
A scatterplot contains four points: (−2,−2), (−1,−1), (0,0), and (1,1). A fifth point, (2,y), is to be added to the plot. Let r represent the correlation between x and y.a. Find the value of y so that r = 1.b. Find the value of y so that r = 0.c. Find the value of y so that r = 0.5.d. Find
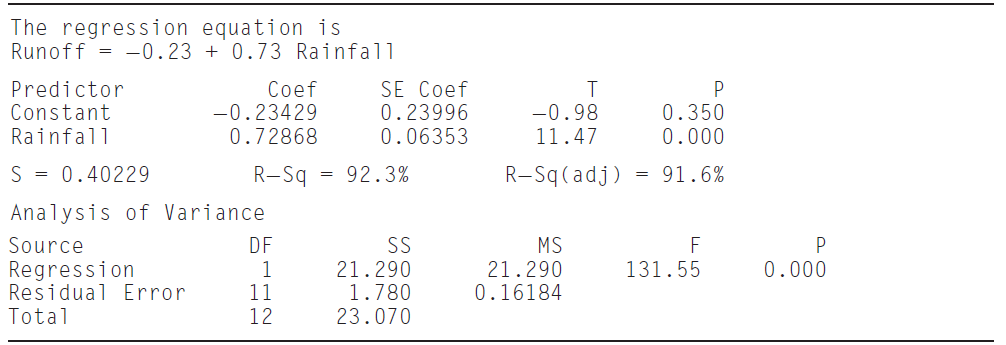
The article ??Approach to Confidence Interval Estimation for Curve Numbers?? (R. McCuen, Journal of Hydrologic Engineering, 2002:43??48) discusses the relationship between rainfall depth and runoff depth at several locations. At one particular location, rainfall depth and runoff depth were recorded
In the manufacture of synthetic fiber, the fiber is often ??set?? by subjecting it to high temperatures. The object is to improve the shrinkage properties of the fiber. In a test of 25 yarn specimens, the relationship between temperature in ??C (x) and shrinkage in % (y) was summarized by the
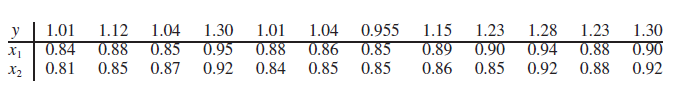
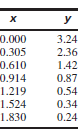
An engineer wants to predict the value for y when x = 4.5, using the following data set.a. Construct a scatterplot of the points (x, y).b. Should the least-squares line be used to predict the value of y when x = 4.5? If so, compute the leastsquares line and the predicted value. If not, explain why
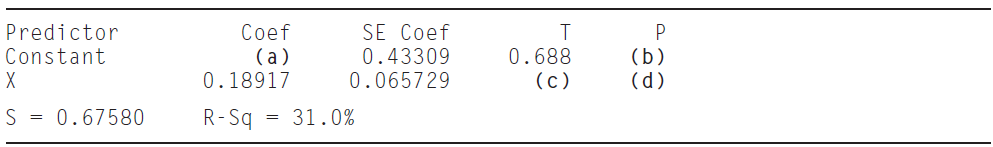
In the following MINITAB output, some of the numbers have been accidentally erased. Recompute them, using the numbers still available. There are n = 20 points in the data set. Predictor Constant Сoef (a) 0.18917 SE Coef 0.43309 0.065729 0.688 (c) P (b) (d) S = 0.67580 R-Sq 31.0% =
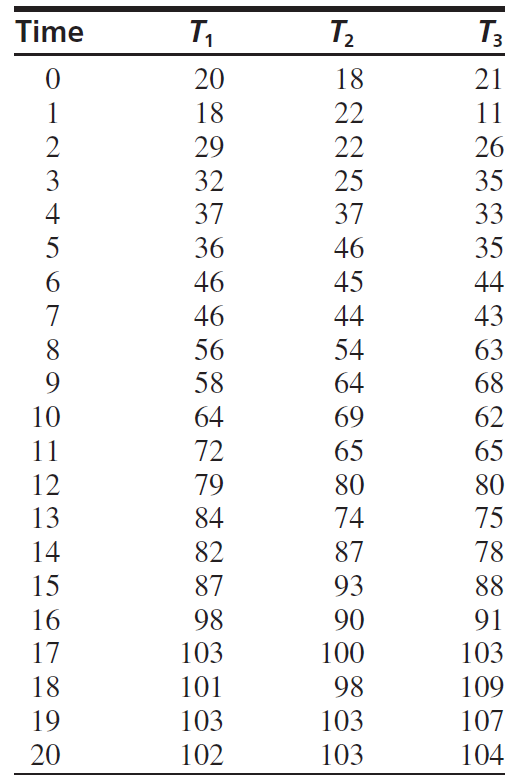
A mixture of sucrose and water was heated on a hot plate, and the temperature (in °C) was recorded each minute for 20 minutes by three thermocouples. The results are shown in the following table.a. Compute the least-squares line for estimating the temperature as a function of time, using T1 as
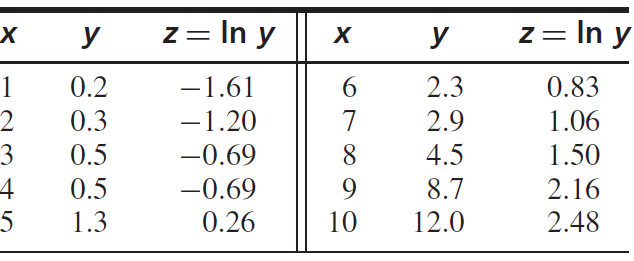
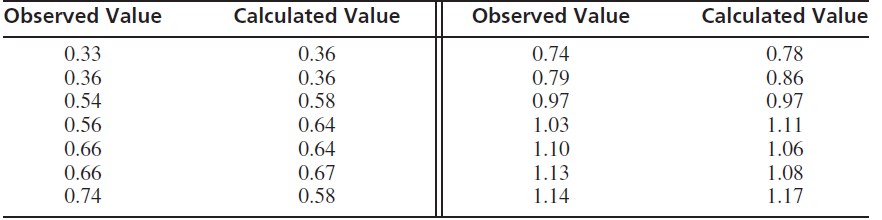
The article €œPolyhedral Distortions in Tourmaline€ (A. Ertl, J. Hughes, et al., The Canadian Mineralogist, 2002: 153€“162) presents a model for calculating bond length distortion in vanadium-bearing tourmaline. To check the accuracy of the model, several calculated
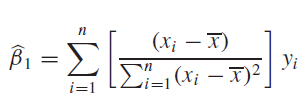
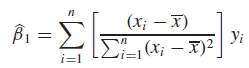
Use Equation (7.34) (page 545) to show that μβ̂1= β1. Equation (7.34) (X; – X) Bi = E Yi i=1
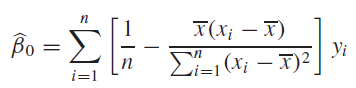
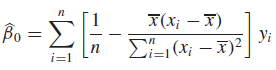
Use Equation (7.35) (page 545) to show that μβ̂0= β0Equation (7.35). ы п T(x; — х) Bo = E i=1 Ei-1 (x; – X)², Уi
Use Equation (7.34) (page 545) to derive the formula Equation (7.34) .2 E (x; – T)? B1 i=1 ||
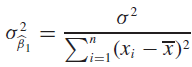
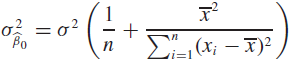
Use Equation (7.35) (page 545) to derive the formula Equation (7.35) o? =o? Po .2 E (x; – X)? in n i31 +
The article referred to in Exercise 23 presents values for the dependent and independent variables for 10 additional construction jobs. These values are presented in Tables SE24A and SE24B (page 661). a. Using the equation constructed in part (a) of Exercise 23, predict the concrete quantity (y)
The following data were collected in an experiment to study the relationship between extrusion pressure (in KPa) and wear (in mg).The least-squares quadratic model is y = ˆ’32.445714 + 0.43154286x ˆ’ 0.000982857x2.a. Using this equation, compute the residuals.b. Compute the
The article €œAdvances in Oxygen Equivalence Equations for Predicting the Properties of Titanium Welds€ (D. Harwig, W. Ittiwattana, and H. Castner, The Welding Journal, 2001:126s€“136s) reports an experiment to predict various properties of titanium welds. Among other
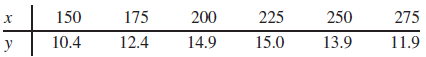
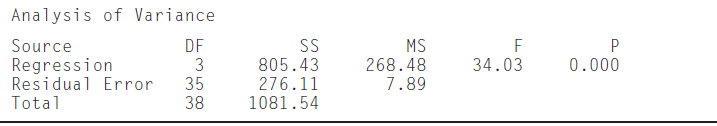
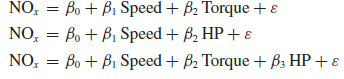
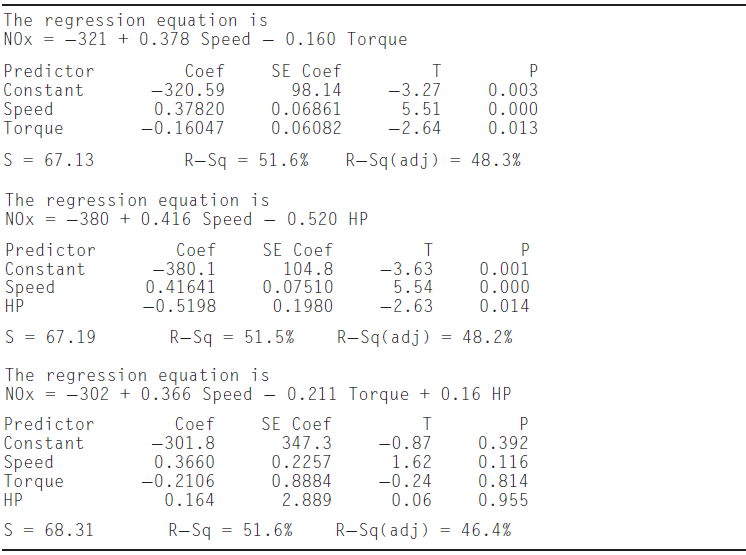
In a laboratory test of a new engine design, the emissions rate (in mg/s of oxides of nitrogen, NOx) was measured as a function of engine speed (in rpm), engine torque (in ft · lb), and total horsepower. (From €œIn-Use Emissions 620 CHAPTER 8 Multiple Regression from Heavy-Duty
The article €œExperimental Design Approach for the Optimization of the Separation of Enantiomers in Preparative Liquid Chromatography€ (S. Lai and Z. Lin, Separation Science and Technology, 2002: 847€“875) describes an experiment involving a chemical process designed to separate
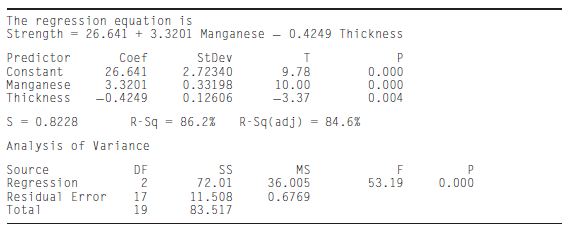
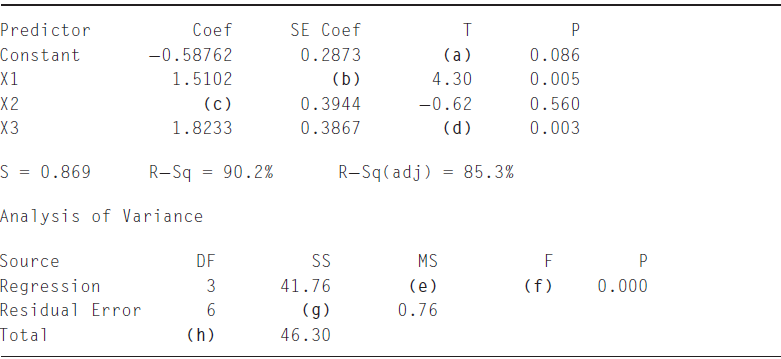
Refer to Exercise 1.a. Find a 95% confidence interval for the coefficient of Manganese.b. Find a 99% confidence interval for the coefficient of Thickness.c. Can you conclude that β1> 3? Perform the appropriate hypothesis test.d. Can you conclude that β2< ??0.1? Perform the appropriate
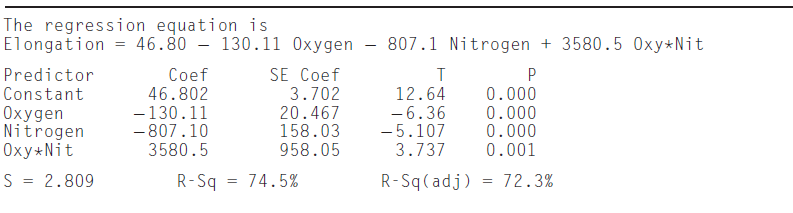
Refer to Exercise 1. a. Find a 95% confidence interval for the coefficient of Oxygen. b. Find a 99% confidence interval for the coefficient of Nitrogen. c. Find a 98% confidence interval for the coefficient of the interaction term Oxygen ? Nitrogen. d. Can you conclude that β1 < ??75? Find the
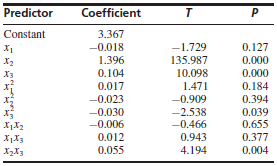
In the article referred to in Exercise 2, a model was fit to investigate the relationship between the independent variables given in Exercise 2 and the amount of S-isomer collected. The results of a least-squares fit are presented in the following table. (The article did not provide the value of
The article €œInfluence of Freezing Temperature on Hydraulic Conductivity of Silty Clay€ (J. Konrad and M. Samson, Journal of Geotechnical and Geoenvironmental Engineering, 2000:180€“187) describes a study of factors affecting hydraulic conductivity of soils. The
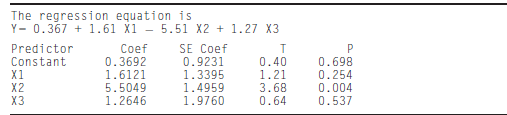
An engineer measures a dependent variable y and independent variables x1, x2, and x3. MINITAB output for the model y = β0+ β1x1+ β2x2+ β3x3+ ε is presented as follows.Of the following, which is the best next step in the analysis? Explain
The article “Application of Analysis of Variance to Wet Clutch Engagement” (M. Mansouri, M. Khonsari, et al., Proceedings of the Institution of Mechanical Engineers, 2002:117–125) presents the following fitted model for predicting clutch engagement time in seconds (y) from
An engineer tries three different methods for selecting a linear model. First she uses an informal method based on the F statistic, as described in Section 8.3. Then she runs the best subsets routine, and finds the model with the best adjusted R2 and the one with the best Mallows Cp. It turns out
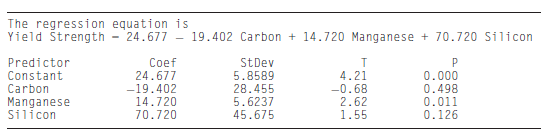
The article €œSimultaneous Optimization of Mechanical Properties of Steel by Maximizing Exponential Desirability Functions€ (K. J. Kim and D. K. J. Lin, Journal of the Royal Statistical Society Series C, Applied Statistics, 2000: 311€“325) presents measurements on 72
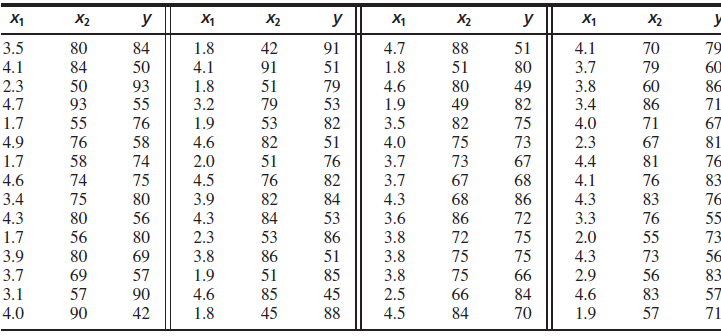
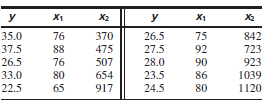
The following table lists values for three variables measured for 60 consecutive eruptions of the geyser Old Faithful in Yellowstone National Park. They are the duration of the eruption (x1), the duration of the dormant period immediately before the eruption (x2), and the duration of the dormant
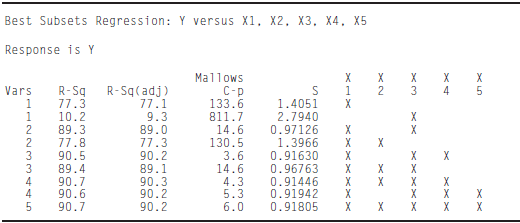
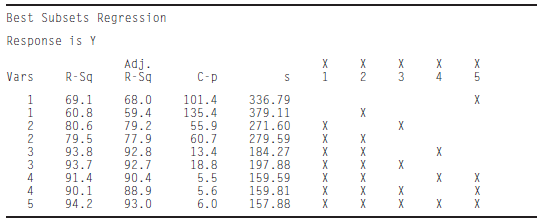
The following MINITAB output is for a best subsets regression involving five dependent variables X1, . . . , X5. The two models of each size with the highest values of R2are listed. a. Which variables are in the model selected by the minimum Cp criterion? b. Which variables are in the model
The article ??Earthmoving Productivity Estimation Using Linear Regression Techniques?? (S. Smith, Journal of Construction Engineering and Management, 1999:133??141) presents the following linear model to predict earthmoving productivity (in m3moved per hour): Where x1 = Number of trucks x2 =
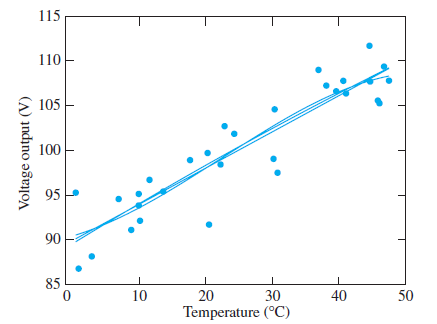
The voltage output (y) of a battery was measured over a range of temperatures (x) from 0°C to 50°C. The following figure is a scatterplot of voltage versus temperature, with three fitted curves superimposed. The curves are the linear model y = β0+ β1x +
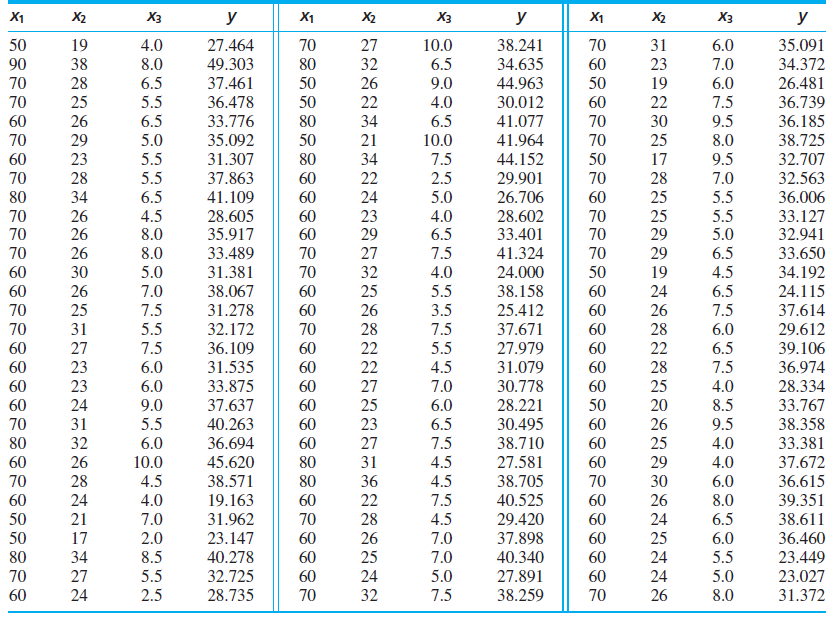
The data in Table SE6 (page 649) consist of yield measurements from many runs of a chemical reaction. The quantities varied were the temperature in ?C (x1), the concentration of the primary reactant in % (x2), and the duration of the reaction in hours (x3). The dependent variable (y) is the
The following is supposed to be the result of a best subsets regression involving five independent variables X1, . . . , X5. The two models of each size with the highest values of R2are listed. Something is wrong. What is it? Best Subsets Regression Response is Y Adj. R-Sq X 1. X 3 X 4 Vars R-Sq
The article ??Effect of Granular Subbase Thickness on Airfield Pavement Structural Response?? (K. Gopalakrishnan and M. Thompson, Journal of Materials in Civil Engineering, 2008:331??342) presents a study of the amount of surface deflection caused by aircraft landing on an airport runway. A load of
Refer to Exercise 7. a. Find a 95% confidence interval for the coefficient of Last FEV. b. Find a 98% confidence interval for the coefficient of Height. c. Can you conclude that β2 < ??0.08? Perform the appropriate hypothesis test. d. Can you conclude that β3 > 0.5? Perform the appropriate
The article €œDrying of Pulps in Sprouted Bed: Effect of Composition on Dryer Performance€ (M. Medeiros, S. Rocha, et al., Drying Technology, 2002:865€“881) presents measurements of pH, viscosity (in kg/m · s), density (in g/cm3), and BRIX (in percent). The
In a study to determine the effect of vehicle weight in tons (x1) and engine displacement in in3 (x2) on fuel economy in miles per gallon (y), these quantities were measured for ten automobiles. The full quadratic model y = β0 + β1x1 +β2x2 + β3x21+ β4x22+ β5x1x2 + ε was fit to the data, and
This exercise illustrates a reason for the exceptions to the rule of parsimony.a. A scientist fits the model Y = β1C + ε, where C represents temperature in °C and Y can represent any outcome. Note that the model has no intercept. Now convert °C to °F (C = 0.556F − 17.78). Does the model have
A scientist has measured quantities y, x1, and x2. She believes that y is related to x1 and x2 through the equation y = αeβ1 x1+β2 x2 δ, where δ is a random error that is always positive. Find a transformation of the data that will enable her to use a linear model to estimate β1 and β2.
The following MINITAB output is for a multiple regression. Something went wrong with the printer, so some of the numbers are missing. Fill in the missing numbers. Predictor Сoef SE Coef P Constant -0.58762 0.2873 (a) 0.086 X1 1.5102 (b) 4.30 0.005 X2 (c) 0.3944 -0.62 0.560 X3 1.8233 0.3867 (d)
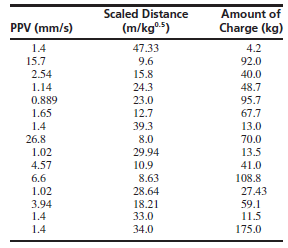
In rock blasting, the peak particle velocity (PPV) depends both on the distance from the blast and on the amount of charge. The article ??Prediction of Particle Velocity Caused by Blasting for an Infrastructure Excavation Covering Granite Bedrock?? (A. Kahriman, Mineral Resources Engineering,
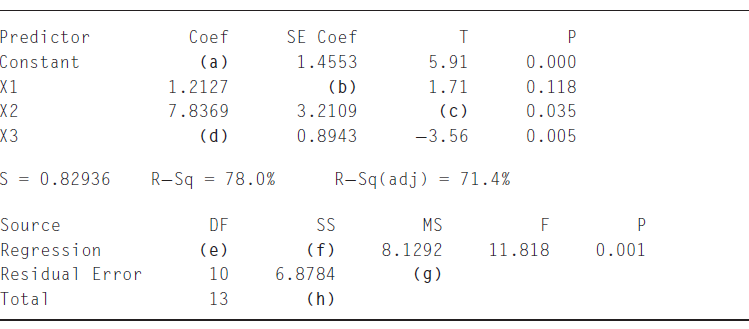
The following MINITAB output is for a multiple regression. Some of the numbers got smudged and are illegible. Fill in the missing numbers. Predictor Coef SE Coef T P Constant (a) 1.4553 5.91 0.000 X1 1.2127 (b) 1.71 0.118 X2 7.8369 3.2109 (c) 0.035 X3 (d) 0.8943 -3.56 0.005 S = 0.82936 R-Sq 78.0%
The article ??Permanent Deformation Characterization of Subgrade Soils from RLT Test?? (A. Puppala, L. Mohammad, et al., Journal of Materials in Civil Engineering, 1999:274??282) presents measurements of plastic strains (in percent) on soils at various confining and deviatoric stresses in kPa. The
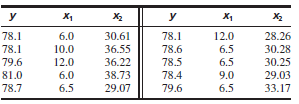
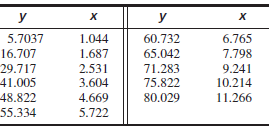
In the article “Low-Temperature Heat Capacity and Thermodynamic Properties of 1,1,1-trifluoro-2, 2-dichloroethane” (R.Varushchenko and A. Druzhinina, Fluid Phase Equilibria, 2002:109–119), the relationship between vapor pressure (p) and heat capacity (t) is given as p = tβ3 ·
The article €œVehicle-Arrival Characteristics at Urban Uncontrolled Intersections€ (V. Rengaraju and V. Rao, Journal of Transportation Engineering, 1995:317€“323) presents data on traffic characteristics at 10 intersections in Madras, India. The following table
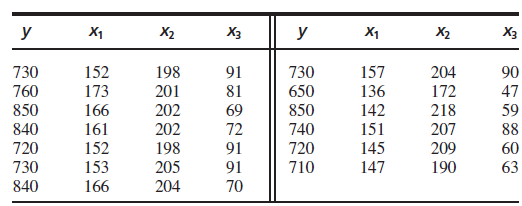
The following table presents measurements of mean noise levels in dBA (y), roadway width inm(x1), and mean speed in km/h (x2), for 10 locations in Bangkok, Thailand, as reported in the article ??Modeling of Urban Area Stop-and-Go Traffic Noise?? (P. Pamanikabud and C. Tharasawatipipat, Journal of
The following data were collected in an experiment to study the relationship between the speed of a cutting tool in m/s (x) and the lifetime of the tool in hours (y).The least-squares quadratic model is y = 101.4000 + 3.371429x ˆ’ 5.142857x2.a. Using this equation, compute the
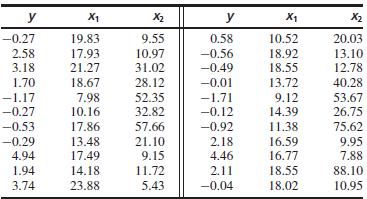
The article €œElectrical ImpedanceVariation withWater Saturation in Rock€ (Q. Su, Q. Feng, and Z. Shang, Geophysics, 2000:68€“75) reports measurements of permeabilities (in 10ˆ’3μm2), porosities (in percent), and surface area per unit volume of pore space (in 104 cmˆ’1) for
The article “Models for Assessing Hoisting Times of Tower Cranes” (A. Leung and C. Tam, Journal of Construction Engineering and Management, 1999: 385–391) presents a model constructed by a step wise regression procedure to predict the time needed for a tower crane hoisting operation. Twenty
The article €œMultiple Linear Regression for Lake Ice and Lake Temperature Characteristics€ (S. Gao and H. Stefan, Journal of Cold Regions Engineering, 1999:59€“77) presents data on maximum ice thickness in mm (y), average number of days per year of ice cover (x1),
The article ??Low-Temperature Heat Capacity and Thermodynamic Properties of 1,1,1-trifluoro-2, 2-dichloroethane?? (R. Varushchenko and A. Druzhinina, Fluid Phase Equilibria, 2002:109??119) presents measurements of the molar heat capacity (y) of 1,1,1-trifluoro-2,2-dichloroethane (in J ? K??1 ?
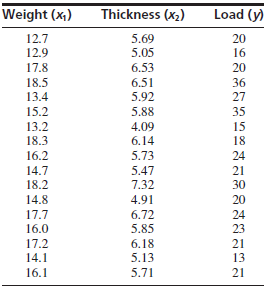
The article ??The Ball-on-Three-Ball Test for Tensile Strength: Refined Methodology and Results for Three Hohokam Ceramic Types?? (M. Beck, American Antiquity, 2002:558??569) discusses the strength of ancient ceramics. The following table presents measured weights (in g), thicknesses (in mm), and
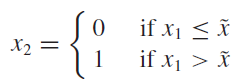
Piecewise linear model: Let x̃ be a knownconstant, and suppose that a dependent variable y is related to an independent variable x1as follows:In other words, y and x1 are linearly related, but different lines are appropriate depending on whether x1 ‰¤ x̃ or x1
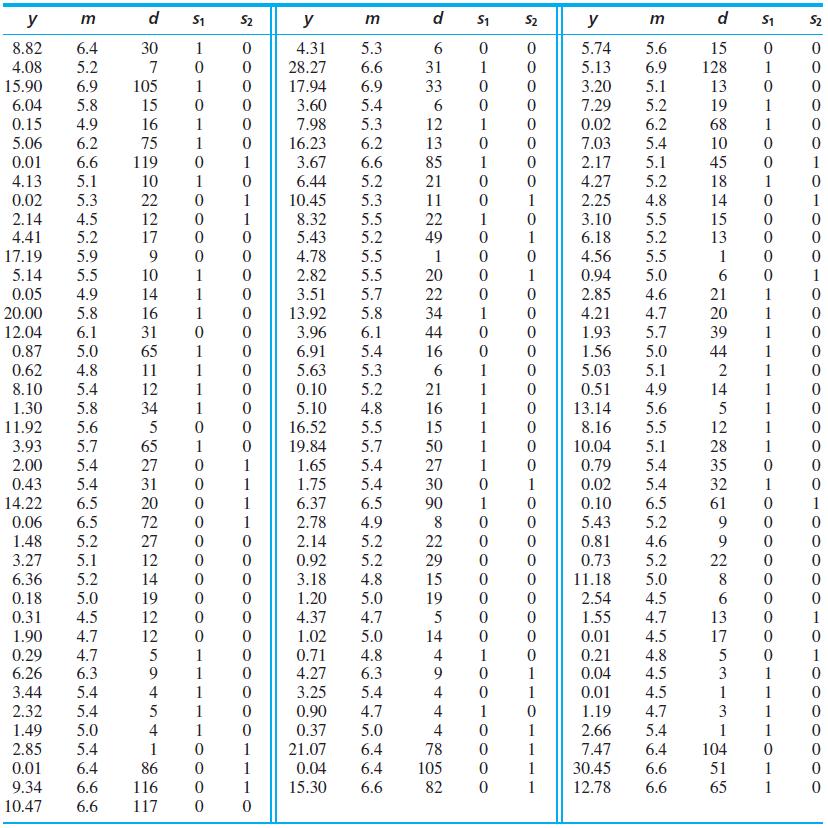
The article €œSeismic Hazard in Greece Based on Different Strong Ground Motion Parameters€ (S. Koutrakis, G. Karakaisis, et al., Journal of Earthquake Engineering, 2002:75€“109) presents a study of seismic events in Greece during the period 1978€“1997. Of interest is the duration of
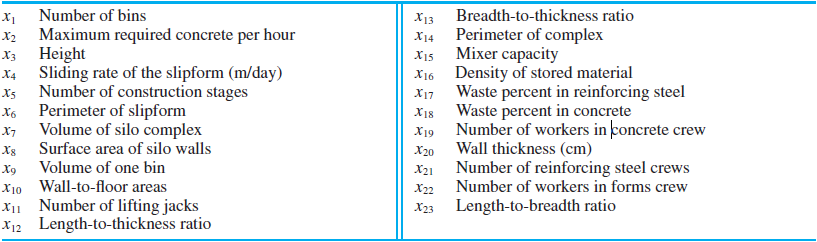
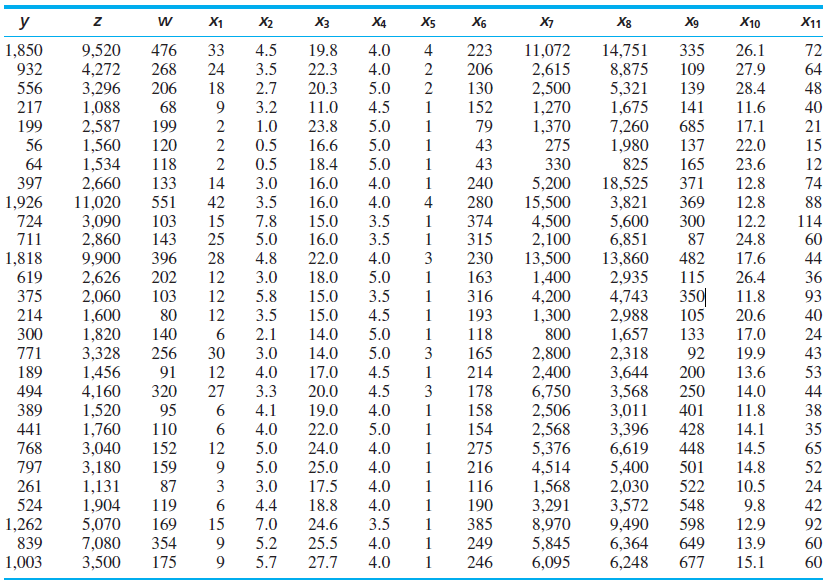
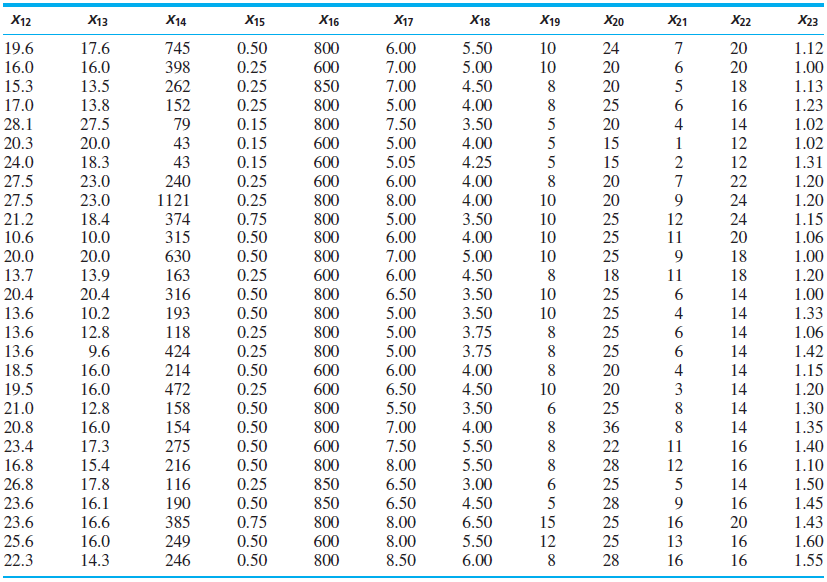
The article ??Estimating Resource Requirements at Conceptual Design Stage Using Neural Networks?? (A. Elazouni, I. Nosair, et al., Journal of Computing in Civil Engineering, 1997:217??223) suggests that certain resource requirements in the construction of concrete silos can be predicted from a
Copper wires are coated with a thin plastic coating. Samples of four wires are taken every hour, and the thickness of the coating (in mils) is measured. The data from the last 30 samples are presented in Table E12 on page 788. The means are X̅ = 150.075, R̅ = 6.97, and s̅ = 3.082.a. Compute the
Showing 300 - 400
of 790
1
2
3
4
5
6
7
8
Step by Step Answers