

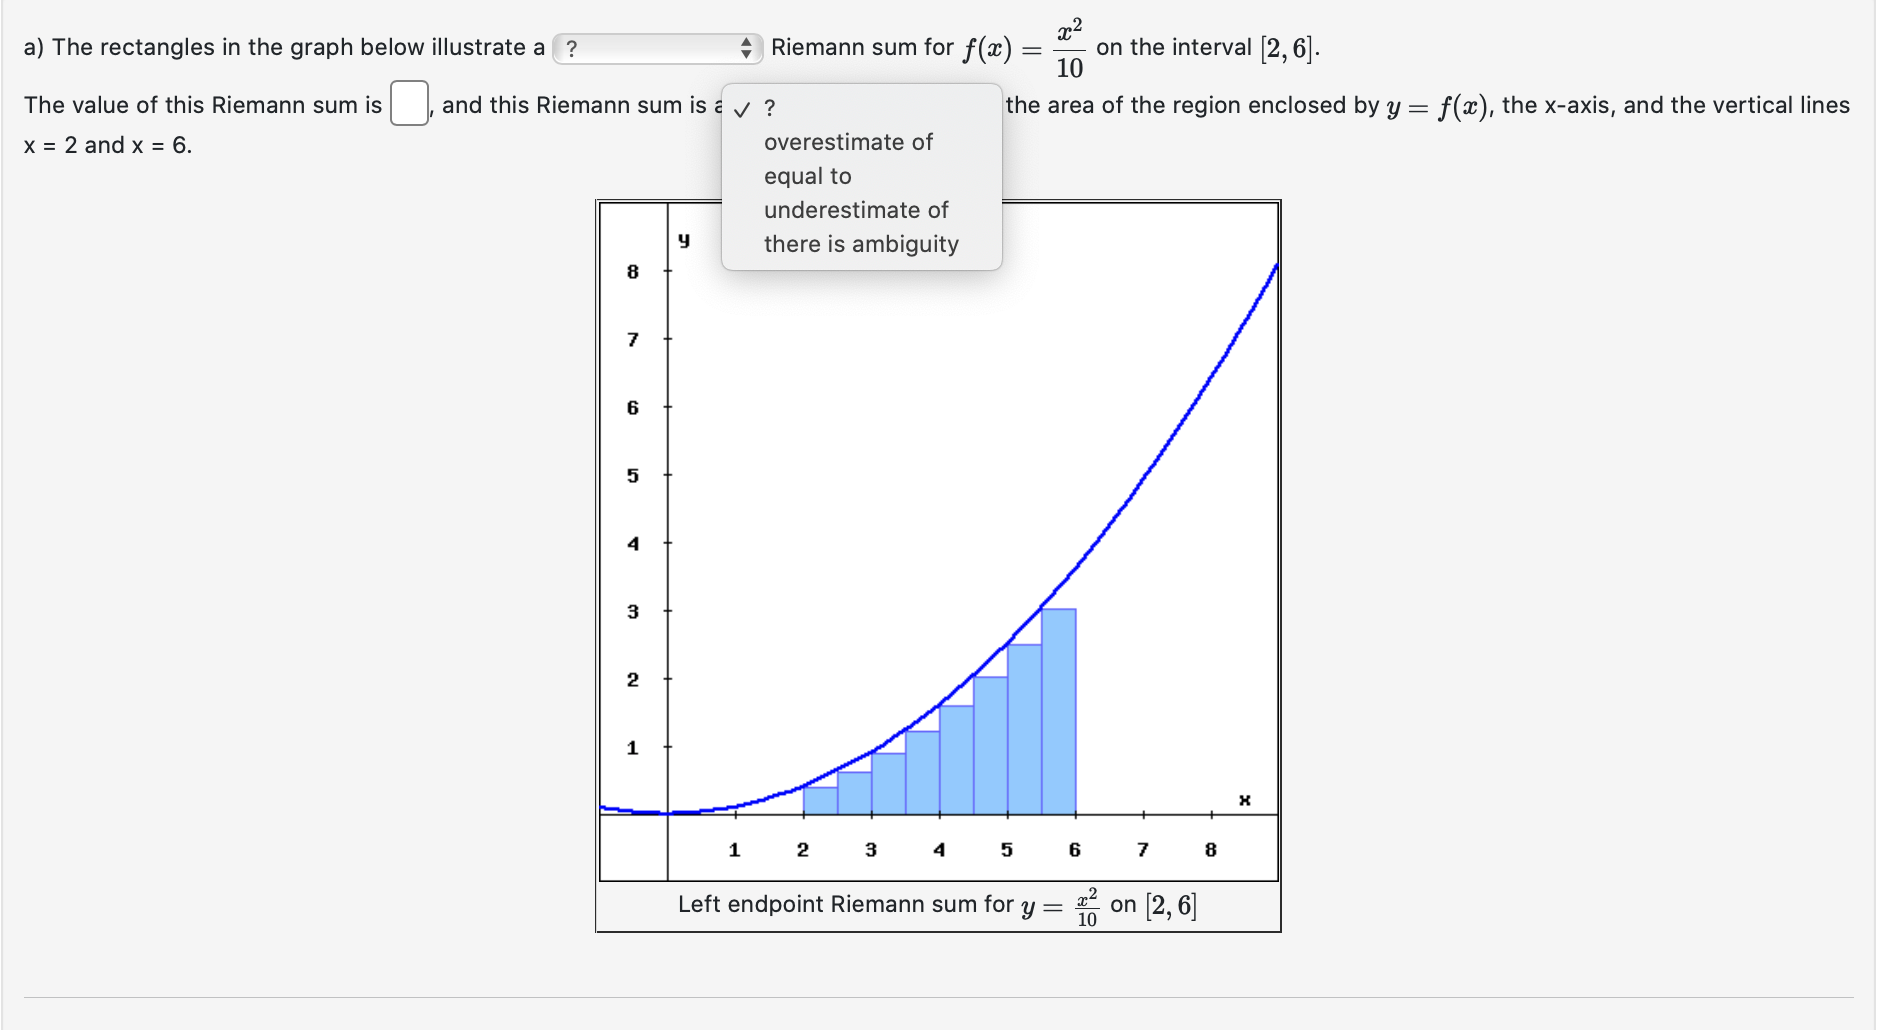
Question: 2 a) The rectangles in the graph below illustrate a Riemann sum for f(x) = :70 on the interval [2V 6]. the area of the
![sum for f(x) = :70 on the interval [2V 6]. the area](https://s3.amazonaws.com/si.experts.images/answers/2024/06/6666bc7aa548f_9546666bc7a80e5d.jpg)
![vertical lines The value of this Riemann sum is C], and this](https://s3.amazonaws.com/si.experts.images/answers/2024/06/6666bc7b72ecf_9556666bc7b54a3c.jpg)
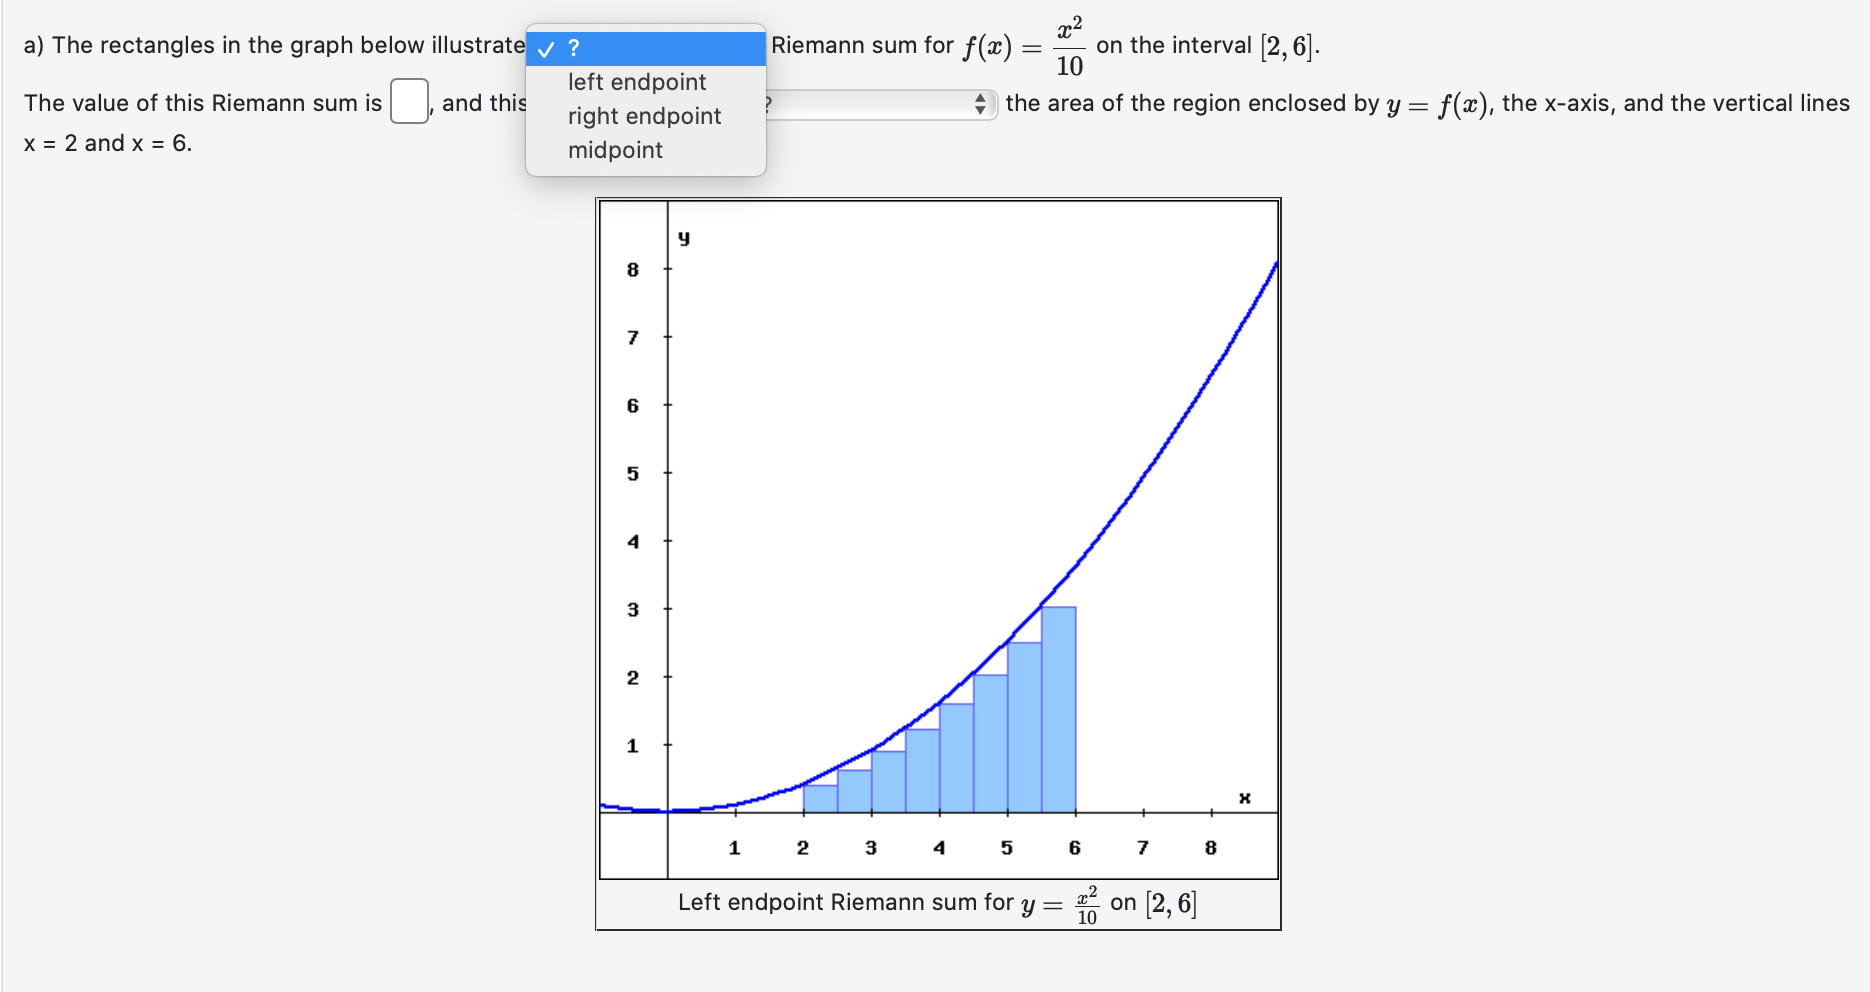

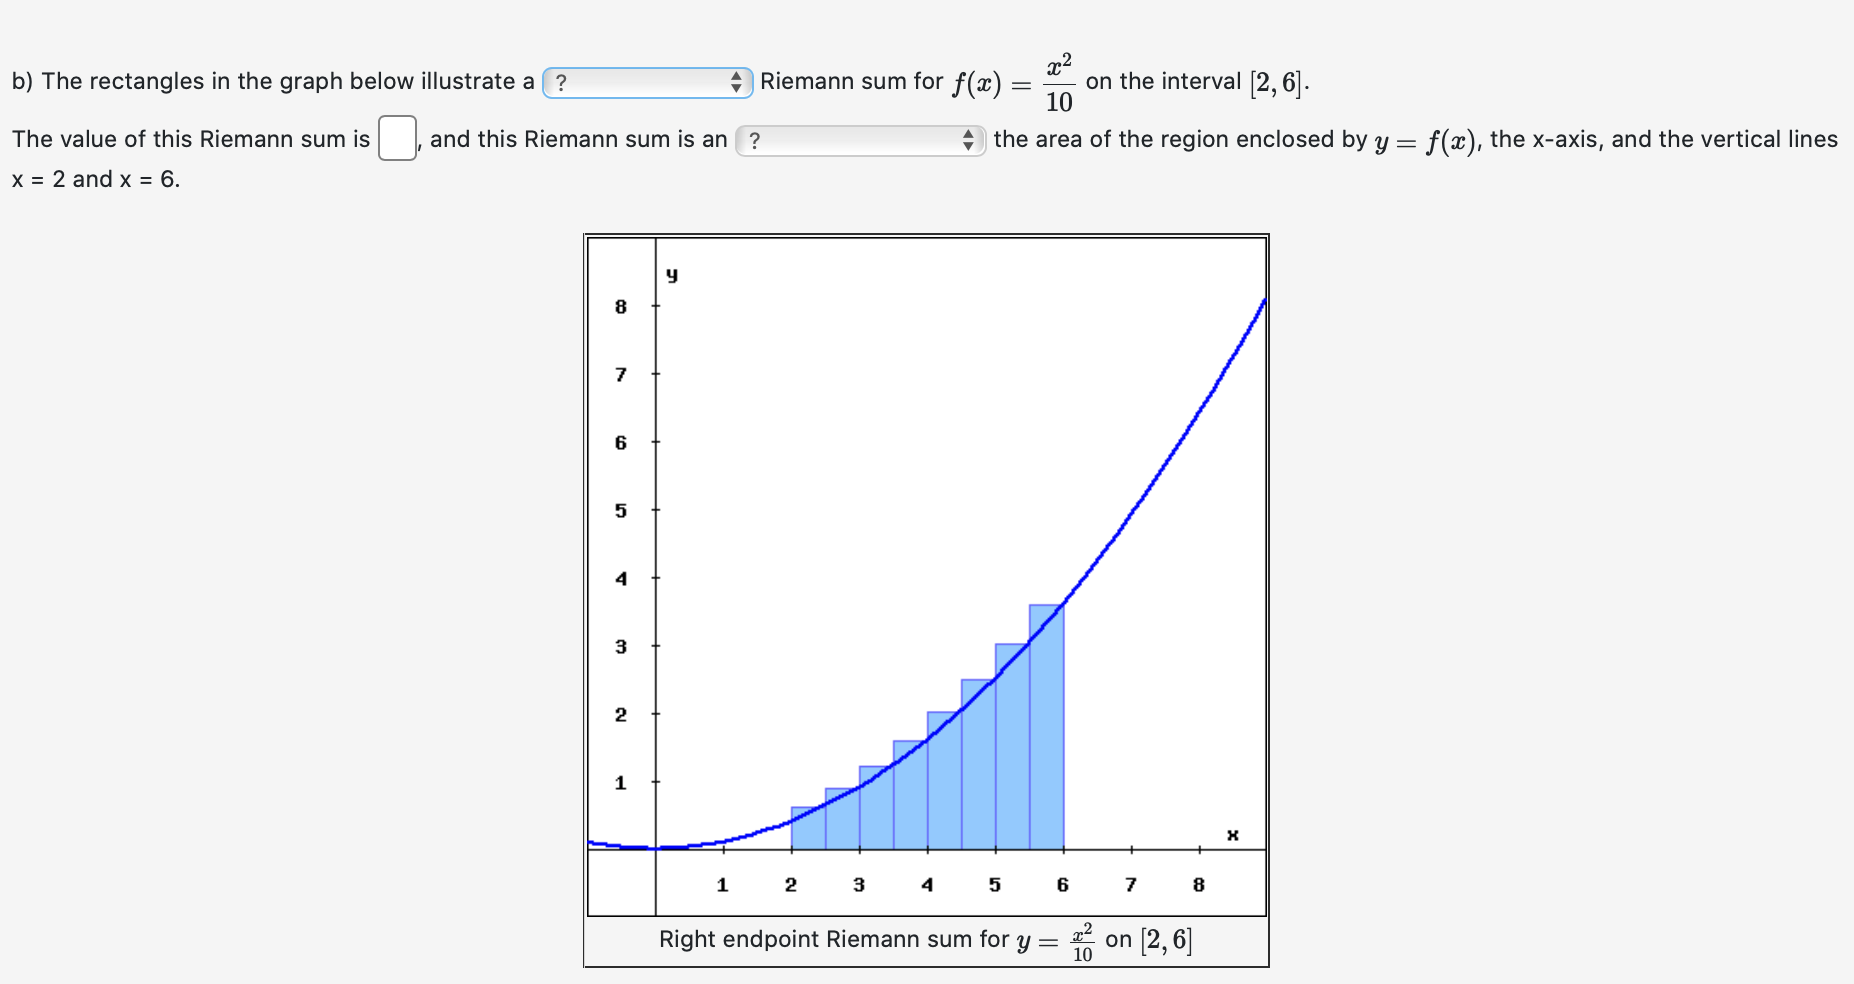
2 a) The rectangles in the graph below illustrate a Riemann sum for f(x) = :70 on the interval [2V 6]. the area of the region enclosed by y = f(m), the x-axis, and the vertical lines The value of this Riemann sum is C], and this Riemann sum is . \\l ? x = 2 and x = 6. overestimate of equal to underestimate of there is ambiguity . . 2 Left endpcunt Riemann sum for y = f_0 on [2, 6] a) The rectangles in the graph below illustrate v ? Riemann sum for f(a) = on the interval [2, 6]. The value of this Riemann sum is left endpoint 10 and this right endpoint the area of the region enclosed by y = f(x), the x-axis, and the vertical lines x = 2 and X = 6. midpoint y 8 7 6 5 2 1 2 5 6 7 8 Left endpoint Riemann sum for y = * on [2, 6]b) The rectangles in the graph below illustrate a (? The value of this Riemann sum is Riemann sum for f(a) = x = 2 and X = 6. and this Riemann sum is an ? 10 on the interval [2, 6]. +) the area of the region enclosed by y = f(x), the x-axis, and the vertical lines y 8 7 6 5 4 2 1 2 5 6 7 8 Right endpoint Riemann sum for y = $ on [2, 6]
Step by Step Solution
There are 3 Steps involved in it

Get step-by-step solutions from verified subject matter experts