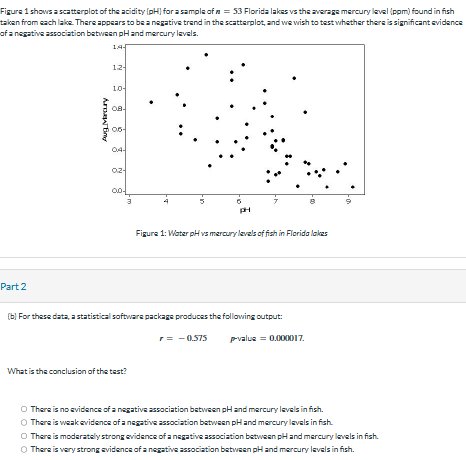
Question: answer Figure 1 shows a scatterplot of the acidity [pH) for a sample of A = 53 Florida lakes vs the average mercury level (pom)

answer

answer Figure 1 shows a scatterplot of the
Figure 1 shows a scatterplot of the acidity [pH) for a sample of A = 53 Florida lakes vs the average mercury level (pom) found in fish taken from each lake. There appears to be a negative trend in the scatterplot, and we wish to test whether there is significant evidence of = negative association between pHand mercury levels. 1.4- 12 10- Aug Mirar 04- Q2- 4 PH Figure 1: Water pH vs mercury levels of fish in Florida lakes Part 2 (6] For these data, a statistical software package produces the following output: F= - 0.575 p-value = 0.000017. What is the conclusion of the test? 0 There is no evidence of a negative association between pH and mercury levels in fish. O There is weak evidence of : negative association between ph and mercury levels in fish. O There is moderately strong evidence of a negative association between ph and mercury levels in fish. Q There is very strong evidence of a negative association between ph and mercury levels in fish

Step by Step Solution

There are 3 Steps involved in it

1 Expert Approved Answer
Step: 1 Unlock blur-text-image
Question Has Been Solved by an Expert!

Get step-by-step solutions from verified subject matter experts

Step: 2 Unlock
Step: 3 Unlock

Students Have Also Explored These Related Business Writing Questions!