

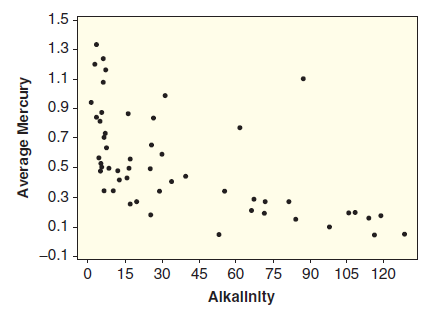
Question: The FloridaLakes dataset, introduced in Data 2.4, includes data on 53 lakes in Florida. Figure 9.10 shows a scatterplot of Alkalinity (concentration of calcium carbonate
The FloridaLakes dataset, introduced in Data 2.4, includes data on 53 lakes in Florida. Figure 9.10 shows a scatterplot of Alkalinity (concentration of calcium carbonate in mg/L) and AvgMercury (average mercury level for a sample of fish from each lake). Explain using the conditions for a linear model why we might hesitate to fit a linear model to these data to use Alkalinity to predict average mercury levels in fish.
Data 2.4
The FloridaLakes dataset describes characteristics of water samples taken at n = 53 Florida lakes. Alkalinity (concentration of calcium carbonate in mg/L) and acidity (pH) are given for each lake. In addition, the average mercury level is recorded for a sample of fish (large mouth bass) from each lake. A standardized mercury level is obtained by adjusting the mercury averages to account for the age of the fish in each sample. Notice that the cases are the 53 lakes and that all four variables are quantitative.
1.5 - 1.3- 1.1 - 0.9- 0.7 0.5 - 0.3- 0.1 -0.1 L 90 105 120 15 30 45 60 75 Alkallnlty Average Mercury
Step by Step Solution
3.44 Rating (167 Votes )
There are 3 Steps involved in it
There are several ways in which these data might raise concern There ... View full answer

Get step-by-step solutions from verified subject matter experts