

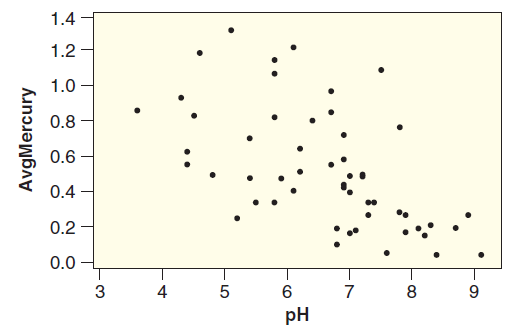
Question: Figure 4.26 shows a scatterplot of the acidity (pH) for a sample of n = 53 Florida lakes vs the average mercury level (ppm) found
Figure 4.26
 (a) What are the null and alternative hypotheses?
(b) For these data, a statistical software package produces the following output:
r = ˆ’0.575 p-value = 0.000017
Use the p-value to give the conclusion of the test. Include an assessment of the strength of the evidence and state your result in terms of rejecting or failing to reject H0 and in terms of pH and mercury.
(c) Is this convincing evidence that low pH causes the average mercury level in fish to increase? Why or why not?
Data 2.4 on page 68
The FloridaLakes dataset describes characteristics of water samples taken at n = 53 Florida lakes. Alkalinity (concentration of calcium carbonate in mg/L) and acidity (pH) are given for each lake. In addition, the average mercury level is recorded for a sample of fish (large mouth bass) from each lake. A standardized mercury level is obtained by adjusting the mercury averages to account for the age of the fish in each sample. Notice that the cases are the 53 lakes and that all four variables are quantitative.
1.4 1.2 1.0 - 0.8 0.6 0.4 0.2 0.0 3 4 5 9. pH AvgMercury Co
Step by Step Solution
3.50 Rating (167 Votes )
There are 3 Steps involved in it
a The hypotheses are H 0 0 vs H a 0 where is the correlation between pH and fish mercury leve... View full answer

Get step-by-step solutions from verified subject matter experts