

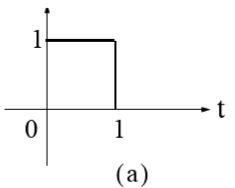
Question: BY USING MATLAB Use the heaviside and ezplot functionshow that u0(t)-u0(t-1) represents the rectangular pulse shown in Figure (a) 1 t 0 1 (a) 1
BY USING MATLAB
Use the heaviside and ezplot functionshow that u0(t)-u0(t-1) represents the rectangular pulse shown in Figure (a)
1 t 0 1 (a) 1 t 0 1 (a)
Step by Step Solution
There are 3 Steps involved in it
1 Expert Approved Answer
Step: 1 Unlock

Question Has Been Solved by an Expert!
Get step-by-step solutions from verified subject matter experts
Step: 2 Unlock
Step: 3 Unlock