

Question: Considering the following function, plot the corresponding x values for all integers t in the range t [1,1000] for Q = 0.010 and Q =
Considering the following function, plot the corresponding x values for all integers t in the range t [1,1000] for Q = 0.010 and Q = 0.045 on the same graph using MATLAB. x ^ 1 = 1. x ^ (t + 1) = x ^ t- e ^ -t / (t + 1) * Q * x ^ this
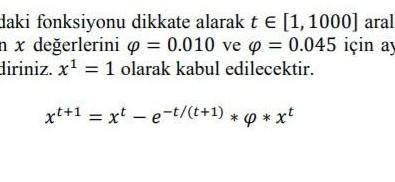
daki fonksiyonu dikkate alarak t e [1,1000] aral nx deerlerini p = 0.010 ve p = 0.045 iin ay diriniz. x1 = 1 olarak kabul edilecektir. xt+1 = xt - e-t/(t+1) * 4 *xt
Step by Step Solution
There are 3 Steps involved in it
1 Expert Approved Answer
Step: 1 Unlock

Question Has Been Solved by an Expert!
Get step-by-step solutions from verified subject matter experts
Step: 2 Unlock
Step: 3 Unlock