

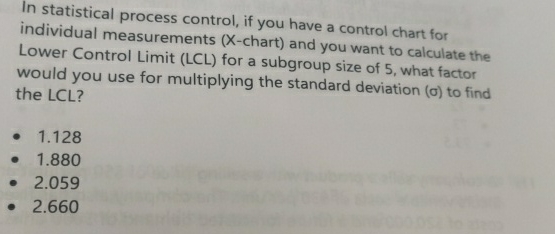
Question: In statistical process control, if you have a control chart for individual measurements ( x - chart ) and you want to calculate the Lower
In statistical process control, if you have a control chart for individual measurements chart and you want to calculate the Lower Control Limit LCL for a subgroup size of what factor would you use for multiplying the standard deviation to find the LCL
Step by Step Solution
There are 3 Steps involved in it
1 Expert Approved Answer
Step: 1 Unlock

Question Has Been Solved by an Expert!
Get step-by-step solutions from verified subject matter experts
Step: 2 Unlock
Step: 3 Unlock