

Question: Modeling Real-World Data Use constant differences or ratios to determine which parent function would best model the given data Does it represent a linear, quadratic,
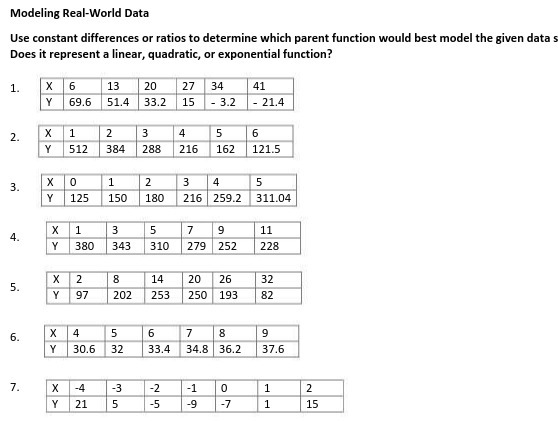
Modeling Real-World Data Use constant differences or ratios to determine which parent function would best model the given data Does it represent a linear, quadratic, or exponential function? 1. X 6 13 20 27 34 41 69.6 51.4 33.2 15 - 3.2 21.4 2. X 1 2 3 4 5 6 512 384 288 216 162 121.5 X 3 1 2 3 4 5 125 150 180 216 259.2 311.04 X 1 3 5 7 11 4 380 343 310 279 252 228 X 2 8 14 20 26 32 5. 97 202 253 250 193 82 6. X 4 5 6 7 8 9 30.6 32 33.4 34.8 36.2 37.6 7. X -4 -3 -1 0 1 2 Y 21 5 -5 -9 -7 1 15
Step by Step Solution
There are 3 Steps involved in it
1 Expert Approved Answer
Step: 1 Unlock

Question Has Been Solved by an Expert!
Get step-by-step solutions from verified subject matter experts
Step: 2 Unlock
Step: 3 Unlock