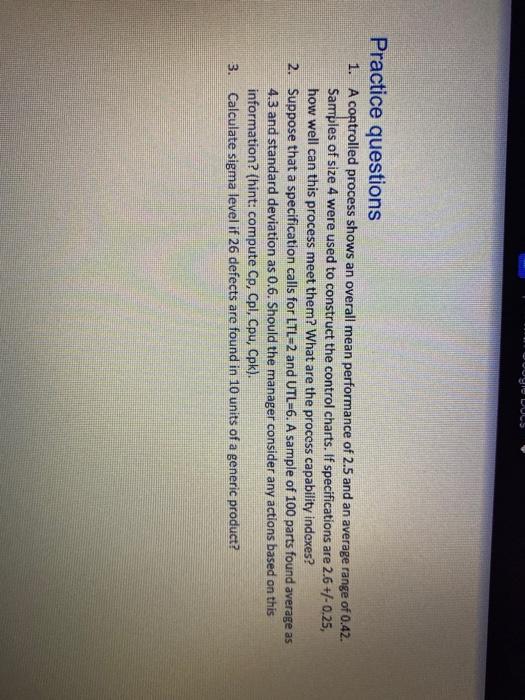
Question: Practice questions 1. A controlled process shows an overall mean performance of 2.5 and an average range of 0.42. Samples of size 4 were used

Practice questions 1. A controlled process shows
Practice questions 1. A controlled process shows an overall mean performance of 2.5 and an average range of 0.42. Samples of size 4 were used to construct the control charts. If specifications are 2.6 +/-0.25, how well can this process meet them? What are the process capability indexes? 2. Suppose that a specification calls for LTL=2 and UTL=6. A sample of 100 parts found average as 4.3 and standard deviation as 0.6. Should the manager consider any actions based on this information? (hint: compute Cp, Cpl, Cpu, Cpk). 3. Calculate sigma level if 26 defects are found in 10 units of a generic product? Sample Control Create the appropriate control chart using the provided data sets: 1. Sample Number 1 2 3 4 5 6 7 8 Sample Thickness (mm) 0.509 0.502 0.521 0.469 0.504 0.505 0.525 0.468 0.489 0.506 0.486 0.497 0.513 0.516 0.482 0.483 0.552 0.516 0.476 0.472 0.480 0.484 0.518 0.510 0.516 0.489 0.513 0.495 0.508 0.499 0.466 0.480 2. Lot Identification Sample Size Constant) Number Defectiv (In the Sample) 1 3 4 5 6 7 3 4 6 6 9 10 11 12 13 14 15 16 17 18 19 20 21 22 23 24 25 100 100 100 100 100 100 100 100 100 100 100 100 100 100 100 100 100 100 100 100 100 100 100 100 109 4

Step by Step Solution

There are 3 Steps involved in it

1 Expert Approved Answer
Step: 1 Unlock blur-text-image
Question Has Been Solved by an Expert!

Get step-by-step solutions from verified subject matter experts

Step: 2 Unlock
Step: 3 Unlock

Students Have Also Explored These Related General Management Questions!