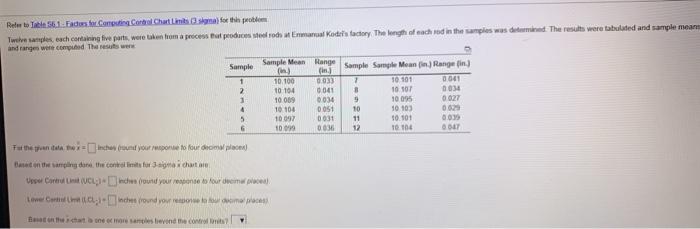
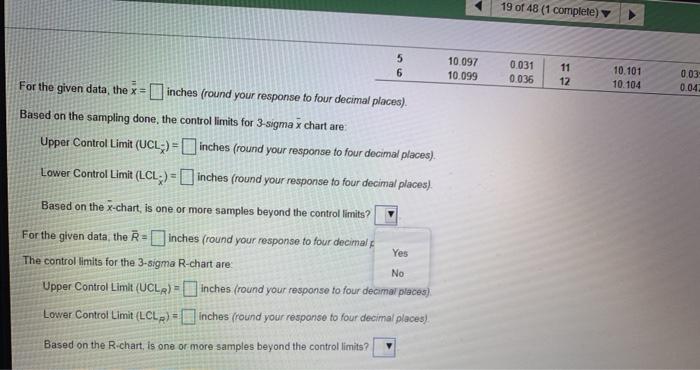
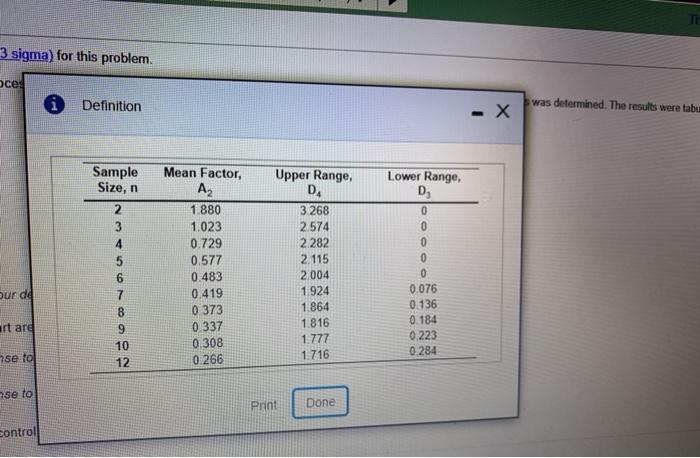
Question: Relee to Tel 56.1. Fast Computing Corbel Chart Limits for the problem Twelve samples, each containing five parts were taken from a process that produces

Relee to Tel 56.1. Fast Computing Corbel Chart
Relee to Tel 56.1. Fast Computing Corbel Chart Limits for the problem Twelve samples, each containing five parts were taken from a process that produces troch Emmanuel Kades tactory. The length of each od in the samples was determined. The results were tabulated and sample mean and anges were computed The resus went Sample Sample Mean Range in.) Sample Sample Meanin) Rangen) 1 10.100 0033 1 50109 000 2 10 104 0041 8 10 101 0034 3 10 009 0034 9 10095 0027 4 10 100 0051 10 10103 002 5 10 097 0031 11 10.101 0035 6 10 0036 12 1104 BAT Fut the underlinchey (rownut your post to four home placea) Brent and the continet for a chat Upper Coin (UCLdhe found your one to four Gempa Low Coche round your reto bom Bohet ne contestevand me 19 of 48 (1 complete) 5 6 10 097 10 099 0.031 0.036 11 12 10.101 10.104 0.03 0.042 For the given data, the x = inches (round your response to four decimal places). Based on the sampling done, the control limits for 3-sigma x chart are: Upper Control Limit (UCL) - inches (round your response to four decimal places). Lower Control Limit (LCL) - inches fround your response to four decimal places). Based on the x-chart, is one or more samples beyond the control limits? For the given data, the R- - inches (round your response to four decimal Yes The control limits for the 3-sigma R-chart are Upper Control Limit (UCLR) - inches (round your response to four decimar places) Lower Control Limit (LCLp) = inches (round your response to four decimal places) No Based on the R-chart, is one or more samples beyond the control limits? TE 3 sigma) for this problem. ces Definition was determined. The results were tabu -X Sample Size, n Lower Range, D 0 0 2 3 5 Mean Factor, A2 1.880 1.023 0.729 0.577 0.483 0.419 0 373 0337 0 308 0.266 Upper Range, D 3.268 2.574 2.282 2.115 2.004 1.924 1.864 1.816 1.777 1.716 Our dd 0 0.076 0.136 0.184 0.223 0.284 7 8 9 10 12 art are se to se to Print Done control

Step by Step Solution

There are 3 Steps involved in it

1 Expert Approved Answer
Step: 1 Unlock blur-text-image
Question Has Been Solved by an Expert!

Get step-by-step solutions from verified subject matter experts

Step: 2 Unlock
Step: 3 Unlock

Students Have Also Explored These Related General Management Questions!